0
New
New
2023
Anti-obesity Drugs Market

Anti-Obesity Drugs Market

by Drug Type (Prescription Drugs, Over The Counter Drugs), by Mechanism of Action (Centrally Acting Anti-Obesity Drugs, Peripherally Acting Anti-Obesity Drugs), by Route of Administration (Oral Route, Subcutaneous Route), by Distribution Channel (Hospital Pharmacies, Retail Pharmacies, Online Pharmacies): Global Opportunity Analysis and Industry Forecast, 2023-2032

Report Code: A03823
Apr 2023 | Pages: 447
Tables: 158
Charts: 63
  • Formats*:

  • pdf

    Single User License, Five User
    License & Enterprise User License

  • xls

    Data Pack Excel License

  • ppt

    It comes with the additional cost
    of $2500.00 contact sales.


Anti-Obesity Drugs Market Research, 2032

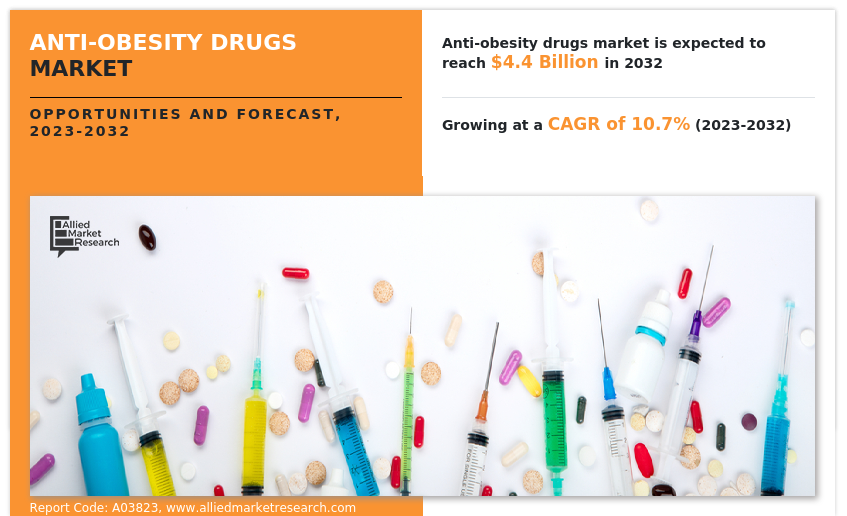
The anti-obesity drugs market size was valued at $1,605.36 million in 2022 and is estimated to reach $4,439.34 million by 2032, exhibiting a CAGR of 10.7% from 2023 to 2032. Obesity is a medical condition in which excess body fat has accumulated to an extent that it may cause a negative effect on health. It is generally defined as having a body mass index (BMI) of 30 or greater. It is widely recognized as the largest and fastest-growing public health problem in developed and developing countries. Anti-obesity drugs are medications prescribed to help people who are overweight. These drugs work by suppressing appetite, increasing metabolism, or blocking the absorption of fat from food. Some of the commonly prescribed anti-obesity drugs include phentermine, sibutramine, orlistat, and liraglutide. 
The overall impact of COVID-19 remains negative on the anti-obesity drugs market. The anti-obesity drugs market experienced decline in growth during the lockdown period owing to decrease in the number of research and development activities that have been severely affected due to lockdowns and travel restrictions, resulting in a slowdown in the introduction of new drugs.

Anti-Obesity Drugs Market

Market dynamics 

The key factor that drives the growth of the anti-obesity drugs market share is significant rise in the prevalence rate of obesity, surge in the health risks associated with being overweight or obese, and the increase in the number of research and development activities on several potential drug molecules that target both obesity and type 2 diabetes mellitus by key market players. For instance, in June 2021 Novo Nordisk announced that the U.S. Food and Drug Administration (FDA) has approved Wegovy for once weekly semaglutide 2.4 mg injection in the U.S. for chronic weight management. Rise in number of clinical trials for the treatment of obesity is expected to drive the anti-obesity drugs market growth. For instance, major companies such as ERX Pharmaceuticals, Amgen, Allysta Pharmaceuticals, Eli Lilly and others are developing potential drug alternatives  to improve the obesity treatment scenario.  

Furthermore, increase in R&D activities among key players for the development of anti-obesity drugs with less side effects is one of the major factors anticipated to foster the growth of the anti-obesity drugs market share. For instance, in December 2021, Tonix Pharmaceuticals Holding Cor Innovent Biologics company, which is engaged in the development of anti-obesity medication, announced its topline results from its Phase II clinical trial (NCT04904913) of IBI362, a glucagon-like peptide 1 receptor (GLP-1R) and glucagon receptor (GCGR) dual agonist in China for obesity treatment.  

However, the stringent regulatory compliance for the approval of anti-obesity drugs and potential side effects of anti-obesity drugs such as increased blood pressure and heart rate hampers the growth of the anti-obesity drugs market size. Conversely rise in the prevalence of obesity rate and increase in awareness regarding obesity treatment in emerging economies such as India, China, Mexico, and Brazil are anticipated to create new opportunities during the forecast period.

Segmental Overview

The anti-obesity drugs market is segmented on the basis of drug type, mechanism of action, distribution channel, and region. By drug type, the market is bifurcated into prescription drugs, and over the counter drugs. By mechanism of action, the market is divided into centrally acting anti-obesity drugs and peripherally acting anti-obesity drugs. By route of administration, the market is bifurcated into oral route and subcutaneous route. By distribution channel, the market is classified into hospital pharmacies, retail pharmacies and online pharmacies. Region-wise, the market is analyzed across North America, Europe, Asia-Pacific, and LAMEA.  

By drug type 

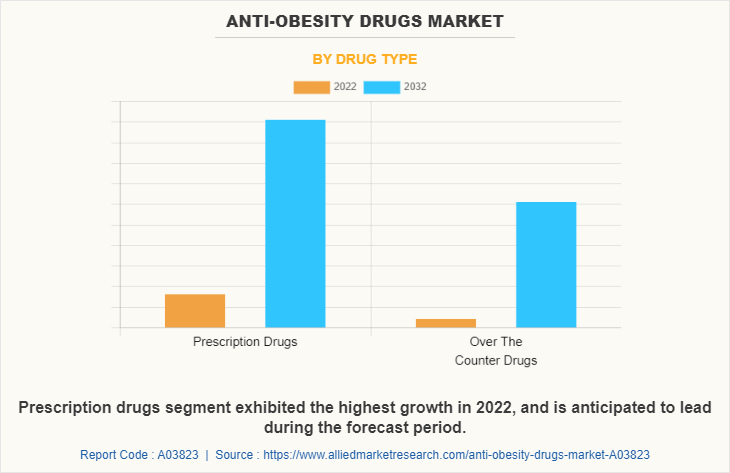
The anti-obesity drugs market is segmented into prescription drugs, and over the counter drugs. In 2022, the prescription drugs segment accounted for the largest share of the market and is projected to exhibit the fastest market growth during the forecast period, owing to rise in the prevalence of obesity and increase in the number of anti-obesity drugs in the pipeline phase are the key factors that drive the growth of the market.  
Anti-Obesity Drugs Market

By mechanism of action 

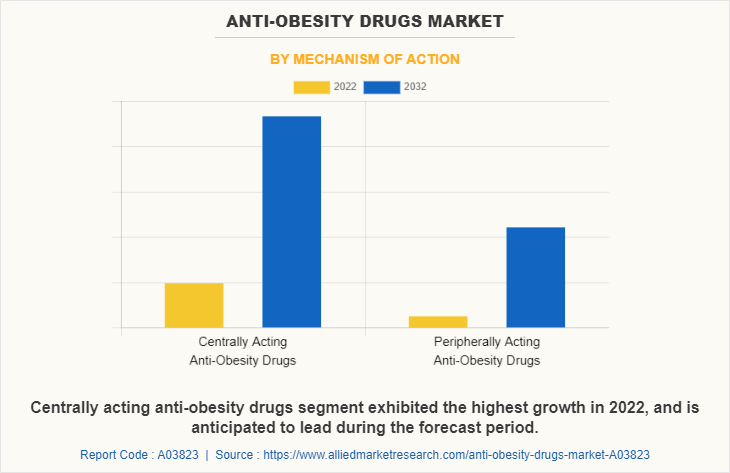
The anti-obesity drugs market is segmented into centrally acting anti-obesity drugs and peripherally acting anti-obesity drugs. In 2022, the centrally acting anti-obesity drugs segment accounted for the largest share of the market and is projected to exhibit the fastest market growth during the forecast period, owing to rise in awareness among people regarding the availability of centrally acting anti-obesity drugs and increase in number of product approvals across the world.  
Anti-Obesity Drugs Market

By route of administration 

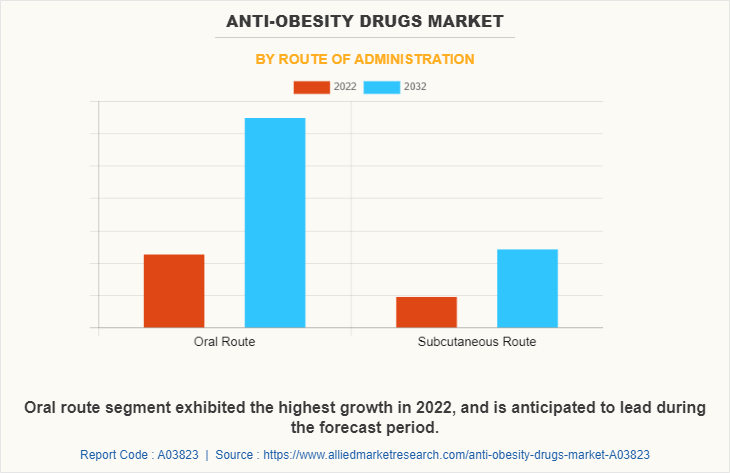
The anti-obesity drugs market is bifurcated into oral route and subcutaneous route. In 2022, the oral route segment accounted for the largest share of the market and is projected to exhibit the fastest market growth during the forecast period, owing to the fact that oral medications are typically more cost-effective than other forms of administration, such as injections or infusions, which require more resources and equipment.     
Anti-Obesity Drugs Market

By distribution channel 

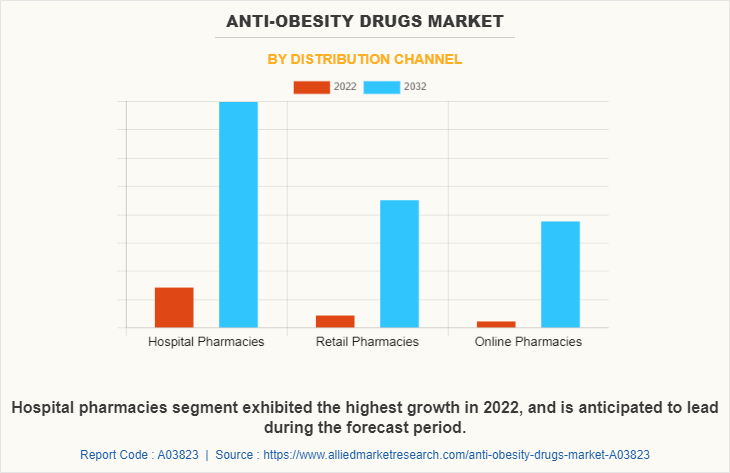
The anti-obesity drugs market is segmented into hospital pharmacies, retail pharmacies and online pharmacies, the hospital pharmacies segment exhibited the highest growth in 2022, and is anticipated to lead during the forecast period, owing to rise in prevalence of obesity and  surge in demand for prescription based anti-obesity drugs. 
Anti-Obesity Drugs Market

By region 

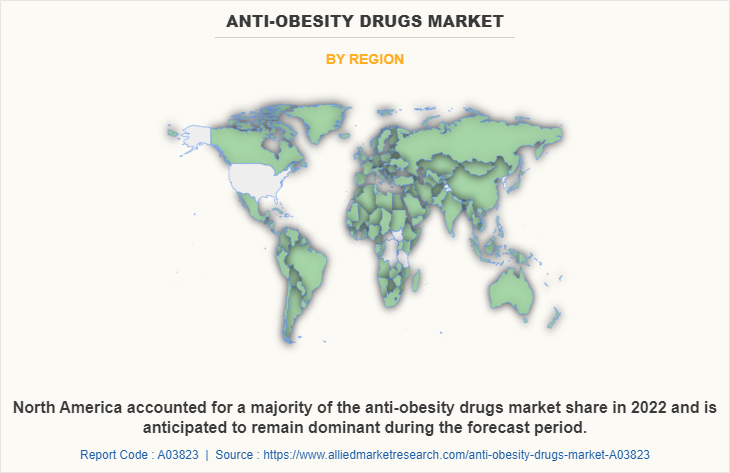
The anti-obesity drugs market is analyzed across North America, Europe, Asia-Pacific, and LAMEA. The anti-obesity drugs market is mainly driven by the increase in the obese population and high healthcare expenditure on anti-obesity drugs. Furthermore, rise in the awareness among the population regarding severe chronic diseases related to obesity and increase in number of clinical trials owing to a rise in investment by key market players in R&D activities are expected to fuel the market growth.  

Asia-Pacific is expected to witness growth at the highest rate during the anti-obesity drugs market forecast owing to the increase in demand for anti-obesity drugs. Furthermore, the increase in prevalence of obesity and rise in the awareness about anti-obesity drugs in developing countries such as India, China, and South Korea contribute toward the growth of the anti-obesity drug market in the region.
Anti-Obesity Drugs Market

Competition Analysis 

The report provides competitive analysis and profiles of the major players in the anti-obesity drugs industry, such as Currax Pharmaceuticals LLC, Pfizer Inc, Novo Nordisk A/S, GlaxoSmithKline plc, Boehringer Ingelheim International GmbH, KVK Tech Inc, CHEPLAPHARM Arzneimittel GmbH, Gelesis Holdings, INC., VIVUS LLC, and Rhythm Pharmaceuticals.   

Recent product launch in the anti-obesity drugs market

  • In June 2021 Novo Nordisk announced that the U.S. Food and Drug Administration (FDA) has approved Wegovy for once weekly semaglutide 2.4 mg injection in the U.S. for chronic weight management. Thus, launch of the new anti-obesity drugs will help the company to gain a strong foothold in the anti-obesity drugs industry.
  • In June 2020 Gelesis announced that it has received approval to market Plenity, a novel weight loss treatment, in Europe. Gelesis received a Conformité Européenne (CE) mark for Plenity as a class III medical device indicated for weight loss in overweight and obese adultswith a Body Mass Index (BMI) of 25–40 kg/m2, when used in conjunction with diet and exercise. 
  • In April 2019 Gelesis announced that the United States Food and Drug Administration (FDA) has cleared the Company’s lead product candidate, PLENITY (Gelesis100), as an aid in weight management in adults with a Body Mass Index (BMI) of 25–40 kg/m2, when used in conjunction with diet and exercise. 

Recent partnership in anti-obesity drugs market

  • In June 2020 Gelesis announced a partnership with China Medical System Holdings Limited for the commercialization of Plenity in China. CMS is a well-established, innovation-driven specialty pharma company with a focus on sales and marketing in China. 

Key Benefits For Stakeholders

  • This report provides a quantitative analysis of the market segments, current trends, estimations, and dynamics of the anti-obesity drugs market analysis from 2022 to 2032 to identify the prevailing anti-obesity drugs market opportunity.
  • The market research is offered along with information related to key drivers, restraints, and opportunities.
  • Porter's five forces analysis highlights the potency of buyers and suppliers to enable stakeholders make profit-oriented business decisions and strengthen their supplier-buyer network.
  • In-depth analysis of the anti-obesity drugs market segmentation assists to determine the prevailing market opportunities.
  • Major countries in each region are mapped according to their revenue contribution to the market.
  • Market player positioning facilitates benchmarking and provides a clear understanding of the present position of the market players.
  • The report includes the analysis of the regional as well as anti-obesity drugs market trends, key players, market segments, application areas, and market growth strategies.

Anti-Obesity Drugs Market Report Highlights

Aspects Details
Market Size By 2032 USD 4.4 billion
Growth Rate CAGR of 10.7%
Forecast period 2022 - 2032
Report Pages 447
By Drug Type
  • Prescription Drugs
  • Over The Counter Drugs
By Mechanism of Action
  • Centrally Acting Anti-Obesity Drugs
  • Peripherally Acting Anti-Obesity Drugs
By Route of Administration
  • Oral Route
  • Subcutaneous Route
By Distribution Channel
  • Hospital Pharmacies
  • Retail Pharmacies
  • Online Pharmacies
By Region
  • North America  (U.S., Canada, Mexico)
  • Europe  (Germany, France, UK, Italy, Spain, Rest of Europe)
  • Asia-Pacific  (Japan, China, Australia, India, South Korea, Rest of Asia-Pacific)
  • LAMEA  (Brazil, Saudi Arabia, South Africa, Rest of LAMEA)
Key Market Players Gelesis Holdings, INC., Novo Nordisk A/S, Currax Pharmaceuticals LLC, Rhythm Pharmaceuticals, Boehringer Ingelheim International GmbH, KVK Tech Inc., CHEPLAPHARM Arzneimittel GmbH, Pfizer Inc., GlaxoSmithKline plc, Vivus LLC.

Analyst Review

According to the insights of CXOs, the anti-obesity drugs market is expected to witness significant growth in the future, owing to increase in the prevalence of obesity, rise in the development of new and innovative anti-obesity drugs, and surge in R&D activities by key market players.  

The anti-obesity drugs market is expected to witness steady growth in the future. The increase in the prevalence of obesity and rise in awareness regarding obesity treatment fuel the growth of the market. In addition, surge in investments in R&D activities by pharmaceutical companies and increase in healthcare expenditure in developed countries like U.S. and Canada boost the growth of the market. However, the availability of alternative therapies for weight loss and the potential side effects of anti-obesity drugs hampers the growth of the market up to some extent during the forecast period.   

North America is expected to dominate the anti-obesity drugs market during the forecast period, followed by Europe. In addition, emerging economies such as India, China, Mexico, and Brazil are expected to offer lucrative opportunities owing to surge in unhealthy and sedentary lifestyle, rise in geriatric population, and increase in prevalence of obesity are the key factors attributing to the growth of the market.

 
  • CHAPTER 1: INTRODUCTION

    • 1.1. Report description

    • 1.2. Key market segments

    • 1.3. Key benefits to the stakeholders

    • 1.4. Research Methodology

      • 1.4.1. Primary research

      • 1.4.2. Secondary research

      • 1.4.3. Analyst tools and models

  • CHAPTER 2: EXECUTIVE SUMMARY

    • 2.1. CXO Perspective

  • CHAPTER 3: MARKET OVERVIEW

    • 3.1. Market definition and scope

    • 3.2. Key findings

      • 3.2.1. Top impacting factors

      • 3.2.2. Top investment pockets

    • 3.3. Porter’s five forces analysis

      • 3.3.1. Bargaining power of suppliers

      • 3.3.2. Bargaining power of buyers

      • 3.3.3. Threat of substitutes

      • 3.3.4. Threat of new entrants

      • 3.3.5. Intensity of rivalry

    • 3.4. Market dynamics

      • 3.4.1. Drivers

        • 3.4.1.1. Increase in the prevalence of obesity
        • 3.4.1.2. Increase in number of drugs in pipeline
        • 3.4.1.3. Increase in number of clinical trials

      • 3.4.2. Restraints

        • 3.4.2.1. Potential side effects of anti-obesity drugs

      • 3.4.3. Opportunities

        • 3.4.3.1. High growth potential in developing economies

    • 3.5. COVID-19 Impact Analysis on the market

  • CHAPTER 4: ANTI-OBESITY DRUGS MARKET, BY DRUG TYPE

    • 4.1. Overview

      • 4.1.1. Market size and forecast

    • 4.2. Prescription Drugs

      • 4.2.1. Key market trends, growth factors and opportunities

      • 4.2.2. Market size and forecast, by region

      • 4.2.3. Market share analysis by country

    • 4.3. Over The Counter Drugs

      • 4.3.1. Key market trends, growth factors and opportunities

      • 4.3.2. Market size and forecast, by region

      • 4.3.3. Market share analysis by country

  • CHAPTER 5: ANTI-OBESITY DRUGS MARKET, BY MECHANISM OF ACTION

    • 5.1. Overview

      • 5.1.1. Market size and forecast

    • 5.2. Centrally Acting Anti-Obesity Drugs

      • 5.2.1. Key market trends, growth factors and opportunities

      • 5.2.2. Market size and forecast, by region

      • 5.2.3. Market share analysis by country

    • 5.3. Peripherally Acting Anti-Obesity Drugs

      • 5.3.1. Key market trends, growth factors and opportunities

      • 5.3.2. Market size and forecast, by region

      • 5.3.3. Market share analysis by country

  • CHAPTER 6: ANTI-OBESITY DRUGS MARKET, BY ROUTE OF ADMINISTRATION

    • 6.1. Overview

      • 6.1.1. Market size and forecast

    • 6.2. Oral Route

      • 6.2.1. Key market trends, growth factors and opportunities

      • 6.2.2. Market size and forecast, by region

      • 6.2.3. Market share analysis by country

    • 6.3. Subcutaneous Route

      • 6.3.1. Key market trends, growth factors and opportunities

      • 6.3.2. Market size and forecast, by region

      • 6.3.3. Market share analysis by country

  • CHAPTER 7: ANTI-OBESITY DRUGS MARKET, BY DISTRIBUTION CHANNEL

    • 7.1. Overview

      • 7.1.1. Market size and forecast

    • 7.2. Hospital Pharmacies

      • 7.2.1. Key market trends, growth factors and opportunities

      • 7.2.2. Market size and forecast, by region

      • 7.2.3. Market share analysis by country

    • 7.3. Retail Pharmacies

      • 7.3.1. Key market trends, growth factors and opportunities

      • 7.3.2. Market size and forecast, by region

      • 7.3.3. Market share analysis by country

    • 7.4. Online Pharmacies

      • 7.4.1. Key market trends, growth factors and opportunities

      • 7.4.2. Market size and forecast, by region

      • 7.4.3. Market share analysis by country

  • CHAPTER 8: ANTI-OBESITY DRUGS MARKET, BY REGION

    • 8.1. Overview

      • 8.1.1. Market size and forecast By Region

    • 8.2. North America

      • 8.2.1. Key trends and opportunities

      • 8.2.2. Market size and forecast, by Drug Type

      • 8.2.3. Market size and forecast, by Mechanism of Action

      • 8.2.4. Market size and forecast, by Route of Administration

      • 8.2.5. Market size and forecast, by Distribution Channel

      • 8.2.6. Market size and forecast, by country

        • 8.2.6.1. U.S.
          • 8.2.6.1.1. Key market trends, growth factors and opportunities
          • 8.2.6.1.2. Market size and forecast, by Drug Type
          • 8.2.6.1.3. Market size and forecast, by Mechanism of Action
          • 8.2.6.1.4. Market size and forecast, by Route of Administration
          • 8.2.6.1.5. Market size and forecast, by Distribution Channel
        • 8.2.6.2. Canada
          • 8.2.6.2.1. Key market trends, growth factors and opportunities
          • 8.2.6.2.2. Market size and forecast, by Drug Type
          • 8.2.6.2.3. Market size and forecast, by Mechanism of Action
          • 8.2.6.2.4. Market size and forecast, by Route of Administration
          • 8.2.6.2.5. Market size and forecast, by Distribution Channel
        • 8.2.6.3. Mexico
          • 8.2.6.3.1. Key market trends, growth factors and opportunities
          • 8.2.6.3.2. Market size and forecast, by Drug Type
          • 8.2.6.3.3. Market size and forecast, by Mechanism of Action
          • 8.2.6.3.4. Market size and forecast, by Route of Administration
          • 8.2.6.3.5. Market size and forecast, by Distribution Channel
    • 8.3. Europe

      • 8.3.1. Key trends and opportunities

      • 8.3.2. Market size and forecast, by Drug Type

      • 8.3.3. Market size and forecast, by Mechanism of Action

      • 8.3.4. Market size and forecast, by Route of Administration

      • 8.3.5. Market size and forecast, by Distribution Channel

      • 8.3.6. Market size and forecast, by country

        • 8.3.6.1. Germany
          • 8.3.6.1.1. Key market trends, growth factors and opportunities
          • 8.3.6.1.2. Market size and forecast, by Drug Type
          • 8.3.6.1.3. Market size and forecast, by Mechanism of Action
          • 8.3.6.1.4. Market size and forecast, by Route of Administration
          • 8.3.6.1.5. Market size and forecast, by Distribution Channel
        • 8.3.6.2. France
          • 8.3.6.2.1. Key market trends, growth factors and opportunities
          • 8.3.6.2.2. Market size and forecast, by Drug Type
          • 8.3.6.2.3. Market size and forecast, by Mechanism of Action
          • 8.3.6.2.4. Market size and forecast, by Route of Administration
          • 8.3.6.2.5. Market size and forecast, by Distribution Channel
        • 8.3.6.3. UK
          • 8.3.6.3.1. Key market trends, growth factors and opportunities
          • 8.3.6.3.2. Market size and forecast, by Drug Type
          • 8.3.6.3.3. Market size and forecast, by Mechanism of Action
          • 8.3.6.3.4. Market size and forecast, by Route of Administration
          • 8.3.6.3.5. Market size and forecast, by Distribution Channel
        • 8.3.6.4. Italy
          • 8.3.6.4.1. Key market trends, growth factors and opportunities
          • 8.3.6.4.2. Market size and forecast, by Drug Type
          • 8.3.6.4.3. Market size and forecast, by Mechanism of Action
          • 8.3.6.4.4. Market size and forecast, by Route of Administration
          • 8.3.6.4.5. Market size and forecast, by Distribution Channel
        • 8.3.6.5. Spain
          • 8.3.6.5.1. Key market trends, growth factors and opportunities
          • 8.3.6.5.2. Market size and forecast, by Drug Type
          • 8.3.6.5.3. Market size and forecast, by Mechanism of Action
          • 8.3.6.5.4. Market size and forecast, by Route of Administration
          • 8.3.6.5.5. Market size and forecast, by Distribution Channel
        • 8.3.6.6. Rest of Europe
          • 8.3.6.6.1. Key market trends, growth factors and opportunities
          • 8.3.6.6.2. Market size and forecast, by Drug Type
          • 8.3.6.6.3. Market size and forecast, by Mechanism of Action
          • 8.3.6.6.4. Market size and forecast, by Route of Administration
          • 8.3.6.6.5. Market size and forecast, by Distribution Channel
    • 8.4. Asia-Pacific

      • 8.4.1. Key trends and opportunities

      • 8.4.2. Market size and forecast, by Drug Type

      • 8.4.3. Market size and forecast, by Mechanism of Action

      • 8.4.4. Market size and forecast, by Route of Administration

      • 8.4.5. Market size and forecast, by Distribution Channel

      • 8.4.6. Market size and forecast, by country

        • 8.4.6.1. Japan
          • 8.4.6.1.1. Key market trends, growth factors and opportunities
          • 8.4.6.1.2. Market size and forecast, by Drug Type
          • 8.4.6.1.3. Market size and forecast, by Mechanism of Action
          • 8.4.6.1.4. Market size and forecast, by Route of Administration
          • 8.4.6.1.5. Market size and forecast, by Distribution Channel
        • 8.4.6.2. China
          • 8.4.6.2.1. Key market trends, growth factors and opportunities
          • 8.4.6.2.2. Market size and forecast, by Drug Type
          • 8.4.6.2.3. Market size and forecast, by Mechanism of Action
          • 8.4.6.2.4. Market size and forecast, by Route of Administration
          • 8.4.6.2.5. Market size and forecast, by Distribution Channel
        • 8.4.6.3. Australia
          • 8.4.6.3.1. Key market trends, growth factors and opportunities
          • 8.4.6.3.2. Market size and forecast, by Drug Type
          • 8.4.6.3.3. Market size and forecast, by Mechanism of Action
          • 8.4.6.3.4. Market size and forecast, by Route of Administration
          • 8.4.6.3.5. Market size and forecast, by Distribution Channel
        • 8.4.6.4. India
          • 8.4.6.4.1. Key market trends, growth factors and opportunities
          • 8.4.6.4.2. Market size and forecast, by Drug Type
          • 8.4.6.4.3. Market size and forecast, by Mechanism of Action
          • 8.4.6.4.4. Market size and forecast, by Route of Administration
          • 8.4.6.4.5. Market size and forecast, by Distribution Channel
        • 8.4.6.5. South Korea
          • 8.4.6.5.1. Key market trends, growth factors and opportunities
          • 8.4.6.5.2. Market size and forecast, by Drug Type
          • 8.4.6.5.3. Market size and forecast, by Mechanism of Action
          • 8.4.6.5.4. Market size and forecast, by Route of Administration
          • 8.4.6.5.5. Market size and forecast, by Distribution Channel
        • 8.4.6.6. Rest of Asia-Pacific
          • 8.4.6.6.1. Key market trends, growth factors and opportunities
          • 8.4.6.6.2. Market size and forecast, by Drug Type
          • 8.4.6.6.3. Market size and forecast, by Mechanism of Action
          • 8.4.6.6.4. Market size and forecast, by Route of Administration
          • 8.4.6.6.5. Market size and forecast, by Distribution Channel
    • 8.5. LAMEA

      • 8.5.1. Key trends and opportunities

      • 8.5.2. Market size and forecast, by Drug Type

      • 8.5.3. Market size and forecast, by Mechanism of Action

      • 8.5.4. Market size and forecast, by Route of Administration

      • 8.5.5. Market size and forecast, by Distribution Channel

      • 8.5.6. Market size and forecast, by country

        • 8.5.6.1. Brazil
          • 8.5.6.1.1. Key market trends, growth factors and opportunities
          • 8.5.6.1.2. Market size and forecast, by Drug Type
          • 8.5.6.1.3. Market size and forecast, by Mechanism of Action
          • 8.5.6.1.4. Market size and forecast, by Route of Administration
          • 8.5.6.1.5. Market size and forecast, by Distribution Channel
        • 8.5.6.2. Saudi Arabia
          • 8.5.6.2.1. Key market trends, growth factors and opportunities
          • 8.5.6.2.2. Market size and forecast, by Drug Type
          • 8.5.6.2.3. Market size and forecast, by Mechanism of Action
          • 8.5.6.2.4. Market size and forecast, by Route of Administration
          • 8.5.6.2.5. Market size and forecast, by Distribution Channel
        • 8.5.6.3. South Africa
          • 8.5.6.3.1. Key market trends, growth factors and opportunities
          • 8.5.6.3.2. Market size and forecast, by Drug Type
          • 8.5.6.3.3. Market size and forecast, by Mechanism of Action
          • 8.5.6.3.4. Market size and forecast, by Route of Administration
          • 8.5.6.3.5. Market size and forecast, by Distribution Channel
        • 8.5.6.4. Rest of LAMEA
          • 8.5.6.4.1. Key market trends, growth factors and opportunities
          • 8.5.6.4.2. Market size and forecast, by Drug Type
          • 8.5.6.4.3. Market size and forecast, by Mechanism of Action
          • 8.5.6.4.4. Market size and forecast, by Route of Administration
          • 8.5.6.4.5. Market size and forecast, by Distribution Channel
  • CHAPTER 9: COMPETITIVE LANDSCAPE

    • 9.1. Introduction

    • 9.2. Top winning strategies

    • 9.3. Product Mapping of Top 10 Player

    • 9.4. Competitive Dashboard

    • 9.5. Competitive Heatmap

    • 9.6. Top player positioning, 2022

  • CHAPTER 10: COMPANY PROFILES

    • 10.1. Currax Pharmaceuticals LLC

      • 10.1.1. Company overview

      • 10.1.2. Key Executives

      • 10.1.3. Company snapshot

      • 10.1.4. Operating business segments

      • 10.1.5. Product portfolio

      • 10.1.6. Key strategic moves and developments

    • 10.2. KVK Tech Inc.

      • 10.2.1. Company overview

      • 10.2.2. Key Executives

      • 10.2.3. Company snapshot

      • 10.2.4. Operating business segments

      • 10.2.5. Product portfolio

    • 10.3. Gelesis Holdings, INC.

      • 10.3.1. Company overview

      • 10.3.2. Key Executives

      • 10.3.3. Company snapshot

      • 10.3.4. Operating business segments

      • 10.3.5. Product portfolio

      • 10.3.6. Business performance

      • 10.3.7. Key strategic moves and developments

    • 10.4. Vivus LLC.

      • 10.4.1. Company overview

      • 10.4.2. Key Executives

      • 10.4.3. Company snapshot

      • 10.4.4. Operating business segments

      • 10.4.5. Product portfolio

      • 10.4.6. Key strategic moves and developments

    • 10.5. CHEPLAPHARM Arzneimittel GmbH

      • 10.5.1. Company overview

      • 10.5.2. Key Executives

      • 10.5.3. Company snapshot

      • 10.5.4. Operating business segments

      • 10.5.5. Product portfolio

    • 10.6. Pfizer Inc.

      • 10.6.1. Company overview

      • 10.6.2. Key Executives

      • 10.6.3. Company snapshot

      • 10.6.4. Operating business segments

      • 10.6.5. Product portfolio

      • 10.6.6. Business performance

    • 10.7. Rhythm Pharmaceuticals

      • 10.7.1. Company overview

      • 10.7.2. Key Executives

      • 10.7.3. Company snapshot

      • 10.7.4. Operating business segments

      • 10.7.5. Product portfolio

      • 10.7.6. Business performance

      • 10.7.7. Key strategic moves and developments

    • 10.8. Novo Nordisk A/S

      • 10.8.1. Company overview

      • 10.8.2. Key Executives

      • 10.8.3. Company snapshot

      • 10.8.4. Operating business segments

      • 10.8.5. Product portfolio

      • 10.8.6. Business performance

      • 10.8.7. Key strategic moves and developments

    • 10.9. GlaxoSmithKline plc

      • 10.9.1. Company overview

      • 10.9.2. Key Executives

      • 10.9.3. Company snapshot

      • 10.9.4. Operating business segments

      • 10.9.5. Product portfolio

      • 10.9.6. Business performance

    • 10.10. Boehringer Ingelheim International GmbH

      • 10.10.1. Company overview

      • 10.10.2. Key Executives

      • 10.10.3. Company snapshot

      • 10.10.4. Operating business segments

      • 10.10.5. Product portfolio

      • 10.10.6. Business performance

      • 10.10.7. Key strategic moves and developments

  • LIST OF TABLES

  • TABLE 01. GLOBAL ANTI-OBESITY DRUGS MARKET, BY DRUG TYPE, 2022-2032 ($MILLION)
    TABLE 02. ANTI-OBESITY DRUGS MARKET FOR PRESCRIPTION DRUGS, BY REGION, 2022-2032 ($MILLION)
    TABLE 03. ANTI-OBESITY DRUGS MARKET FOR OVER THE COUNTER DRUGS, BY REGION, 2022-2032 ($MILLION)
    TABLE 04. GLOBAL ANTI-OBESITY DRUGS MARKET, BY MECHANISM OF ACTION, 2022-2032 ($MILLION)
    TABLE 05. ANTI-OBESITY DRUGS MARKET FOR CENTRALLY ACTING ANTI-OBESITY DRUGS, BY REGION, 2022-2032 ($MILLION)
    TABLE 06. ANTI-OBESITY DRUGS MARKET FOR PERIPHERALLY ACTING ANTI-OBESITY DRUGS, BY REGION, 2022-2032 ($MILLION)
    TABLE 07. GLOBAL ANTI-OBESITY DRUGS MARKET, BY ROUTE OF ADMINISTRATION, 2022-2032 ($MILLION)
    TABLE 08. ANTI-OBESITY DRUGS MARKET FOR ORAL ROUTE, BY REGION, 2022-2032 ($MILLION)
    TABLE 09. ANTI-OBESITY DRUGS MARKET FOR SUBCUTANEOUS ROUTE, BY REGION, 2022-2032 ($MILLION)
    TABLE 10. GLOBAL ANTI-OBESITY DRUGS MARKET, BY DISTRIBUTION CHANNEL, 2022-2032 ($MILLION)
    TABLE 11. ANTI-OBESITY DRUGS MARKET FOR HOSPITAL PHARMACIES, BY REGION, 2022-2032 ($MILLION)
    TABLE 12. ANTI-OBESITY DRUGS MARKET FOR RETAIL PHARMACIES, BY REGION, 2022-2032 ($MILLION)
    TABLE 13. ANTI-OBESITY DRUGS MARKET FOR ONLINE PHARMACIES, BY REGION, 2022-2032 ($MILLION)
    TABLE 14. ANTI-OBESITY DRUGS MARKET, BY REGION, 2022-2032 ($MILLION)
    TABLE 15. NORTH AMERICA ANTI-OBESITY DRUGS MARKET, BY DRUG TYPE, 2022-2032 ($MILLION)
    TABLE 16. NORTH AMERICA ANTI-OBESITY DRUGS MARKET, BY MECHANISM OF ACTION, 2022-2032 ($MILLION)
    TABLE 17. NORTH AMERICA ANTI-OBESITY DRUGS MARKET, BY ROUTE OF ADMINISTRATION, 2022-2032 ($MILLION)
    TABLE 18. NORTH AMERICA ANTI-OBESITY DRUGS MARKET, BY DISTRIBUTION CHANNEL, 2022-2032 ($MILLION)
    TABLE 19. NORTH AMERICA ANTI-OBESITY DRUGS MARKET, BY COUNTRY, 2022-2032 ($MILLION)
    TABLE 20. U.S. ANTI-OBESITY DRUGS MARKET, BY DRUG TYPE, 2022-2032 ($MILLION)
    TABLE 21. U.S. ANTI-OBESITY DRUGS MARKET, BY MECHANISM OF ACTION, 2022-2032 ($MILLION)
    TABLE 22. U.S. ANTI-OBESITY DRUGS MARKET, BY ROUTE OF ADMINISTRATION, 2022-2032 ($MILLION)
    TABLE 23. U.S. ANTI-OBESITY DRUGS MARKET, BY DISTRIBUTION CHANNEL, 2022-2032 ($MILLION)
    TABLE 24. CANADA ANTI-OBESITY DRUGS MARKET, BY DRUG TYPE, 2022-2032 ($MILLION)
    TABLE 25. CANADA ANTI-OBESITY DRUGS MARKET, BY MECHANISM OF ACTION, 2022-2032 ($MILLION)
    TABLE 26. CANADA ANTI-OBESITY DRUGS MARKET, BY ROUTE OF ADMINISTRATION, 2022-2032 ($MILLION)
    TABLE 27. CANADA ANTI-OBESITY DRUGS MARKET, BY DISTRIBUTION CHANNEL, 2022-2032 ($MILLION)
    TABLE 28. MEXICO ANTI-OBESITY DRUGS MARKET, BY DRUG TYPE, 2022-2032 ($MILLION)
    TABLE 29. MEXICO ANTI-OBESITY DRUGS MARKET, BY MECHANISM OF ACTION, 2022-2032 ($MILLION)
    TABLE 30. MEXICO ANTI-OBESITY DRUGS MARKET, BY ROUTE OF ADMINISTRATION, 2022-2032 ($MILLION)
    TABLE 31. MEXICO ANTI-OBESITY DRUGS MARKET, BY DISTRIBUTION CHANNEL, 2022-2032 ($MILLION)
    TABLE 32. EUROPE ANTI-OBESITY DRUGS MARKET, BY DRUG TYPE, 2022-2032 ($MILLION)
    TABLE 33. EUROPE ANTI-OBESITY DRUGS MARKET, BY MECHANISM OF ACTION, 2022-2032 ($MILLION)
    TABLE 34. EUROPE ANTI-OBESITY DRUGS MARKET, BY ROUTE OF ADMINISTRATION, 2022-2032 ($MILLION)
    TABLE 35. EUROPE ANTI-OBESITY DRUGS MARKET, BY DISTRIBUTION CHANNEL, 2022-2032 ($MILLION)
    TABLE 36. EUROPE ANTI-OBESITY DRUGS MARKET, BY COUNTRY, 2022-2032 ($MILLION)
    TABLE 37. GERMANY ANTI-OBESITY DRUGS MARKET, BY DRUG TYPE, 2022-2032 ($MILLION)
    TABLE 38. GERMANY ANTI-OBESITY DRUGS MARKET, BY MECHANISM OF ACTION, 2022-2032 ($MILLION)
    TABLE 39. GERMANY ANTI-OBESITY DRUGS MARKET, BY ROUTE OF ADMINISTRATION, 2022-2032 ($MILLION)
    TABLE 40. GERMANY ANTI-OBESITY DRUGS MARKET, BY DISTRIBUTION CHANNEL, 2022-2032 ($MILLION)
    TABLE 41. FRANCE ANTI-OBESITY DRUGS MARKET, BY DRUG TYPE, 2022-2032 ($MILLION)
    TABLE 42. FRANCE ANTI-OBESITY DRUGS MARKET, BY MECHANISM OF ACTION, 2022-2032 ($MILLION)
    TABLE 43. FRANCE ANTI-OBESITY DRUGS MARKET, BY ROUTE OF ADMINISTRATION, 2022-2032 ($MILLION)
    TABLE 44. FRANCE ANTI-OBESITY DRUGS MARKET, BY DISTRIBUTION CHANNEL, 2022-2032 ($MILLION)
    TABLE 45. UK ANTI-OBESITY DRUGS MARKET, BY DRUG TYPE, 2022-2032 ($MILLION)
    TABLE 46. UK ANTI-OBESITY DRUGS MARKET, BY MECHANISM OF ACTION, 2022-2032 ($MILLION)
    TABLE 47. UK ANTI-OBESITY DRUGS MARKET, BY ROUTE OF ADMINISTRATION, 2022-2032 ($MILLION)
    TABLE 48. UK ANTI-OBESITY DRUGS MARKET, BY DISTRIBUTION CHANNEL, 2022-2032 ($MILLION)
    TABLE 49. ITALY ANTI-OBESITY DRUGS MARKET, BY DRUG TYPE, 2022-2032 ($MILLION)
    TABLE 50. ITALY ANTI-OBESITY DRUGS MARKET, BY MECHANISM OF ACTION, 2022-2032 ($MILLION)
    TABLE 51. ITALY ANTI-OBESITY DRUGS MARKET, BY ROUTE OF ADMINISTRATION, 2022-2032 ($MILLION)
    TABLE 52. ITALY ANTI-OBESITY DRUGS MARKET, BY DISTRIBUTION CHANNEL, 2022-2032 ($MILLION)
    TABLE 53. SPAIN ANTI-OBESITY DRUGS MARKET, BY DRUG TYPE, 2022-2032 ($MILLION)
    TABLE 54. SPAIN ANTI-OBESITY DRUGS MARKET, BY MECHANISM OF ACTION, 2022-2032 ($MILLION)
    TABLE 55. SPAIN ANTI-OBESITY DRUGS MARKET, BY ROUTE OF ADMINISTRATION, 2022-2032 ($MILLION)
    TABLE 56. SPAIN ANTI-OBESITY DRUGS MARKET, BY DISTRIBUTION CHANNEL, 2022-2032 ($MILLION)
    TABLE 57. REST OF EUROPE ANTI-OBESITY DRUGS MARKET, BY DRUG TYPE, 2022-2032 ($MILLION)
    TABLE 58. REST OF EUROPE ANTI-OBESITY DRUGS MARKET, BY MECHANISM OF ACTION, 2022-2032 ($MILLION)
    TABLE 59. REST OF EUROPE ANTI-OBESITY DRUGS MARKET, BY ROUTE OF ADMINISTRATION, 2022-2032 ($MILLION)
    TABLE 60. REST OF EUROPE ANTI-OBESITY DRUGS MARKET, BY DISTRIBUTION CHANNEL, 2022-2032 ($MILLION)
    TABLE 61. ASIA-PACIFIC ANTI-OBESITY DRUGS MARKET, BY DRUG TYPE, 2022-2032 ($MILLION)
    TABLE 62. ASIA-PACIFIC ANTI-OBESITY DRUGS MARKET, BY MECHANISM OF ACTION, 2022-2032 ($MILLION)
    TABLE 63. ASIA-PACIFIC ANTI-OBESITY DRUGS MARKET, BY ROUTE OF ADMINISTRATION, 2022-2032 ($MILLION)
    TABLE 64. ASIA-PACIFIC ANTI-OBESITY DRUGS MARKET, BY DISTRIBUTION CHANNEL, 2022-2032 ($MILLION)
    TABLE 65. ASIA-PACIFIC ANTI-OBESITY DRUGS MARKET, BY COUNTRY, 2022-2032 ($MILLION)
    TABLE 66. JAPAN ANTI-OBESITY DRUGS MARKET, BY DRUG TYPE, 2022-2032 ($MILLION)
    TABLE 67. JAPAN ANTI-OBESITY DRUGS MARKET, BY MECHANISM OF ACTION, 2022-2032 ($MILLION)
    TABLE 68. JAPAN ANTI-OBESITY DRUGS MARKET, BY ROUTE OF ADMINISTRATION, 2022-2032 ($MILLION)
    TABLE 69. JAPAN ANTI-OBESITY DRUGS MARKET, BY DISTRIBUTION CHANNEL, 2022-2032 ($MILLION)
    TABLE 70. CHINA ANTI-OBESITY DRUGS MARKET, BY DRUG TYPE, 2022-2032 ($MILLION)
    TABLE 71. CHINA ANTI-OBESITY DRUGS MARKET, BY MECHANISM OF ACTION, 2022-2032 ($MILLION)
    TABLE 72. CHINA ANTI-OBESITY DRUGS MARKET, BY ROUTE OF ADMINISTRATION, 2022-2032 ($MILLION)
    TABLE 73. CHINA ANTI-OBESITY DRUGS MARKET, BY DISTRIBUTION CHANNEL, 2022-2032 ($MILLION)
    TABLE 74. AUSTRALIA ANTI-OBESITY DRUGS MARKET, BY DRUG TYPE, 2022-2032 ($MILLION)
    TABLE 75. AUSTRALIA ANTI-OBESITY DRUGS MARKET, BY MECHANISM OF ACTION, 2022-2032 ($MILLION)
    TABLE 76. AUSTRALIA ANTI-OBESITY DRUGS MARKET, BY ROUTE OF ADMINISTRATION, 2022-2032 ($MILLION)
    TABLE 77. AUSTRALIA ANTI-OBESITY DRUGS MARKET, BY DISTRIBUTION CHANNEL, 2022-2032 ($MILLION)
    TABLE 78. INDIA ANTI-OBESITY DRUGS MARKET, BY DRUG TYPE, 2022-2032 ($MILLION)
    TABLE 79. INDIA ANTI-OBESITY DRUGS MARKET, BY MECHANISM OF ACTION, 2022-2032 ($MILLION)
    TABLE 80. INDIA ANTI-OBESITY DRUGS MARKET, BY ROUTE OF ADMINISTRATION, 2022-2032 ($MILLION)
    TABLE 81. INDIA ANTI-OBESITY DRUGS MARKET, BY DISTRIBUTION CHANNEL, 2022-2032 ($MILLION)
    TABLE 82. SOUTH KOREA ANTI-OBESITY DRUGS MARKET, BY DRUG TYPE, 2022-2032 ($MILLION)
    TABLE 83. SOUTH KOREA ANTI-OBESITY DRUGS MARKET, BY MECHANISM OF ACTION, 2022-2032 ($MILLION)
    TABLE 84. SOUTH KOREA ANTI-OBESITY DRUGS MARKET, BY ROUTE OF ADMINISTRATION, 2022-2032 ($MILLION)
    TABLE 85. SOUTH KOREA ANTI-OBESITY DRUGS MARKET, BY DISTRIBUTION CHANNEL, 2022-2032 ($MILLION)
    TABLE 86. REST OF ASIA-PACIFIC ANTI-OBESITY DRUGS MARKET, BY DRUG TYPE, 2022-2032 ($MILLION)
    TABLE 87. REST OF ASIA-PACIFIC ANTI-OBESITY DRUGS MARKET, BY MECHANISM OF ACTION, 2022-2032 ($MILLION)
    TABLE 88. REST OF ASIA-PACIFIC ANTI-OBESITY DRUGS MARKET, BY ROUTE OF ADMINISTRATION, 2022-2032 ($MILLION)
    TABLE 89. REST OF ASIA-PACIFIC ANTI-OBESITY DRUGS MARKET, BY DISTRIBUTION CHANNEL, 2022-2032 ($MILLION)
    TABLE 90. LAMEA ANTI-OBESITY DRUGS MARKET, BY DRUG TYPE, 2022-2032 ($MILLION)
    TABLE 91. LAMEA ANTI-OBESITY DRUGS MARKET, BY MECHANISM OF ACTION, 2022-2032 ($MILLION)
    TABLE 92. LAMEA ANTI-OBESITY DRUGS MARKET, BY ROUTE OF ADMINISTRATION, 2022-2032 ($MILLION)
    TABLE 93. LAMEA ANTI-OBESITY DRUGS MARKET, BY DISTRIBUTION CHANNEL, 2022-2032 ($MILLION)
    TABLE 94. LAMEA ANTI-OBESITY DRUGS MARKET, BY COUNTRY, 2022-2032 ($MILLION)
    TABLE 95. BRAZIL ANTI-OBESITY DRUGS MARKET, BY DRUG TYPE, 2022-2032 ($MILLION)
    TABLE 96. BRAZIL ANTI-OBESITY DRUGS MARKET, BY MECHANISM OF ACTION, 2022-2032 ($MILLION)
    TABLE 97. BRAZIL ANTI-OBESITY DRUGS MARKET, BY ROUTE OF ADMINISTRATION, 2022-2032 ($MILLION)
    TABLE 98. BRAZIL ANTI-OBESITY DRUGS MARKET, BY DISTRIBUTION CHANNEL, 2022-2032 ($MILLION)
    TABLE 99. SAUDI ARABIA ANTI-OBESITY DRUGS MARKET, BY DRUG TYPE, 2022-2032 ($MILLION)
    TABLE 100. SAUDI ARABIA ANTI-OBESITY DRUGS MARKET, BY MECHANISM OF ACTION, 2022-2032 ($MILLION)
    TABLE 101. SAUDI ARABIA ANTI-OBESITY DRUGS MARKET, BY ROUTE OF ADMINISTRATION, 2022-2032 ($MILLION)
    TABLE 102. SAUDI ARABIA ANTI-OBESITY DRUGS MARKET, BY DISTRIBUTION CHANNEL, 2022-2032 ($MILLION)
    TABLE 103. SOUTH AFRICA ANTI-OBESITY DRUGS MARKET, BY DRUG TYPE, 2022-2032 ($MILLION)
    TABLE 104. SOUTH AFRICA ANTI-OBESITY DRUGS MARKET, BY MECHANISM OF ACTION, 2022-2032 ($MILLION)
    TABLE 105. SOUTH AFRICA ANTI-OBESITY DRUGS MARKET, BY ROUTE OF ADMINISTRATION, 2022-2032 ($MILLION)
    TABLE 106. SOUTH AFRICA ANTI-OBESITY DRUGS MARKET, BY DISTRIBUTION CHANNEL, 2022-2032 ($MILLION)
    TABLE 107. REST OF LAMEA ANTI-OBESITY DRUGS MARKET, BY DRUG TYPE, 2022-2032 ($MILLION)
    TABLE 108. REST OF LAMEA ANTI-OBESITY DRUGS MARKET, BY MECHANISM OF ACTION, 2022-2032 ($MILLION)
    TABLE 109. REST OF LAMEA ANTI-OBESITY DRUGS MARKET, BY ROUTE OF ADMINISTRATION, 2022-2032 ($MILLION)
    TABLE 110. REST OF LAMEA ANTI-OBESITY DRUGS MARKET, BY DISTRIBUTION CHANNEL, 2022-2032 ($MILLION)
    TABLE 111. CURRAX PHARMACEUTICALS LLC: KEY EXECUTIVES
    TABLE 112. CURRAX PHARMACEUTICALS LLC: COMPANY SNAPSHOT
    TABLE 113. CURRAX PHARMACEUTICALS LLC: PRODUCT SEGMENTS
    TABLE 114. CURRAX PHARMACEUTICALS LLC: PRODUCT PORTFOLIO
    TABLE 115. CURRAX PHARMACEUTICALS LLC: KEY STRATERGIES
    TABLE 116. KVK TECH INC.: KEY EXECUTIVES
    TABLE 117. KVK TECH INC.: COMPANY SNAPSHOT
    TABLE 118. KVK TECH INC.: PRODUCT SEGMENTS
    TABLE 119. KVK TECH INC.: SERVICE SEGMENTS
    TABLE 120. KVK TECH INC.: PRODUCT PORTFOLIO
    TABLE 121. GELESIS HOLDINGS, INC.: KEY EXECUTIVES
    TABLE 122. GELESIS HOLDINGS, INC.: COMPANY SNAPSHOT
    TABLE 123. GELESIS HOLDINGS, INC.: SERVICE SEGMENTS
    TABLE 124. GELESIS HOLDINGS, INC.: PRODUCT PORTFOLIO
    TABLE 125. GELESIS HOLDINGS, INC.: KEY STRATERGIES
    TABLE 126. VIVUS LLC.: KEY EXECUTIVES
    TABLE 127. VIVUS LLC.: COMPANY SNAPSHOT
    TABLE 128. VIVUS LLC.: PRODUCT SEGMENTS
    TABLE 129. VIVUS LLC.: SERVICE SEGMENTS
    TABLE 130. VIVUS LLC.: PRODUCT PORTFOLIO
    TABLE 131. VIVUS LLC.: KEY STRATERGIES
    TABLE 132. CHEPLAPHARM ARZNEIMITTEL GMBH: KEY EXECUTIVES
    TABLE 133. CHEPLAPHARM ARZNEIMITTEL GMBH: COMPANY SNAPSHOT
    TABLE 134. CHEPLAPHARM ARZNEIMITTEL GMBH: SERVICE SEGMENTS
    TABLE 135. CHEPLAPHARM ARZNEIMITTEL GMBH: PRODUCT PORTFOLIO
    TABLE 136. PFIZER INC.: KEY EXECUTIVES
    TABLE 137. PFIZER INC.: COMPANY SNAPSHOT
    TABLE 138. PFIZER INC.: PRODUCT SEGMENTS
    TABLE 139. PFIZER INC.: PRODUCT PORTFOLIO
    TABLE 140. RHYTHM PHARMACEUTICALS: KEY EXECUTIVES
    TABLE 141. RHYTHM PHARMACEUTICALS: COMPANY SNAPSHOT
    TABLE 142. RHYTHM PHARMACEUTICALS: SERVICE SEGMENTS
    TABLE 143. RHYTHM PHARMACEUTICALS: PRODUCT PORTFOLIO
    TABLE 144. RHYTHM PHARMACEUTICALS: KEY STRATERGIES
    TABLE 145. NOVO NORDISK A/S: KEY EXECUTIVES
    TABLE 146. NOVO NORDISK A/S: COMPANY SNAPSHOT
    TABLE 147. NOVO NORDISK A/S: PRODUCT SEGMENTS
    TABLE 148. NOVO NORDISK A/S: PRODUCT PORTFOLIO
    TABLE 149. NOVO NORDISK A/S: KEY STRATERGIES
    TABLE 150. GLAXOSMITHKLINE PLC: KEY EXECUTIVES
    TABLE 151. GLAXOSMITHKLINE PLC: COMPANY SNAPSHOT
    TABLE 152. GLAXOSMITHKLINE PLC: PRODUCT SEGMENTS
    TABLE 153. GLAXOSMITHKLINE PLC: PRODUCT PORTFOLIO
    TABLE 154. BOEHRINGER INGELHEIM INTERNATIONAL GMBH: KEY EXECUTIVES
    TABLE 155. BOEHRINGER INGELHEIM INTERNATIONAL GMBH: COMPANY SNAPSHOT
    TABLE 156. BOEHRINGER INGELHEIM INTERNATIONAL GMBH: PRODUCT SEGMENTS
    TABLE 157. BOEHRINGER INGELHEIM INTERNATIONAL GMBH: PRODUCT PORTFOLIO
    TABLE 158. BOEHRINGER INGELHEIM INTERNATIONAL GMBH: KEY STRATERGIES
  • LIST OF FIGURES

  • FIGURE 01. ANTI-OBESITY DRUGS MARKET, 2022-2032
    FIGURE 02. SEGMENTATION OF ANTI-OBESITY DRUGS MARKET, 2022-2032
    FIGURE 03. TOP INVESTMENT POCKETS IN ANTI-OBESITY DRUGS MARKET (2023-2032)
    FIGURE 04. LOW BARGAINING POWER OF SUPPLIERS
    FIGURE 05. LOW BARGAINING POWER OF BUYERS
    FIGURE 06. LOW THREAT OF SUBSTITUTES
    FIGURE 07. LOW THREAT OF NEW ENTRANTS
    FIGURE 08. LOW INTENSITY OF RIVALRY
    FIGURE 09. DRIVERS, RESTRAINTS AND OPPORTUNITIES: ANTI-OBESITY DRUGS MARKET
    FIGURE 10. ANTI-OBESITY DRUGS MARKET, BY DRUG TYPE, 2022(%)
    FIGURE 11. COMPARATIVE SHARE ANALYSIS OF ANTI-OBESITY DRUGS MARKET FOR PRESCRIPTION DRUGS, BY COUNTRY 2022-2032(%)
    FIGURE 12. COMPARATIVE SHARE ANALYSIS OF ANTI-OBESITY DRUGS MARKET FOR OVER THE COUNTER DRUGS, BY COUNTRY 2022-2032(%)
    FIGURE 13. ANTI-OBESITY DRUGS MARKET, BY MECHANISM OF ACTION, 2022(%)
    FIGURE 14. COMPARATIVE SHARE ANALYSIS OF ANTI-OBESITY DRUGS MARKET FOR CENTRALLY ACTING ANTI-OBESITY DRUGS, BY COUNTRY 2022-2032(%)
    FIGURE 15. COMPARATIVE SHARE ANALYSIS OF ANTI-OBESITY DRUGS MARKET FOR PERIPHERALLY ACTING ANTI-OBESITY DRUGS, BY COUNTRY 2022-2032(%)
    FIGURE 16. ANTI-OBESITY DRUGS MARKET, BY ROUTE OF ADMINISTRATION, 2022(%)
    FIGURE 17. COMPARATIVE SHARE ANALYSIS OF ANTI-OBESITY DRUGS MARKET FOR ORAL ROUTE, BY COUNTRY 2022-2032(%)
    FIGURE 18. COMPARATIVE SHARE ANALYSIS OF ANTI-OBESITY DRUGS MARKET FOR SUBCUTANEOUS ROUTE, BY COUNTRY 2022-2032(%)
    FIGURE 19. ANTI-OBESITY DRUGS MARKET, BY DISTRIBUTION CHANNEL, 2022(%)
    FIGURE 20. COMPARATIVE SHARE ANALYSIS OF ANTI-OBESITY DRUGS MARKET FOR HOSPITAL PHARMACIES, BY COUNTRY 2022-2032(%)
    FIGURE 21. COMPARATIVE SHARE ANALYSIS OF ANTI-OBESITY DRUGS MARKET FOR RETAIL PHARMACIES, BY COUNTRY 2022-2032(%)
    FIGURE 22. COMPARATIVE SHARE ANALYSIS OF ANTI-OBESITY DRUGS MARKET FOR ONLINE PHARMACIES, BY COUNTRY 2022-2032(%)
    FIGURE 23. ANTI-OBESITY DRUGS MARKET BY REGION, 2022
    FIGURE 24. U.S. ANTI-OBESITY DRUGS MARKET, 2022-2032 ($MILLION)
    FIGURE 25. CANADA ANTI-OBESITY DRUGS MARKET, 2022-2032 ($MILLION)
    FIGURE 26. MEXICO ANTI-OBESITY DRUGS MARKET, 2022-2032 ($MILLION)
    FIGURE 27. GERMANY ANTI-OBESITY DRUGS MARKET, 2022-2032 ($MILLION)
    FIGURE 28. FRANCE ANTI-OBESITY DRUGS MARKET, 2022-2032 ($MILLION)
    FIGURE 29. UK ANTI-OBESITY DRUGS MARKET, 2022-2032 ($MILLION)
    FIGURE 30. ITALY ANTI-OBESITY DRUGS MARKET, 2022-2032 ($MILLION)
    FIGURE 31. SPAIN ANTI-OBESITY DRUGS MARKET, 2022-2032 ($MILLION)
    FIGURE 32. REST OF EUROPE ANTI-OBESITY DRUGS MARKET, 2022-2032 ($MILLION)
    FIGURE 33. JAPAN ANTI-OBESITY DRUGS MARKET, 2022-2032 ($MILLION)
    FIGURE 34. CHINA ANTI-OBESITY DRUGS MARKET, 2022-2032 ($MILLION)
    FIGURE 35. AUSTRALIA ANTI-OBESITY DRUGS MARKET, 2022-2032 ($MILLION)
    FIGURE 36. INDIA ANTI-OBESITY DRUGS MARKET, 2022-2032 ($MILLION)
    FIGURE 37. SOUTH KOREA ANTI-OBESITY DRUGS MARKET, 2022-2032 ($MILLION)
    FIGURE 38. REST OF ASIA-PACIFIC ANTI-OBESITY DRUGS MARKET, 2022-2032 ($MILLION)
    FIGURE 39. BRAZIL ANTI-OBESITY DRUGS MARKET, 2022-2032 ($MILLION)
    FIGURE 40. SAUDI ARABIA ANTI-OBESITY DRUGS MARKET, 2022-2032 ($MILLION)
    FIGURE 41. SOUTH AFRICA ANTI-OBESITY DRUGS MARKET, 2022-2032 ($MILLION)
    FIGURE 42. REST OF LAMEA ANTI-OBESITY DRUGS MARKET, 2022-2032 ($MILLION)
    FIGURE 43. TOP WINNING STRATEGIES, BY YEAR
    FIGURE 44. TOP WINNING STRATEGIES, BY DEVELOPMENT
    FIGURE 45. TOP WINNING STRATEGIES, BY COMPANY
    FIGURE 46. PRODUCT MAPPING OF TOP 10 PLAYERS
    FIGURE 47. COMPETITIVE DASHBOARD
    FIGURE 48. COMPETITIVE HEATMAP: ANTI-OBESITY DRUGS MARKET
    FIGURE 49. TOP PLAYER POSITIONING, 2022
    FIGURE 50. GELESIS HOLDINGS, INC.: NET REVENUE, 2020-2021 ($MILLION)
    FIGURE 51. PFIZER INC.: NET REVENUE, 2020-2022 ($MILLION)
    FIGURE 52. PFIZER INC.: REVENUE SHARE BY SEGMENT, 2022 (%)
    FIGURE 53. PFIZER INC.: REVENUE SHARE BY REGION, 2022 (%)
    FIGURE 54. RHYTHM PHARMACEUTICALS: NET REVENUE, 2021-2022 ($MILLION)
    FIGURE 55. NOVO NORDISK A/S: NET SALES, 2020-2022 ($MILLION)
    FIGURE 56. NOVO NORDISK A/S: REVENUE SHARE BY SEGMENT, 2022 (%)
    FIGURE 57. NOVO NORDISK A/S: REVENUE SHARE BY REGION, 2022 (%)
    FIGURE 58. GLAXOSMITHKLINE PLC: NET SALES, 2020-2022 ($MILLION)
    FIGURE 59. GLAXOSMITHKLINE PLC: REVENUE SHARE BY SEGMENT, 2022 (%)
    FIGURE 60. GLAXOSMITHKLINE PLC: REVENUE SHARE BY REGION, 2022 (%)
    FIGURE 61. BOEHRINGER INGELHEIM INTERNATIONAL GMBH: NET SALES, 2019-2021 ($MILLION)
    FIGURE 62. BOEHRINGER INGELHEIM INTERNATIONAL GMBH: REVENUE SHARE BY SEGMENT, 2021 (%)
    FIGURE 63. BOEHRINGER INGELHEIM INTERNATIONAL GMBH: REVENUE SHARE BY REGION, 2021 (%)


PURCHASE OPTIONS

Call or Email us

U.S.-Canada Toll-free: +1-800-792-5285
Int'l : +1-503-894-6022
Europe : +44-845-528-1300
Email : help@alliedmarketresearch.com
 
FREQUENTLY ASKED QUESTIONS?

A. Anti-obesity drugs are prescribed medications that aid in weight loss in obese or overweight people. These medicines reduce appetite, speed up metabolism, or prevent the body from absorbing fat from food. Anti-obesity drugs can be classified into three main categories according to their mode of action. These include drugs inhibiting intestinal fat absorption, drugs suppressing food intake and drugs increasing energy consumption.

A. The total market value of the anti-obesity drugs market is $1605.36 million in 2022.

A. The forecast period for anti-obesity drugs market is 2023 to 2032.

A. The factors that restrain the growth of the market are potential side effects of anti-obesity drugs.

A. Increase in the prevalence of obesity, increase in number of clinical trials and increase in number of drugs in pipeline.

A. Yes, the competitive landscape is included in the anti-obesity drugs market report.

A. The overall impact of COVID-19 remains negative on the anti-obesity drugs market.

A. Top companies such as Currax Pharmaceuticals LLC, Pfizer Inc, Novo Nordisk A/S, GlaxoSmithKline plc, CHEPLAPHARM Arzneimittel GmbH, Gelesis Holdings, INC., Rhythm Pharmaceuticals held a high market position in 2022.

Looking for Customization?

 Customization Request

Have a Question?

 Speak with Analyst

Any Confusion?

 Inquire Before Buying

Have a glance of the Report

  Request Sample
RELATED TAGS

Purchase Full Report of
Anti-obesity Drugs Market

Start reading instantly.
This Report and over 67,404+ more Reports, Available with Avenue Library. T&C*.

  • Online Only
  • $3,690
  • Online cloud access only
  • Restricted print, copy, paste & download
  • Read only
  • Free industry update
    (Within 180 days)
  • Free report update in next update cycle
    (Apr 2024 - Apr 2025)
  • Data Pack
  • $3,930
  • Restricted to one authorized user
  • One print only
  • Available in
    Excel
  • Free industry update
    (Within 180 days)
  •   Free report update in next update cycle
    (Apr 2024 - Apr 2025)
  • Single User
  • $5,820
  • Restricted to one authorized user
  • One print only
  • Available in
    PDF
  • Free industry update
    (Within 180 days)
  •   Free report update in next update cycle
    (Apr 2024 - Apr 2025)
  • Five Users
  • $6,540
  • Limited to five authorized users
  • Print upto five copies
  • Available in
    PDF
  • Free industry update
    (Within 180 days)
  •   Free report update in next update cycle
    (Apr 2024 - Apr 2025)
  • Enterprise
    License/PDF

  • $9,870
  • Unlimited
    within
    company/enterprise
  • Available in Excel & PDF
  • Free industry update
    (Within 180 days)
  •   Free report update in next update cycle
    (Apr 2024 - Apr 2025)
  • Library
    Membership

  • $999 $ 1,175
    Per User/ Per month/ Billed annually
  • Published Content
    E-access
  • Company Profiles
    E-access
  • Newly Added Content Access
  • 10 PDF
    Downloads
  • 5 Excel Data
    Pack Downloads
  • 250 Company Profiles PDF Downloads
  • Buy Now

*Taxes/Fees, if applicable will be added during checkout. All prices in USD

RELATED REPORTS
 

Why Allied Market Research?


Infallible Methodology

To ensure high-level data integrity, accurate analysis, and impeccable forecasts

Analyst Support

For complete satisfaction

Customization

On-demand customization of scope of the report to exactly meet your needs

TARGETED MARKET VIEW

Targeted market view to provide pertinent information and save time of readers

Get fresh content delivered

Get insights on topics that are crucial for your business. Stay abreast of your interest areas.

Get Industry Data Alerts

Why Allied Market Research?

Infallible Methodology

To ensure high-level data integrity, accurate analysis, and impeccable forecasts

Analyst Support

For complete satisfaction

Customization

On-demand customization of scope of the report to exactly meet your needs

TARGETED MARKET VIEW

Targeted market view to provide pertinent information and save time of readers