Report Code: A01016 | Jun 2015 | Pages: 100 | ||
Tables: 30 | Charts: 29 |
|
Pandemic disrupted the entire world and affected many industries.
Get detailed COVID-19 impact analysis on the Asia-pacific Beer Market
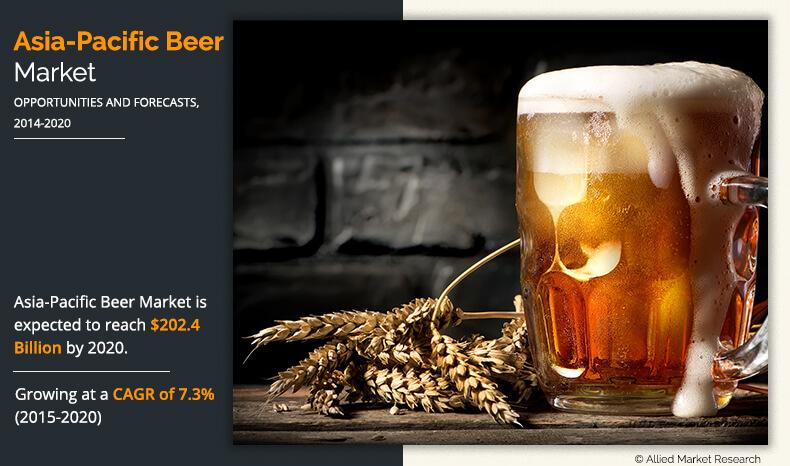
Request Now !Asia-Pacific Beer Market is expected to garner $202.4 billion by 2020, registering a CAGR of 7.3% during the forecast period 2015–2020. Beer is one of the most popular alcoholic drinks consumed in the Asia-Pacific region. It is one of the oldest beverages in the world prepared by the fermentation of grains. The brewing process of beer requires basic ingredients, such as malted cereal grains, hops, water, and yeast, which are fermented over a long period.
A wide range of beers is available in the market with, each one having its own characteristic tastes and flavors. These include lagers, stouts and porters, ales, and seasonal specialties. The market has witnessed a significant growth due to increase in demand from countries, such as India and China. A considerable increase in the consumption of beer has been observed in India due to its growing youth population with preference for beer. Changing lifestyles and consumer preferences have considerably boosted the adoption of beer in the Asia-Pacific region. Furthermore, a significant rise in the number of working class individuals and increase in disposable incomes of the people in this region have favored the adoption of premium and high quality beers. However, heavy taxation, increasing health consciousness and availability of substitute drinks are the key factors hindering the growth of the market. Different type of beers including premium, mainstream and economy would contribute to the growth of the beer industry worldwide.
The prominent players have adopted various strategies in the Asia-Pacific beer market in order to acquire bigger market share. The key development strategies include product launches, partnerships and collaborations. For instance, Asahi Group entered into a partnership with Asia Brewery Inc. (ABC), a Philippine-based company, to distribute Asahis super dry and premium category beer in the Philippine region. The company launched the Asahi beer to target the regions premium beer segment growth.
China Resources Enterprise Ltd (CRE), a major provider of beverages has taken a decision to focus on the brewing segment, especially the Snow beer, which is the largest selling beer in the Chinese market. SABMiller India launched a stronger version of Miller High Life in India, with the brand name Miller Ace. The new variant, Miller Ace, comes with a stronger taste and a higher alcohol content. With the launch of this product, the company aims to cater to the growing demand of quality premium beer in India. The key players dominating this market include Tsingtao Brewery, Anheuser-Busch InBev, Heineken N.V., Beijing Yanjing Brewery, SABMiller Plc, Kirin Holdings Co Ltd, Carlsberg Group, United Breweries Group (UB Group), China resources Enterprise and Asahi Breweries Ltd.
The industry is segmented based on type, packaging, production, category of beers according to pricing and countries. On the basis of types, the industry is segmented into strong and light beers. From the packaging perspective, the market is segmented into canned beer, bottled beer and draught beer. From the perspective of price, the market is categorized into premium, super premium, and normal beer. The production segment of beer is categorized into macro breweries and microbreweries. The Asian brewery products and Asian beer brands are gaining popularity along with the growth of the beer industry in this region. The microbrewery segment comprises a range of craft beer brands. Established companies, viz. Tsingtao, Kirin Holdings, Heineken and Carlsberg serve the macro brewery segment. This report provides an in-depth analysis of the beer market across China, Japan, India, Australia, and the rest of Asia-Pacific region.
Asia-Pacific Beer Market Report Highlights
Aspects | Details |
---|---|
By Type |
|
By Production |
|
By Category |
|
By Packaging |
|
By Country |
|
Key Market Players | Asahi Breweries, Ltd., Beijing Yanjing Brewery, Anheuser-Busch InBev, Carlsberg Group, Heineken N.V., China Resources Enterprise, Limited, Kirin Holding Company, Limited., Tsingtao Brewery, United Breweries Group (UB Group), SABMiller Plc |
CHAPTER 1 INTRODUCTION
1.1 Report Description
1.2 Key Take Away
1.3 Market Segmentation
1.4 Research Methodology
1.4.1 Secondary Research
1.4.2 Primary Research
1.4.3 Analyst Tools and Models
CHAPTER 2 MARKET OVERVIEW
2.1 Executive Summary
2.2 CXO Perspective
2.3 Market Definition and Scope
2.4 Key Findings
2.4.1 Top Impacting Factors
2.4.2 Top Investment Pockets
2.4.3 Top Winning Strategies
2.5 Porters Five Forces Analysis
2.5.1 High Bargaining Power of Consumers
2.5.2 High Bargaining Power of Suppliers
2.5.3 High Threat of Substitute
2.5.4 Low Threat of New Entrants
2.5.5 High Industry Rivalry
2.6 Value Chain Analysis
2.7 Market Share Analysis, 2014
2.8 Market Dynamics
2.8.1 Drivers
2.8.1.1 Increasing Disposable Income
2.8.1.2 Transition in Lifestyle
2.8.1.3 Rising Craft Beer Market
2.8.1.4 Growing Beer Consuming Population Base
2.8.2 Restraints
2.8.2.1 Heavy Taxation and Legal Regulations
2.8.2.2 Rising Health Consciousness
2.8.2.3 Availability of Substitutes
2.8.3 Opportunities
2.8.3.1 Growing Demand for Imported Beer
CHAPTER 3 PRODUCT TYPE
3.1 Light Beer
3.1.1 Key Market Trends
3.1.2 Competitive Scenario
3.1.3 Key Growth Factors and Opportunities
3.1.4 Market Size and Forecast
3.2 Strong Beer
3.2.1 Key Market Trends
3.2.2 Competitive Scenario
3.2.3 Key Growth Factors and Opportunities
3.2.4 Market Size and Forecast
CHAPTER 4 BY PRODUCTION
4.1 Macro Brewery
4.1.1 Key Market Trends
4.1.2 Competitive Scenario
4.1.3 Key Growth Factors and Opportunities
4.1.4 Market Size and Forecast
4.2 Micro-Brewery
4.2.1 Key Market Trends
4.2.2 Competitive Scenario
4.2.3 Key Growth Factors and Opportunities
4.2.4 Market Size and Forecast
CHAPTER 5 BY CATEGORY
5.1 Premium Category
5.1.1 Key Market Trends
5.1.1 Competitive Scenario
5.1.2 Key Growth Factors and Opportunities
5.1.3 Market Size and Forecast
5.2 Super Premium Category
5.2.1 Key Market Trends
5.2.2 Competitive Scenario
5.2.3 Key Growth Factors and Opportunities
5.2.4 Market Size and Forecast
5.3 Normal Category
5.3.1 Key Market Trends
5.3.2 Competitive Scenario
5.3.3 Key Growth Factors and Opportunities
5.3.4 Market Size and Forecast
CHAPTER 6 BY PACKAGING
6.1 Canned Beer
6.1.1 Key Market Trends
6.1.2 Competitive Scenario
6.1.3 Key Growth Factors and Opportunities
6.1.4 Market Size and Forecast
6.2 Bottled Beer
6.2.1 Key Market Trends
6.2.2 Competitive Scenario
6.2.3 Key Growth Factors and Opportunities
6.2.4 Market Size and Forecast
6.3 Draught Beer
6.3.1 Key Market Trends
6.3.2 Competitive Scenario
6.3.3 Key Growth Factors and Opportunities
6.3.4 Market Size and Forecast
CHAPTER 7 BY COUNTRY
7.1 China
7.1.1 Key Market Trends
7.1.2 Competitive Scenario
7.1.3 Key Growth Factors and Opportunities
7.1.4 Market Size and Forecast
7.2 Japan
7.2.1 Key Market Trends
7.2.2 Competitive Scenario
7.2.3 Key Growth Factors and Opportunities
7.2.4 Market Size and Forecast
7.3 India
7.3.1 Key Market Trends
7.3.2 Competitive Scenario
7.3.3 Key Growth Factors and Opportunities
7.3.4 Market Size and Forecast
7.4 Australia
7.4.1 Key Market Trends
7.4.2 Competitive Scenario
7.4.3 Key Growth Factors and Opportunities
7.4.4 Market Size and Forecast
7.5 Rest of Asia-Pacific
7.5.1 Key Market Trends
7.5.2 Competitive Scenario
7.5.3 Key Growth Factors and Opportunities
7.5.4 Market Size and Forecast
CHAPTER 8 COMPANY PROFILE
8.1 Heineken N.V.
8.1.1 Company Overview
8.1.2 Company Snapshot
8.1.3 Business Performance
8.1.4 Key Strategies and Developments
8.1.5 SWOT Analysis and Strategic Conclusion of Heineken N.V.
8.2 Anheuser-Busch InBev
8.2.1 Company Overview
8.2.2 Company Snapshot
8.2.3 Business Performance
8.2.4 Key Strategies and Developments
8.2.5 SWOT Analysis and Strategic Conclusion of Anheuser-Busch InBev
8.3 SABMiller Plc
8.3.1 Company Overview
8.3.2 Company Snapshot
8.3.3 Business Performance
8.3.4 Key Strategies and Developments
8.3.5 SWOT Analysis and Strategic Conclusion of SABMiller Plc
8.4 Tsingtao Brewery
8.4.1 Company Overview
8.4.2 Company Snapshot
8.4.3 Business Performance
8.4.4 Key Strategies and Developments
8.4.5 SWOT Analysis and Strategic Conclusion of Tsingtao Brewery
8.5 Carlsberg Group
8.5.1 Company Overview
8.5.2 Company Snapshot
8.5.3 Business Performance
8.5.4 Key Strategies and Developments
8.5.5 SWOT Analysis and Strategic Conclusion of Carlsberg Group
8.6 Kirin Holding Company, Limited.
8.6.1 Company Overview
8.6.2 Company Snapshot
8.6.3 Business Performance
8.6.4 Key Strategies and Developments
8.6.5 SWOT Analysis and Strategic Conclusion of Kirin Holding Company, Limited
8.7 Asahi Breweries, Ltd.
8.7.1 Company Overview
8.7.2 Company Snapshot
8.7.3 Business Performance
8.7.4 Key Strategies and Developments
8.7.5 SWOT Analysis and Strategic Conclusion of Asahi Breweries, Ltd.
8.8 China Resources Enterprise, Limited
8.8.1 Company Overview
8.8.2 Company Snapshot
8.8.3 Business Performance
8.8.4 Key Strategies and Developments
8.8.5 SWOT Analysis and Strategic Conclusion of China Resources Enterprise, Limited
8.9 Beijing Yanjing Brewery
8.9.1 Company Overview
8.9.2 Company Snapshot
8.9.3 Business Performance
8.9.4 Key Strategies and Developments
8.9.5 SWOT Analysis and Strategic Conclusion of Beijing Yanjing Brewery
8.10 United Breweries Group (UB Group)
8.10.1 Company Overview
8.10.2 Company Snapshot
8.10.3 Business Performance
8.10.4 Key Strategies and Developments
8.10.5 SWOT Analysis and Strategic Conclusion of UB Group
LIST OF TABLES
TABLE 1 APAC Beer Market Revenue by Country, 2014 - 2020 ($Billion)
TABLE 2 APAC Beer Market Revenue by Product Type, 2014 - 2020 ($Billion)
TABLE 3 APAC Light Beer Market Revenue by Country, 2014 - 2020 ($Billion)
TABLE 4 APAC Strong Beer Market Revenue by Country, 2014 - 2020 ($Billion)
TABLE 5 APAC Beer Market Revenue by Production, 2014 - 2020 ($Billion)
TABLE 6 APAC Macro Brewery Market Revenue by Country, 2014 - 2020 ($Billion)
TABLE 7 APAC Microbrewery Market Revenue by Country, 2014 - 2020 ($Billion)
TABLE 8 APAC Beer Market Revenue by Category, 2014 - 2020 ($Billion)
TABLE 9 APAC Premium Category Market Revenue by Country, 2014 - 2020 ($Billion)
TABLE 10 APAC Super Premium Category Market Revenue by Country, 2014 - 2020 ($Billion)
TABLE 11 APAC Normal Category Market Revenue by Country, 2014 - 2020 ($Billion)
TABLE 12 APAC Beer Market Revenue by Packaging, 2014 - 2020 ($Billion)
TABLE 13 APAC Canned Beer Market Revenue by Country, 2014 - 2020 ($Billion)
TABLE 14 APAC Bottled Beer Market Revenue by Country, 2014 - 2020 ($Billion)
TABLE 15 APAC Draught Beer Market Revenue by Country, 2014 - 2020 ($Billion)
TABLE 16 China Beer Market Revenue, 2014 - 2020 ($Billion)
TABLE 17 India Beer Market Revenue, 2014 - 2020 ($Billion)
TABLE 18 Japan Beer Market Revenue, 2014 - 2020 ($Billion)
TABLE 19 Australia Beer Market Revenue, 2014 - 2020 ($Billion)
TABLE 20 Rest of Asia-Pacific Beer Market Revenue, 2014 - 2020 ($Billion)
TABLE 21 Snapshot Of Heineken N.V.
TABLE 22 Snapshot of Anheuser- Busch InBev
TABLE 23 Snapshot of SABMiller
TABLE 24 Snapshot of Tsingtao Brewery
TABLE 25 Snapshot of Carlsberg Group
TABLE 26 Snapshot of Kirin Holdings Company, Limited
TABLE 27 Snapshot of Asahi Breweries, Ltd
TABLE 28 Snapshot of China Resource Enterprise, Limited
TABLE 29 Snapshot of Beijing Yanjing Brewery
TABLE 30 Snapshot of UB Group
LIST OF FIGURES
Fig. 1 Top Impacting Factors
Fig. 2 Top Investment Pockets
Fig. 3 Top Winning Strategies in APAC Beer Market
Fig. 4 APAC Beer Market Value Chain
Fig. 5 Market Share Analysis, 2014
Fig. 6 Porters Five Forces Model
Fig. 7 Revenue Generated by Heineken N.V., ($ Million, 2012 - 2014)
Fig. 8 SWOT Analysis of Heineken N.V.
Fig. 9 Revenue Generated by Anheuser-Busch InBev, ($ Million, 2012 - 2014)
Fig. 10 Revenue of Anheuser-Busch InBev in Percentage by Operating Segments, (2014)
Fig. 11 SWOT Analysis of Anheuser-Busch InBev
Fig. 12 Revenue Generated by SABMiller Plc, ($ Million, 2012 - 2014)
Fig. 13 Revenue of SABMiller Plc in Percentage by Geography, 2014
Fig. 14 SWOT Analysis of SABMiller Plc
Fig. 15 Revenue Generated by Tsingtao Brewery, ($ Million, 2012 - 2014)
Fig. 16 SWOT Analysis of Tsingtao Brewery
Fig. 17 Revenue Generated by Carlsberg Group, ($ Million, 2012 - 2014)
Fig. 18 SWOT Analysis of Carlsberg Group
Fig. 19 Revenue Generated by Kirin Holdings Company, Limited, ($ Million, 2012 - 2014)
Fig. 20 Revenue of Kirin Holdings Company, Limited, in Percentage by Operating Segments, 2014
Fig. 21 SWOT Analysis of Kirin Holdings Company, Limited
Fig. 22 Revenue Generated by Asahi Breweries, Ltd, ($ Million, 2012 - 2014)
Fig. 23 SWOT Analysis of Asahi Breweries, Ltd
Fig. 24 Revenue Generated by China Resources Limited, ($ Million, 2012 - 2014)
Fig. 25 Revenue of China Resources Limited in Percentage by Geography, 2014
Fig. 26 SWOT Analysis of China Resource Enterprise, Ltd.
Fig. 27 SWOT Analysis of Beijing Yanjing Brewery
Fig. 28 Revenue Generated by UB Group, ($ Million, 2012 - 2014)
Fig. 29 SWOT Analysis of UB Group
Start reading instantly.
This Report and over 67,069+ more Reports, Available with Avenue Library. T&C*.
Enterprise
License/PDF
Library
Membership
*Taxes/Fees, if applicable will be added during checkout. All prices in USD
To ensure high-level data integrity, accurate analysis, and impeccable forecasts
For complete satisfaction
On-demand customization of scope of the report to exactly meet your needs
Targeted market view to provide pertinent information and save time of readers
Get insights on topics that are crucial for your business. Stay abreast of your interest areas.
Get Industry Data AlertsTo ensure high-level data integrity, accurate analysis, and impeccable forecasts
For complete satisfaction
On-demand customization of scope of the report to exactly meet your needs
Targeted market view to provide pertinent information and save time of readers