
Automotive Sensor Market Research - 2027
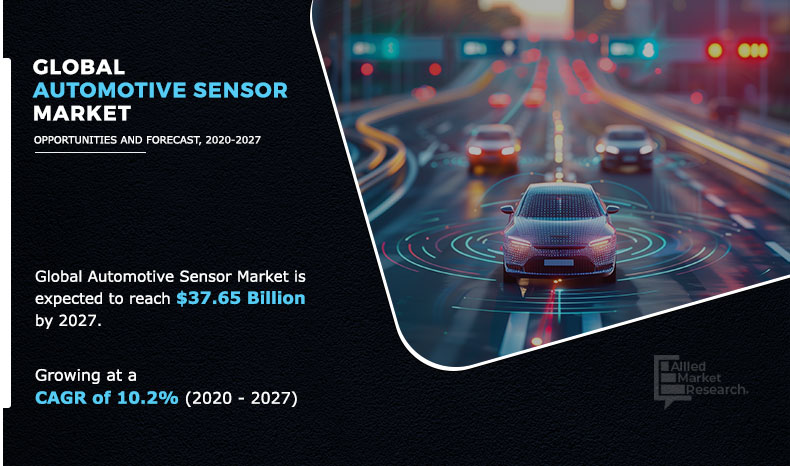
The Global Automotive Sensor Market size is expected to reach $37.65 billion by 2027 from $16.40 billion in 2019, growing at a CAGR of 10.2% from 2020 to 2027.
Automotive sensors detect, measure, and transmit information, which helps in analyzing the performance of vehicles. Sensors are devices that detect events or changes in the environment and then provide a corresponding output. They sense physical input such as light, heat, motion, moisture, pressure, or any other entity, and respond by producing an output on a display or transmitting the information in electronic form for further processing. It uses integrated circuit (IC) fabrication technology made on silicon wafers. It monitors and controls chemical, physical, and process changes in an automobile.
Sensors are used to minimize fuel consumption and reduce the onboard weight of a vehicle. Automotive sensors are smart sensors, which can be used to control and process temperature, coolant level, and pressure of oil in a vehicle. There are several types of sensors used in the automotive industry such as speed sensors, coolant sensors, temperature sensors, pressure sensors, magnetic sensors, voltage sensors, and oxygen sensors. The automotive sensor is one of the fastest-growing technologies in the original equipment manufacturer (OEM) section, especially in North America.
Presently, there is an increase in demand for intelligent sensors in vehicles, which allows manufacturers to give drivers a higher level of safety & security, reliability, and information & entertainment. Manufacturers of electronic devices are incorporating more sensors in their devices to add additional features and compete with other players in the market. High competition in the electronic market, steady upgrades in electronic devices, and an increase in automation in the automotive industry through electronic devices are anticipated to drive the growth of the automotive sensor industry in the future.
Smart sensors are used in accelerometers, which are equipped in vehicles to provide benefits such as safety and fuel efficiency. For instance, a smart sensor processes real-time data and notifies engine-related problems. Moreover, these facilitate communication between the engine, suspension, braking, and other controls of vehicles. Vehicle safety issues have led vehicle manufacturers to adopt smart sensors at a high rate, such as in airbags, for safety. These airbags are more effective compared to conventional airbags in sensing accidents, thus minimizing them.
By Type
Gas Sensor segment is projected as one of the most lucrative segments.
Rise in the use of pressure sensors in the automotive industry, owing to high adoption in various safety concerns of passengers, such as tire pressure monitoring systems (TPMS), advanced driver assistance systems (ADAS), and manifold absolute pressure sensors (MAPS); surge in demand for automotive sensors in hybrid and electric cars, as it is widely used in navigation system (GPS) and advanced driver assistance systems (ADAS); increase in use of custom-designed electronics devices is expected to boost the automotive sensor market growth. However, the high development cost of automotive sensors is expected to hinder the market growth. Moreover, technological advancements in the automobile industry and growth in the automotive sector are expected to offer lucrative opportunities for the automotive sensor market globally.
By Application
Body Electronics segment is expected to secure leading position during forecast period.
The global automotive sensor market is segmented on the basis of type, application, and region. By type, it is categorized into pressure sensors, temperature sensors, motion sensors, speed sensors, and gas sensors. By application, it is divided into powertrain, chassis, body electronics, safety & security, and telematics.
By Region
Asia-Pacific region would exhibit the highest CAGR of 11.30% during 2020-2027
By region, the global automotive sensor market trends are analyzed across North America (the U.S., Canada, and Mexico), Europe (the UK, Germany, Italy, France, and the rest of Europe), Asia-Pacific (China, India, Japan, South Korea, Taiwan, and rest of Asia-Pacific), and LAMEA (Latin America, the Middle East, and Africa). North America accounted for the highest market share in 2019, owing to the expansion of the electronics market and the rise in sales of electric vehicles (EVs). Europe was the second largest contributor in 2019, in terms of revenue and is expected to witness significant growth during the forecast period, owing to the rise in demand for passenger vehicles.
Top Impacting Factors
The most prominent factors that drive the automotive sensor market growth include an increase in the use of pressure sensors in the automotive industry, the surge in demand for automotive sensors in hybrid and electric cars, and the rise in the use of custom-designed electronic devices. However, the high development cost of automotive sensors is expected to hinder the market growth. Moreover, technological advancements in the automobile industry and growth in the automotive sector are expected to offer lucrative opportunities for the market globally. Each of these factors is anticipated to have a definite impact on the automotive sensor market during the forecast period.
Competition Analysis
Competitive analysis and profiles of the major automotive sensor market players, such as Robert Bosch, DENSO Corporation, AUTOLIV INC, Continental AG, Valeo, Delphi Automotive Company, Sensata Technologies, NXP Semiconductor, STMicroelectronics N.V, and Infineon Technologies AG are provided in this report.
Key Benefits for Stakeholders
- This study comprises an analytical depiction of the global automotive sensor market size along with the current trends and future estimations to depict the imminent investment pockets.
- The overall automotive sensor market analysis is determined to understand the profitable trends to gain a stronger foothold.
- The report presents information related to key drivers, restraints, and automotive sensor market opportunities with a detailed impact analysis.
- The current automotive sensor market forecast is quantitatively analyzed from 2019 to 2027 to benchmark financial competency.
- Porter’s five forces analysis illustrates the potency of the buyers and the automotive sensor market share of key vendors.
- The report includes the market trends and the market share of key vendors.
Global Automotive Sensor Market Report Highlights
| Aspects | Details |
| By Type |
|
| By APPLICATION |
|
| By Region |
|
| Key Market Players | VALEO, CONTINENTAL AG, DELPHI AUTOMOTIVE COMPANY, Infineon Technologies AG, Robert Bosch, DENSO Corporation, STMicroelectronics N.V, NXP Semiconductor, Sensata Technologies, AUTOLIV INC |
Analyst Review
The automotive sensor market holds a substantial scope for growth globally. Currently, it is in its growing stage. There is an increase in demand for sensors due to their wide usage in electronics devices. Manufacturers of electronic devices are incorporating more sensors in their devices to add additional features and keep ahead of other players in the highly competitive market.
These sensors have penetrated in almost every industry vertical but have highest usage in consumer electronic products, followed by automotive, and IT & telecom. Automotive industry incorporates sensors such as accelerometer, pressure sensor, speed sensor, gas sensor, oxygen sensor, magnetic sensor, and temperature detector to keep a track on parameters and provide a centralized system for automatic control in vehicles.
The incorporation of sensors into any device increases its functionality, accuracy, and efficiency, which leads to increase in its automation. This contributes to the high growth of the automotive sensor market. Automobile companies have started to increase the number of sensors in their devices to enhance overall user interface experience and to keep ahead of their competitors in the market. These sensors are used to keep a track of various parameters such as temperature, pressure, flow, level, and other vehicle parameters. These sensors measure and feed values to a centralized unit, which controls the parameters automatically.
The major companies profiled in the report include Robert Bosch, DENSO Corporation, AUTOLIV INC, Continental AG, Valeo, Delphi Automotive Company, Sensata Technologies, NXP Semiconductor, STMicroelectronics N.V, and Infineon Technologies AG.
Loading Table Of Content...

