0
2021
Canopy Bed Market

Canopy bed Market

by Product Type (Wooden and Metal), End Use (Residential and Commercial), Distribution Channel (Supermarket/Hypermarket, Specialty Store, E-commerce, and B2B): Global Opportunity Analysis and Industry Forecast, 2021-2030

Report Code: A13090
Aug 2021 | Pages: 263
Tables: 120
Charts: 51
  • Formats*:

  • pdf

    Single User License, Five User
    License & Enterprise User License

  • xls

    Data Pack Excel License

  • ppt

    It comes with the additional cost
    of $2500.00 contact sales.


COVID-19

Pandemic disrupted the entire world and affected many industries.

Get detailed COVID-19 impact analysis on the Canopy Bed Market

Request Now !

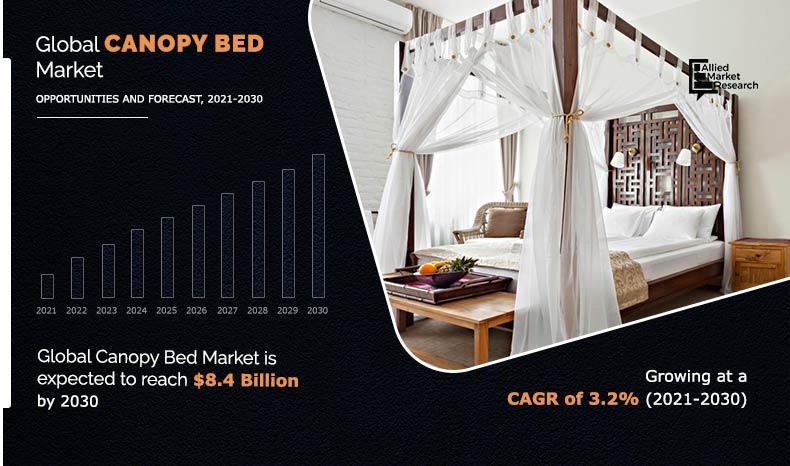
The global canopy bed market size was valued at $6.2 billion in 2020, and is projected to reach $8.4 billion by 2030, registering a CAGR of 3.2%. 

A canopy bed is a type of bed that is hung with bed curtains above it resembling a roof. Functionally, the canopy offers warmth, comfort, and privacy, and block light & sight. In addition, canopy bed plays a vital role in home décor and beautifying the ambience. Two types of canopy beds are available in the market, including wooden canopy bed and metal canopy bed. The canopy bed is easily available through various sales channels such as online store, specialty store, and supermarket, which aid in maximum revenue generation. 

Canopy-Bed-Market-2021-2030

Rise in spending power on home décor and home renovation is expected drive the growth of the global canopy bed market growth. For instance, according to the statistics shared by the National Association Of Home Builders (NAHB) in 2018, the spending per home improvement in California increased to over $9,565 with a rise of over 20% as compared with 2017.

The outbreak of the COVID-19 pandemic has shown a positive impact on the market. This is attributed to the fact that sales of bedding products, including canopy bed has witnessed significant increase, as consumers across the globe are now actively getting involved in home designing, remodeling, and renovation during the lockdown period. Furthermore, consumers are choosing to replace their bedding products, with new and aesthetic furniture including canopy bed.  This, in turn, has increased the demand for canopy bed to be used at home, which positively impacts the market growth, globally during the global health crisis.

The global canopy bed market is segmented into product type, end user, distribution channel, and region. By product type, the market is classified into wooden and metal. Depending on end user, it is bifurcated into residential and commercial. On the basis of distribution channel, it is segregated into supermarket/hypermarket, specialty store, e-commerce, and B2B. Region wise, the market is analyzed across North America (the U.S., Canada, and Mexico), Europe (Germany, France, UK, Italy, Spain, Russia, and rest of Europe), Asia-Pacific (China, India, Australia & New Zealand, Japan, South Korea, ASEAN, and rest of Asia-Pacific), and LAMEA (Brazil, Saudi Arabia, South Africa, Turkey, and rest of LAMEA).

On the basis of product type, the wooden segment accounted for the highest market share in 2020.This is attributable to the surface temperature of the wooden canopy bed, which is not affected much by the temperature of its surrounding, thereby increasing its demand among the customers.

Canopy bed Market
By Product Type

Your browser does not support the canvas element.

The wooden segment dominates the global Canopy Bed market and is expected to retain its dominance throughout the forecast period.

Get more information on this report : Request Sample Pages

By end user, the market is divided into residential and commercial. In 2020, the commercial dominated the global canopy bed market, owing to rise in number of hotels, guest houses, and other types of travel accommodation across the globe.

Canopy bed Market
By End User

Your browser does not support the canvas element.

The commercial segment dominates the global Canopy Bed market and is expected to retain its dominance throughout the forecast period.

Get more information on this report : Request Sample Pages

Depending on distribution channel, the market is fragmented into specialty store, supermarket/hypermarket, e-commerce, and others. In 2020, the supermarket/hypermarket segment garnered the largest share in the global canopy bed market. This is attributed to the fact that supermarket/hypermarket is gaining high popularity, owing to availability of a broad range of consumer goods under a single roof, ample parking space, and convenient operation timings. Moreover, increase in urbanization, rise in working class population, and competitive pricing boost the popularity of supermarkets/hypermarkets in developed and developing regions.

Canopy bed Market
By Distribution Channel

Your browser does not support the canvas element.

The B2B segment dominates the global Canopy Bed market and is expected to retain its dominance throughout the forecast period.

Get more information on this report : Request Sample Pages

Region wise, the market is analyzed across North America, Europe, Asia-Pacific, and LAMEA. North America led the market in 2020, owing to infrastructure development in the U.S. such as increase in hotels, guest houses, and restaurants, which propel the demand for canopy bed. 

Canopy bed Market
By Region

2030
North America 
Europe
Asia-Pacific
LAMEA

The North America segment dominates the global Canopy Bed market and is expected to retain its dominance throughout the forecast period.

Get more information on this report : Request Sample Pages

The key players operating in the global canopy bed market focus on prominent strategies to overcome competition and maintain as well as improve their share worldwide. Some of the major players in the global canopy bed industry analyzed in this report include AFK Furniture, Amish Furniture Factory, Benicia Foundry & Iron Works, Bernhardt Furniture Company, Charles P. Rogers, DHP Furniture, Inspire Q (Top-Line Furniture), The Four Poster Bed Company, TurnPost, and itahome.

Key Benefits For Stakeholders

  • This report provides a quantitative analysis of the current canopy bed trends, estimations, and dynamics of the global canopy bed market for the period of 2020–2030 to identify the prevailing market opportunities.
  • The key countries in four major regions have been mapped depending on their market share.
  • Porter’s five forces analysis highlights the potency of buyers and suppliers to enable stakeholders to make profit-oriented business decisions and strengthen their supplier–buyer network.
  • In-depth analysis of the market segmentation assists to determine the prevailing market opportunities.
  • Major countries in each region have been mapped according to their revenue contribution to the global industry. 
  • Market player positioning facilitates benchmarking and provides a clear understanding of the present position of market players.
  • The report includes regional as well as global the  canopy bed market analysis, key players, market segments, application areas, and growth strategies.

Key Market Segments

By Product Type

  • Wooden
  • Metal

By End Use

  • Residential
  • Commercial

By Distribution Channel

  • Supermarket/Hypermarket
  • Specialty Store
  • E-commerce
  • B2B

By Region

  • North America
    • U.S.
    • Canada
    • Mexico
  • Europe
    • Germany
    • France
    • UK
    • Italy
    • Spain
    • Russia
    • Rest of Europe
  • Asia-Pacific
    • China
    • Japan
    • India
    • Australia and New Zealand
    • South Korea
    • ASEAN
    • Rest of Asia-Pacific
  • LAMEA
    • Brazil
    • Saudi Arabia
    • South Africa
    • Turkey
    • Rest of LAMEA

Canopy bed Market Report Highlights

Aspects Details
By PRODUCT TYPE
  • Wooden
  • Metal
By END USER
  • Residential
  • Commercial
By DISTRIBUTION CHANNEL
  • E-Commerce
  • Specialty Store
  • Supermarket/Hypermarket
  • B2B
By Region
  • North America  (U.S., Canada, Mexico)
  • Europe  (France, Germany, Italy, Spain, UK, Russia, Rest of Europe)
  • Asia-Pacific  (China, Japan, India, South Korea, Australia, Thailand, Malaysia, Indonesia, Rest of Asia-Pacific)
  • LAMEA  (Brazil, South Africa, Saudi Arabia, UAE, Argentina, Rest of LAMEA)
Key Market Players YITAHOME, BENICIA FOUNDRY & IRON WORKS, AMISH FURNITURE FACTORY, INSPIRE Q (TOP-LINE FURNITURE), AFK FURNITURE, CHARLES P. ROGERS, TURNPOST, THE FOUR POSTER BED COMPANY, BERNHARDT FURNITURE COMPANY, DHP FURNITURE
 

CHAPTER 1:INTRODUCTION

1.1.Report description
1.2.Key benefits for stakeholders
1.3.Key market segments
1.4.Research methodology

1.4.1.Secondary research
1.4.2.Primary research
1.4.3.Analyst tools and models

CHAPTER 2:EXECUTIVE SUMMARY

2.1.Key findings of the study
2.2.CXO perspective

CHAPTER 3:MARKET OVERVIEW

3.1.Market definition and scope
3.2.Key findings

3.2.1.Top investment pockets

3.3.Porter’s five forces analysis
3.4.COVID-19 impact on canopy bed market

3.4.1.Multiple scenario

3.5.Value chain Analysis
3.6.Top Impacting Factor
3.7.Parent Market Analysis
3.8.Market dynamics

3.8.1.Drivers

3.8.1.1.Global surge in sales of new and existing residential homes
3.8.1.2.Increase in spending on home improvement and home décor
3.8.1.3.Increase in number of commercial spaces
3.8.1.4.Rapid growth of the retail sector

3.8.2.Restraint

3.8.2.1.Increase in cost of raw material

3.8.3.Opportunities

3.8.3.1.Improving lifestyle due to rise in disposable income
3.8.3.2.Rapid growth of online retail platform

CHAPTER 4:CANOPY BED MARKET, BY PRODUCT TYPE

4.1.Overview

4.1.1.Market size and forecast

4.2.Wooden

4.2.1.Key market trends, growth factors, and opportunities
4.2.2.Market size and forecast
4.2.3.Market analysis, by country

4.3.Metal

4.3.1.Key market trends, growth factors, and opportunities
4.3.2.Market size and forecast
4.3.3.Market analysis, by country

CHAPTER 5:CANOPY BED MARKET, BY END USER

5.1.Overview

5.1.1.Market size and forecast.

5.2.Residential

5.2.1.Key market trends, growth factors, and opportunities
5.2.2.Market size and forecast
5.2.3.Market analysis, by country

5.3.Commercial

5.3.1.Key market trends, growth factors, and opportunities
5.3.2.Market size and forecast
5.3.3.Market analysis, by country

CHAPTER 6:GLOBAL CANOPY BED MARKET, BY DISTRIBUTION CHANNEL

6.1.Overview

6.1.1.Market size and forecast

6.2.E-Commerce

6.2.1.Key market trends, growth factors, and opportunities
6.2.2.Market size and forecast
6.2.3.Market analysis by country

6.3.Specialty Store

6.3.1.Key market trends, growth factors, and opportunities
6.3.2.Market size and forecast
6.3.3.Market analysis by country

6.4.Supermarket/Hypermarket

6.4.1.Key market trends, growth factors, and opportunities
6.4.2.Market size and forecast
6.4.3.Market analysis by country

6.5.B2B

6.5.1.Key market trends, growth factors, and opportunities
6.5.2.Market size and forecast
6.5.3.Market analysis by country

CHAPTER 7:CANOPY BED MARKET, BY REGION

7.1.Overview

7.1.1.Market size and forecast, by region

7.2.North America

7.2.1.Key market trends, growth factors, and opportunities
7.2.2.Market size and forecast, by product type
7.2.3.Market size and forecast, by End user
7.2.4.Market size and forecast, by Distribution channel
7.2.5.Market size and forecast, by country

7.2.5.1.U.S.

7.2.5.1.1.Market size and forecast, by product type
7.2.5.1.2.Market size and forecast, by End user
7.2.5.1.3.Market size and forecast, by Distribution channel

7.2.5.2.Mexico

7.2.5.2.1.Market size and forecast, by product type
7.2.5.2.2.Market size and forecast, by End user
7.2.5.2.3.Market size and forecast, by Distribution channel

7.2.5.3.Canada

7.2.5.3.1.Market size and forecast, by product type
7.2.5.3.2.Market size and forecast, by End user
7.2.5.3.3.Market size and forecast, by Distribution channel

7.3.Europe

7.3.1.Key market trends, growth factors, and opportunities
7.3.2.Market size and forecast, by product type
7.3.3.Market size and forecast, by End user
7.3.4.Market size and forecast, by Distribution channel
7.3.5.Market size and forecast, by country

7.3.5.1.Germany

7.3.5.1.1.Market size and forecast, by product type
7.3.5.1.2.Market size and forecast, by End user
7.3.5.1.3.Market size and forecast, by Distribution channel

7.3.5.2.UK

7.3.5.2.1.Market size and forecast, by product type
7.3.5.2.2.Market size and forecast, by End user
7.3.5.2.3.Market size and forecast, by Distribution channel

7.3.5.3.France

7.3.5.3.1.Market size and forecast, by product type
7.3.5.3.2.Market size and forecast, by End user
7.3.5.3.3.Market size and forecast, by Distribution channel

7.3.5.4.Italy

7.3.5.4.1.Market size and forecast, by product type
7.3.5.4.2.Market size and forecast, by End user
7.3.5.4.3.Market size and forecast, by Distribution channel

7.3.5.5.Spain

7.3.5.5.1.Market size and forecast, by product type
7.3.5.5.2.Market size and forecast, by End user
7.3.5.5.3.Market size and forecast, by Distribution channel

7.3.5.6.Russia

7.3.5.6.1.Market size and forecast, by product type
7.3.5.6.2.Market size and forecast, by End user
7.3.5.6.3.Market size and forecast, by Distribution channel

7.3.5.7.Rest of Europe

7.3.5.7.1.Market size and forecast, by product type
7.3.5.7.2.Market size and forecast, by End user
7.3.5.7.3.Market size and forecast, by Distribution channel

7.4.Asia-Pacific

7.4.1.Key market trends, growth factors, and opportunities
7.4.2.Market size and forecast, by product type
7.4.3.Market size and forecast, by End user
7.4.4.Market size and forecast, by Distribution channel
7.4.5.Market size and forecast, by country

7.4.5.1.India

7.4.5.1.1.Market size and forecast, by product type
7.4.5.1.2.Market size and forecast, by End user
7.4.5.1.3.Market size and forecast, by Distribution channel

7.4.5.2.Japan

7.4.5.2.1.Market size and forecast, by product type
7.4.5.2.2.Market size and forecast, by End user
7.4.5.2.3.Market size and forecast, by Distribution channel

7.4.5.3.China

7.4.5.3.1.Market size and forecast, by product type
7.4.5.3.2.Market size and forecast, by End user
7.4.5.3.3.Market size and forecast, by Distribution channel

7.4.5.4.Australia & New Zealand

7.4.5.4.1.Market size and forecast, by product type
7.4.5.4.2.Market size and forecast, by End user
7.4.5.4.3.Market size and forecast, by Distribution channel

7.4.5.5.ASEAN

7.4.5.5.1.Market size and forecast, by product type
7.4.5.5.2.Market size and forecast, by End user
7.4.5.5.3.Market size and forecast, by Distribution channel

7.4.5.6.South Korea

7.4.5.6.1.Market size and forecast, by product type
7.4.5.6.2.Market size and forecast, by End user
7.4.5.6.3.Market size and forecast, by Distribution channel

7.4.5.7.Rest of Asia-Pacific

7.4.5.7.1.Market size and forecast, by product type
7.4.5.7.2.Market size and forecast, by End user
7.4.5.7.3.Market size and forecast, by Distribution channel

7.5.LAMEA

7.5.1.Key market trends, growth factors, and opportunities
7.5.2.Market size and forecast, by product type
7.5.3.Market size and forecast, by End user
7.5.4.Market size and forecast, by Distribution channel
7.5.5.Market size and forecast, by country

7.5.5.1.Brazil

7.5.5.1.1.Market size and forecast, by product type
7.5.5.1.2.Market size and forecast, by End user
7.5.5.1.3.Market size and forecast, by Distribution channel

7.5.5.2.Saudi Arabia

7.5.5.2.1.Market size and forecast, by product type
7.5.5.2.2.Market size and forecast, by End user
7.5.5.2.3.Market size and forecast, by Distribution channel

7.5.5.3.South Africa

7.5.5.3.1.Market size and forecast, by product type
7.5.5.3.2.Market size and forecast, by End user
7.5.5.3.3.Market size and forecast, by Distribution channel

7.5.5.4.Turkey

7.5.5.4.1.Market size and forecast, by product type
7.5.5.4.2.Market size and forecast, by End user
7.5.5.4.3.Market size and forecast, by Distribution channel

7.5.5.5.Rest of LAMEA

7.5.5.5.1.Market size and forecast, by product type
7.5.5.5.2.Market size and forecast, by End user
7.5.5.5.3.Market size and forecast, by Distribution channel

CHAPTER 8:COMPETITION LANDSCAPE

8.1.Top Player Positioning
8.2.Product mapping
8.3.Competitive dashboard
8.4.Competitive heat map

CHAPTER 9:COMPANY PROFILES

9.1.AFK FURNITURE
9.1.1.Company overview
9.1.2.Key Executives
9.1.3.Company snapshot
9.1.4.Product portfolio

9.2.AMISH FURNITURE FACTORY

9.2.1.Company overview
9.2.2.Product portfolio

9.3.BENICIA FOUNDRY & IRON WORKS

9.3.1.Company overview
9.3.2.Company snapshot
9.3.3.Product portfolio

9.4.BERNHARDT FURNITURE COMPANY

9.4.1.Company overview
9.4.2.Key Executives
9.4.3.Company snapshot
9.4.4.Product portfolio

9.5.CHARLES P. ROGERS

9.5.1.Company overview
9.5.2.Key Executives
9.5.3.Company snapshot
9.5.4.Product portfolio

9.6.DHP FURNITURE

9.6.1.Company overview
9.6.2.Key Executives
9.6.3.Company snapshot
9.6.4.Product portfolio

9.7.INSPIRE Q (TOP-LINE FURNITURE)

9.7.1.Company overview
9.7.2.Key Executives
9.7.3.Company snapshot
9.7.4.Product portfolio

9.8.THE FOUR POSTER BED COMPANY

9.8.1.Company overview
9.8.2.Key Executives
9.8.3.Company snapshot
9.8.4.Product portfolio

9.9.TURNPOST

9.9.1.Company overview
9.9.2.Key Executives
9.9.3.Company snapshot
9.9.4.Product portfolio

9.10.YITAHOME

9.10.1.Company overview
9.10.2.Company snapshot
9.10.3.Product portfolio

LIST OF TABLES

TABLE 01.CANOPY BED MARKET REVENUE, BY PRODUCT TYPE, 2020–2030 ($MILLION)
TABLE 02.WOODEN MARKET REVENUE, BY REGION, 2020–2030 ($MILLION)
TABLE 03.METAL CANOPY BED MARKET REVENUE, BY REGION, 2020–2030 ($MILLION)
TABLE 04.GLOBAL CANOPY BED MARKET REVENUE, BY END USER 2020–2030 ($MILLION)
TABLE 05.CANOPY BED MARKET REVENUE FROM RESIDENTIAL, BY REGION, 2020–2030 ($MILLION)
TABLE 06.CANOPY BED MARKET REVENUE FROM COMMERCIAL, BY REGION, 2020–2030 ($MILLION)
TABLE 07.GLOBAL CANOPY BED MARKET REVENUE, BY DISTRIBUTION CHANNEL 2020-2030($MILLION)
TABLE 08.GLOBAL CANOPY BED MARKET REVENUE, BY REGION, 2020-2030($MILLION)
TABLE 09.GLOBAL SPECIALTY STORE CANOPY BED MARKET REVENUE, BY REGION, 2020-2030($MILLION)
TABLE 10.GLOBAL CANOPY BED MARKET REVENUE FROM SUPERMARKET/HYPERMARKET, BY REGION, 2020-2030($MILLION)
TABLE 11.GLOBAL CANOPY BED MARKET REVENUE FROM B2B, BY REGION, 2020-2030($MILLION)
TABLE 12.CANOPY BED MARKET REVENUE, BY REGION, 2020–2030 ($MILLION)
TABLE 13.NORTH AMERICA CANOPY BED MARKET REVENUE, BY PRODUCT TYPE, 2020–2030 ($MILLION)
TABLE 14.NORTH AMERICA CANOPY BED MARKET REVENUE, BY END USER, 2020–2030 ($MILLION)
TABLE 15.NORTH AMERICA CANOPY BED MARKET REVENUE, BY DISTRIBUTION CHANNEL, 2020-2030($MILLION)
TABLE 16.NORTH AMERICA CANOPY BED MARKET REVENUE, BY COUNTRY, 2020–2030 ($MILLION)
TABLE 17.U.S. CANOPY BED MARKET REVENUE, BY PRODUCT TYPE, 2020–2030 ($MILLION)
TABLE 18.U.S. CANOPY BED MARKET REVENUE, BY END USER, 2020–2030 ($MILLION)
TABLE 19.U.S CANOPY BED MARKET REVENUE, BY DISTRIBUTION CHANNEL, 2020-2030($MILLION)
TABLE 20.MEXICO CANOPY BED MARKET REVENUE, BY PRODUCT TYPE, 2020–2030 ($MILLION)
TABLE 21.MEXICO CANOPY BED MARKET REVENUE, BY END USER, 2020–2030 ($MILLION)
TABLE 22.MEXICO CANOPY BED MARKET REVENUE, BY DISTRIBUTION CHANNEL, 2020-2030($MILLION)
TABLE 23.CANADA CANOPY BED MARKET REVENUE, BY PRODUCT TYPE, 2020–2030 ($MILLION)
TABLE 24.CANADA CANOPY BED MARKET REVENUE, BY END USER, 2020–2030 ($MILLION)
TABLE 25.CANADA CANOPY BED MARKET REVENUE, BY DISTRIBUTION CHANNEL, 2020-2030($MILLION)
TABLE 26.EUROPE CANOPY BED MARKET REVENUE, BY PRODUCT TYPE, 2020–2030 ($MILLION)
TABLE 27.EUROPE CANOPY BED MARKET REVENUE, BY END USER, 2020–2030 ($MILLION)
TABLE 28.EUROPE CANOPY BED MARKET REVENUE, BY DISTRIBUTION CHANNEL, 2020-2030($MILLION)
TABLE 29.EUROPE CANOPY BED MARKET REVENUE, BY COUNTRY, 2020–2030 ($MILLION)
TABLE 30.GERMANY CANOPY BED MARKET REVENUE, BY PRODUCT TYPE, 2020–2030 ($MILLION)
TABLE 31.GERMANY CANOPY BED MARKET REVENUE, BY END USER, 2020–2030 ($MILLION)
TABLE 32.GERMANY CANOPY BED MARKET REVENUE, BY DISTRIBUTION CHANNEL, 2020-2030($MILLION)
TABLE 33.UK CANOPY BED MARKET REVENUE, BY PRODUCT TYPE, 2020–2030 ($MILLION)
TABLE 34.UK CANOPY BED MARKET REVENUE, BY END USER, 2020–2030 ($MILLION)
TABLE 35.UK CANOPY BED MARKET REVENUE, BY DISTRIBUTION CHANNEL, 2020-2030($MILLION)
TABLE 36.FRANCE CANOPY BED MARKET REVENUE, BY PRODUCT TYPE, 2020–2030 ($MILLION)
TABLE 37.FRANCE CANOPY BED MARKET REVENUE, BY END USER, 2020–2030 ($MILLION)
TABLE 38.FRANCE CANOPY BED MARKET REVENUE, BY DISTRIBUTION CHANNEL, 2020-2030($MILLION)
TABLE 39.ITALY CANOPY BED MARKET REVENUE, BY PRODUCT TYPE, 2020–2030 ($MILLION)
TABLE 40.ITALY CANOPY BED MARKET REVENUE, BY END USER, 2020–2030 ($MILLION)
TABLE 41.ITALY CANOPY BED MARKET REVENUE, BY DISTRIBUTION CHANNEL, 2020-2030($MILLION)
TABLE 42.SPAIN CANOPY BED MARKET REVENUE, BY PRODUCT TYPE, 2020–2030 ($MILLION)
TABLE 43.SPAIN CANOPY BED MARKET REVENUE, BY END USER, 2020–2030 ($MILLION)
TABLE 44.SPAIN CANOPY BED MARKET REVENUE, BY DISTRIBUTION CHANNEL, 2020-2030($MILLION)
TABLE 45.RUSSIA CANOPY BED MARKET REVENUE, BY PRODUCT TYPE, 2020–2030 ($MILLION)
TABLE 46.RUSSIA CANOPY BED MARKET REVENUE, BY END USER, 2020–2030 ($MILLION)
TABLE 47.RUSSIA CANOPY BED MARKET REVENUE, BY DISTRIBUTION CHANNEL, 2020-2030($MILLION)
TABLE 48.REST OF EUROPE CANOPY BED MARKET REVENUE, BY PRODUCT TYPE , 2020–2030 ($MILLION)
TABLE 49.REST OF EUROPE CANOPY BED MARKET REVENUE, BY END USER, 2020–2030 ($MILLION)
TABLE 50.REST OF EUROPE CANOPY BED MARKET REVENUE, BY DISTRIBUTION CHANNEL, 2020-2030($MILLION)
TABLE 51.ASIA-PACIFIC CANOPY BED MARKET REVENUE, BY PRODUCT TYPE, 2020–2030 ($MILLION)
TABLE 52.ASIA-PACIFIC CANOPY BED MARKET REVENUE, BY END USER, 2020–2030 ($MILLION)
TABLE 53.ASIA-PACIFIC CANOPY BED MARKET REVENUE, BY DISTRIBUTION CHANNEL, 2020-2030($MILLION)
TABLE 54.ASIA-PACIFIC CANOPY BED MARKET REVENUE, BY COUNTRY, 2020–2030 ($MILLION)
TABLE 55.INDIA CANOPY BED MARKET REVENUE, BY PRODUCT TYPE, 2020–2030 ($MILLION)
TABLE 56.INDIA CANOPY BED MARKET REVENUE, BY END USER, 2020–2030 ($MILLION)
TABLE 57.INDIA CANOPY BED MARKET REVENUE, BY DISTRIBUTION CHANNEL, 2020-2030($MILLION)
TABLE 58.JAPAN CANOPY BED MARKET REVENUE, BY PRODUCT TYPE, 2020–2030 ($MILLION)
TABLE 59.JAPAN CANOPY BED MARKET REVENUE, BY END USER, 2020–2030 ($MILLION)
TABLE 60.JAPAN CANOPY BED MARKET REVENUE, BY DISTRIBUTION CHANNEL, 2020-2030($MILLION)
TABLE 61.CHINA CANOPY BED MARKET REVENUE, BY PRODUCT TYPE, 2020–2030 ($MILLION)
TABLE 62.CHINA CANOPY BED MARKET REVENUE, BY END USER, 2020–2030 ($MILLION)
TABLE 63.CHINA CANOPY BED MARKET REVENUE, BY DISTRIBUTION CHANNEL, 2020-2030($MILLION)
TABLE 64.AUSTRALIA & NEW ZEALAND CANOPY BED MARKET REVENUE, BY PRODUCT TYPE, 2020–2030 ($MILLION)
TABLE 65.AUSTRALIA & NEW ZEALAND CANOPY BED MARKET REVENUE, BY END USER, 2020–2030 ($MILLION)
TABLE 66.AUSTRALIA & NEW ZEALAND CANOPY BED MARKET REVENUE, BY DISTRIBUTION CHANNEL, 2020-2030($MILLION)
TABLE 67.ASEAN CANOPY BED MARKET REVENUE, BY PRODUCT TYPE, 2020–2030 ($MILLION)
TABLE 68.ASEAN CANOPY BED MARKET REVENUE, BY END USER, 2020–2030 ($MILLION)
TABLE 69.ASEAN CANOPY BED MARKET REVENUE, BY DISTRIBUTION CHANNEL, 2020-2030($MILLION)
TABLE 70.SOUTH KOREA CANOPY BED MARKET REVENUE, BY PRODUCT TYPE, 2020–2030 ($MILLION)
TABLE 71.SOUTH KOREA CANOPY BED MARKET REVENUE, BY END USER, 2020–2030 ($MILLION)
TABLE 72.SOUTH KOREA CANOPY BED MARKET REVENUE, BY DISTRIBUTION CHANNEL, 2020-2030($MILLION)
TABLE 73.REST OF ASIA-PACIFIC CANOPY BED MARKET REVENUE, BY PRODUCT TYPE, 2020–2030 ($MILLION)
TABLE 74.REST OF ASIA-PACIFIC CANOPY BED MARKET REVENUE, BY END USER, 2020–2030 ($MILLION)
TABLE 75.REST OF ASIA-PACIFIC CANOPY BED MARKET REVENUE, BY DISTRIBUTION CHANNEL, 2020-2030($MILLION)
TABLE 76.LAMEA CANOPY BED MARKET REVENUE, BY PRODUCT TYPE, 2020–2030 ($MILLION)
TABLE 77.LAMEA CANOPY BED MARKET REVENUE, BY END USER, 2020–2030 ($MILLION)
TABLE 78.LAMEA CANOPY BED MARKET REVENUE, BY DISTRIBUTION CHANNEL, 2020-2030($MILLION)
TABLE 79.LAMEA CANOPY BED MARKET REVENUE, BY COUNTRY, 2020–2030 ($MILLION)
TABLE 80.BRAZIL CANOPY BED MARKET REVENUE, BY PRODUCT TYPE, 2020–2030 ($MILLION)
TABLE 81.BRAZIL CANOPY BED MARKET REVENUE, BY END USER, 2020–2030 ($MILLION)
TABLE 82.BRAZIL CANOPY BED MARKET REVENUE, BY DISTRIBUTION CHANNEL, 2020-2030($MILLION)
TABLE 83.SAUDI ARABIA CANOPY BED MARKET REVENUE, BY PRODUCT TYPE, 2020–2030 ($MILLION)
TABLE 84.SAUDI ARABIA CANOPY BED MARKET REVENUE, BY END USER, 2020–2030 ($MILLION)
TABLE 85.SAUDI ARABIA CANOPY BED MARKET REVENUE, BY DISTRIBUTION CHANNEL, 2020-2030($MILLION)
TABLE 86.SOUTH AFRICA CANOPY BED MARKET REVENUE, BY PRODUCT TYPE, 2020–2030 ($MILLION)
TABLE 87.SOUTH AFRICA CANOPY BED MARKET REVENUE, BY END USER, 2020–2030 ($MILLION)
TABLE 88.SOUTH AFRICA CANOPY BED MARKET REVENUE, BY DISTRIBUTION CHANNEL, 2020-2030($MILLION)
TABLE 89.TURKEY CANOPY BED MARKET REVENUE, BY PRODUCT TYPE, 2020–2030 ($MILLION)
TABLE 90.TURKEY CANOPY BED MARKET REVENUE, BY END USER, 2020–2030 ($MILLION)
TABLE 91.TURKEY CANOPY BED MARKET REVENUE, BY DISTRIBUTION CHANNEL, 2020-2030($MILLION)
TABLE 92.REST OF LAMEA CANOPY BED MARKET REVENUE, BY PRODUCT TYPE, 2020–2030 ($MILLION)
TABLE 93.REST OF LAMEA CANOPY BED MARKET REVENUE, BY END USER, 2020–2030 ($MILLION)
TABLE 94.REST OF LAMEA CANOPY BED MARKET REVENUE, BY DISTRIBUTION CHANNEL, 2020-2030($MILLION)
TABLE 95.AFK FURNITURE: KEY EXECUTIVES
TABLE 96.AFK FURNITURE: COMPANY SNAPSHOT
TABLE 97.AFK FURNITURE: PRODUCT PORTFOLIO
TABLE 98.AMISH FURNITURE FACTORY: PRODUCT PORTFOLIO
TABLE 99.BENICIA FOUNDRY & IRON WORKS: COMPANY SNAPSHOT
TABLE 100.BENICIA FOUNDRY & IRON WORKS: PRODUCT PORTFOLIO
TABLE 101.BERNHARDT FURNITURE COMPANY: KEY EXECUTIVES
TABLE 102.BERNHARDT FURNITURE COMPANY: COMPANY SNAPSHOT
TABLE 103.BERNHARDT FURNITURE COMPANY: PRODUCT PORTFOLIO
TABLE 104.CHARLES P. ROGERS: KEY EXECUTIVES
TABLE 105.CHARLES P. ROGERS: COMPANY SNAPSHOT
TABLE 106.CHARLES P. ROGERS: PRODUCT PORTFOLIO
TABLE 107.DHP FURNITURE: KEY EXECUTIVES
TABLE 108.DHP FURNITURE: COMPANY SNAPSHOT
TABLE 109.DHP FURNITURE: PRODUCT PORTFOLIO
TABLE 110.INSPIRE Q (TOP-LINE FURNITURE): KEY EXECUTIVES
TABLE 111.INSPIRE Q (TOP-LINE FURNITURE): COMPANY SNAPSHOT
TABLE 112.INSPIRE Q (TOP-LINE FURNITURE): PRODUCT PORTFOLIO
TABLE 113.THE FOUR POSTER BED COMPANY: KEY EXECUTIVES
TABLE 114.THE FOUR POSTER BED COMPANY.: COMPANY SNAPSHOT
TABLE 115.UNDER ARMOUR, INC.: PRODUCT PORTFOLIO
TABLE 116.TURNPOST: KEY EXECUTIVES
TABLE 117.TURNPOST: COMPANY SNAPSHOT
TABLE 118.TURNPOST: PRODUCT PORTFOLIO
TABLE 119.YITAHOME: COMPANY SNAPSHOT
TABLE 120.YITAHOME: PRODUCT PORTFOLIO

LIST OF FIGURES

FIGURE 01.CANOPY BED MARKET SNAPSHOT
FIGURE 02.CANOPY BED MARKET: SEGMENTATION
FIGURE 03.TOP INVESTMENT POCKETS
FIGURE 04.HIGH BARGAINING POWER OF SUPPLIERS
FIGURE 05.HIGH BARGAINING POWER OF BUYER
FIGURE 06.HIGH THREAT OF SUBSTITUTION
FIGURE 07.MODERATE THREAT OF NEW ENTRANTS
FIGURE 08.HIGH INTENSITY OF COMPETITIVE RIVALRY
FIGURE 09.CANOPY BED MARKET: COVID IMPACT ANALYSIS
FIGURE 10.CANOPY BED MARKET: VALUE CHAIN ANALYSIS
FIGURE 11.CANOPY BED MARKET: TOP IMPACTING FACTOR
FIGURE 12.CANOPY BED MARKET: PARENT MARKET ANALYSIS
FIGURE 13.CANOPY BED MARKET: DRIVERS, RESTRAINTS, AND OPPORTUNITIES
FIGURE 14.CANOPY BED MARKET, BY PRODUCT TYPE, 2020 (%)
FIGURE 15.COMPARATIVE MARKET SHARE ANALYSIS OF WOODEN CANOPY BED MARKET, BY COUNTRY,2020 AND 2030 (%)
FIGURE 16.COMPARATIVE MARKET SHARE ANALYSIS OF METAL CANOPY BED MARKET, BY COUNTRY 2020 AND 2030 (%)
FIGURE 17.GLOBAL CANOPY BED MARKET, BY END USER, 2020 (%)
FIGURE 18.COMPARATIVE MARKET SHARE ANALYSIS OF CANOPY BED MARKET FROM RESIDENTIAL, BY COUNTRY 2020 AND 2030 (%)
FIGURE 19.COMPARATIVE MARKET SHARE ANALYSIS OF CANOPY BED MARKET FROM COMMERCIAL, BY COUNTRY ,2020 AND 2030 (%)
FIGURE 20.GLOBAL CANOPY BED MARKET, BY DISTRIBUTION CHANNEL, 2020 (%)
FIGURE 21.COMPARATIVE MARKET SHARE ANALYSIS OF GLOBAL CANOPY BED MARKET REVENUE FROM E-COMMERCE, BY COUNTRY, 2020 AND 2030(%)
FIGURE 22.COMPARATIVE REGIONAL MARKET SHARE ANALYSIS OF GLOBAL CANOPY BED MARKET FROM SPECIALTY STORE, BY COUNTRY, 2020 AND 2030(%)
FIGURE 23.COMPARATIVE MARKET SHARE ANALYSIS OF GLOBAL CANOPY BED MARKET REVENUE FROM SUPERMARKET/HYPERMARKET, BY COUNTRY, 2020 AND 2030(%)
FIGURE 24.COMPARATIVE L MARKET SHARE ANALYSIS OF GLOBAL CANOPY BED MARKET REVENUE FROM B2B, BY COUNTRY, 2020 AND 2030(%)
FIGURE 25.CANOPY BED MARKET, BY REGION, 2020 (%)
FIGURE 26.U.S. CANOPY BED MARKET REVENUE, 2020–2030 ($MILLION)
FIGURE 27.MEXICO CANOPY BED MARKET REVENUE, 2020–2030 ($MILLION)
FIGURE 28.CANADA CANOPY BED MARKET REVENUE, 2020–2030 ($MILLION)
FIGURE 29.GERMANY CANOPY BED MARKET REVENUE, 2020–2030 ($MILLION)
FIGURE 30.UK CANOPY BED MARKET REVENUE, 2020–2030 ($MILLION)
FIGURE 31.FRANCE CANOPY BED MARKET REVENUE, 2020–2030 ($MILLION)
FIGURE 32.ITALY CANOPY BED MARKET REVENUE, 2020–2030 ($MILLION)
FIGURE 33.SPAIN CANOPY BED MARKET REVENUE, 2020–2030 ($MILLION)
FIGURE 34.RUSSIA CANOPY BED MARKET REVENUE, 2020–2030 ($MILLION)
FIGURE 35.REST OF EUROPE CANOPY BED MARKET REVENUE, 2020–2030 ($MILLION)
FIGURE 36.INDIA CANOPY BED MARKET REVENUE, 2020–2030 ($MILLION)
FIGURE 37.JAPAN CANOPY BED MARKET REVENUE, 2020–2030 ($MILLION)
FIGURE 38.CHINA CANOPY BED MARKET REVENUE, 2020–2030 ($MILLION)
FIGURE 39.AUSTRALIA & NEW ZEALAND CANOPY BED MARKET REVENUE, 2020–2030 ($MILLION)
FIGURE 40.ASEAN CANOPY BED MARKET REVENUE, 2020–2030 ($MILLION)
FIGURE 41.SOUTH KOREA CANOPY BED MARKET REVENUE, 2020–2030 ($MILLION)
FIGURE 42.REST OF ASIA-PACIFIC CANOPY BED MARKET REVENUE, 2020–2030 ($MILLION)
FIGURE 43.BRAZIL CANOPY BED MARKET REVENUE, 2020–2030 ($MILLION)
FIGURE 44.SAUDI ARABIA CANOPY BED MARKET REVENUE, 2020–2030 ($MILLION)
FIGURE 45.SOUTH AFRICA CANOPY BED MARKET REVENUE, 2020–2030 ($MILLION)
FIGURE 46.TURKEY CANOPY BED MARKET REVENUE, 2020–2030 ($MILLION)
FIGURE 47.REST OF LAMEA CANOPY BED MARKET REVENUE, 2020–2030 ($MILLION)
FIGURE 48.TOP PLAYER POSITIONING
FIGURE 49.PRODUCT MAPPING OF TOP 10 KEY PLAYERS
FIGURE 50.COMPETITIVE DASHBOARD OF TOP 10 KEY PLAYERS
FIGURE 51.COMPETITIVE HEATMAP OF TOP 10 KEY PLAYERS


The prominent players operating in the canopy bed market have adopted developmental strategies such as product launch to fuel the demand for canopy beds. In addition, they have emphasized on continuous innovations in their products to maintain a strong foothold in the market and to boost the canopy bed demand globally.

In addition, rise in population and urbanization propel the growth of the global canopy bed market. Moreover, increase in disposable income and improvement in standard of living provide various opportunities to manufacturers in the canopy bed market. Hence, to maintain foothold in the market, manufacturers are adopting innovation in production of furniture, including canopy bed. These innovative ideas include attractive designs and use of strong, durable, and eco-friendly materials. 

Furthermore, majority of canopy bed manufacturers are expanding their business by shifting their preference toward online platform. As through online platforms, manufacturers can sell their products by reducing distribution costs out of their profit margins. 

However, increase in cost of raw materials is projected to hamper the growth of the canopy bed market during the forecast period.

PURCHASE OPTIONS

Call or Email us

U.S.-Canada Toll-free: +1-800-792-5285
Int'l : +1-503-894-6022
Europe : +44-845-528-1300
Email : help@alliedmarketresearch.com
 
FREQUENTLY ASKED QUESTIONS?

A. The global canopy bed market size is projected to reach $8.4 billion by 2030.

A. The global canopy bed market is projected to register a CAGR of 3.2% from 2021 to 2030.

A. You can raise the query to our sales team, and they will get back to you with the sample for the canopy bed market report.

A. The global canopy bed market is segmented into product type, end user, distribution channel, and region.

A. 2020 was considered as the base year in the canopy bed market report.

A. The top companies in the canopy bed market AFK Furniture, Amish Furniture Factory, Benicia Foundry & Iron Works, Bernhardt Furniture Company, Charles P. Rogers, DHP Furniture, Inspire Q, The Four Poster Bed Company, TurnPost, and itahome.

A. North America market holds the maximum market share of the Canopy Bed Market.

A. The canopy bed market is rapidly returning to its normal stage, countersigning a steady increasing demand, majorly from the hospitality industry.

Looking for Customization?

 Customization Request

Have a Question?

 Speak with Analyst

Any Confusion?

 Inquire Before Buying

Have a glance of the Report

  Request Sample
RELATED TAGS

Purchase Full Report of
Canopy Bed Market

Start reading instantly.
This Report and over 67,068+ more Reports, Available with Avenue Library. T&C*.

  • Online Only
  • $3,712
  • Online cloud access only
  • Restricted print, copy, paste & download
  • Read only
  • Free industry update
    (Within 180 days)
  • Free report update in next update cycle
    (Aug 2022 - Aug 2023)
  • Data Pack
  • $4,125
  • Restricted to one authorized user
  • One print only
  • Available in
    Excel
  • Free industry update
    (Within 180 days)
  •   Free report update in next update cycle
    (Aug 2022 - Aug 2023)
  • Single User
  • $5,769
  • Restricted to one authorized user
  • One print only
  • Available in
    PDF
  • Free industry update
    (Within 180 days)
  •   Free report update in next update cycle
    (Aug 2022 - Aug 2023)
  • Five Users
  • $6,929
  • Limited to five authorized users
  • Print upto five copies
  • Available in
    PDF
  • Free industry update
    (Within 180 days)
  •   Free report update in next update cycle
    (Aug 2022 - Aug 2023)
  • Enterprise
    License/PDF

  • $10,663
  • Unlimited
    within
    company/enterprise
  • Available in Excel & PDF
  • Free industry update
    (Within 180 days)
  •   Free report update in next update cycle
    (Aug 2022 - Aug 2023)
  • Library
    Membership

  • $999 $ 1,175
    Per User/ Per month/ Billed annually
  • Published Content
    E-access
  • Company Profiles
    E-access
  • Newly Added Content Access
  • 10 PDF
    Downloads
  • 5 Excel Data
    Pack Downloads
  • 250 Company Profiles PDF Downloads
  • Buy Now

*Taxes/Fees, if applicable will be added during checkout. All prices in USD

RELATED REPORTS
 

Why Allied Market Research?


Infallible Methodology

To ensure high-level data integrity, accurate analysis, and impeccable forecasts

Analyst Support

For complete satisfaction

Customization

On-demand customization of scope of the report to exactly meet your needs

TARGETED MARKET VIEW

Targeted market view to provide pertinent information and save time of readers

Get fresh content delivered

Get insights on topics that are crucial for your business. Stay abreast of your interest areas.

Get Industry Data Alerts

Why Allied Market Research?

Infallible Methodology

To ensure high-level data integrity, accurate analysis, and impeccable forecasts

Analyst Support

For complete satisfaction

Customization

On-demand customization of scope of the report to exactly meet your needs

TARGETED MARKET VIEW

Targeted market view to provide pertinent information and save time of readers