0
2023
Carotenoids Market

Carotenoids Market

by Product (Astaxanthin, Capsanthin, Lutein, Beta-carotene, Lycopene, Others), by Source (Natural, Synthetic), by Application (Animal Feed, Human Food, Dietary Supplement, Others): Global Opportunity Analysis and Industry Forecast, 2021-2031

Report Code: A04670
Mar 2023 | Pages: 310
Tables: 136
Charts: 65
  • Formats*:

  • pdf

    Single User License, Five User
    License & Enterprise User License

  • xls

    Data Pack Excel License

  • ppt

    It comes with the additional cost
    of $2500.00 contact sales.


The global carotenoids market size was valued at $1.8 billion in 2021 and is projected to reach $2.7 billion by 2031, growing at a CAGR of 3.9% from 2022 to 2031.
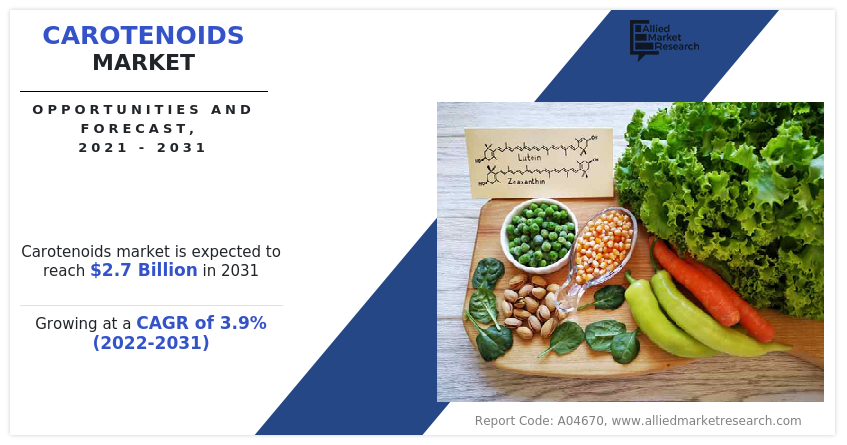
The market is expanding as a result of the increased use of carotenoids as a food coloring and nutritional supplements due to their antioxidant benefits and vitamins, as well as significant R&D efforts to accelerate the production of high-quality carotenoids.

Carotenoids Market

The carotenoids market is segmented into Product, Source, and Application.

The senior citizen segment constitutes a major portion of the population in the developed world and is the largest user of preventive and predictive medication. Health problems faced by the geriatric population such as vision damage is often associated with insufficient intake of vitamins. This is anticipated to boost the demand for carotenoids, thereby, driving market growth. In addition, the rise in demand for natural colorants and growth in end-user applications further drive the global carotenoids market growth.

According to the Department of Economic and Social Affairs, the global population aged 60 years was 962 million in 2017, which is expected to double by 2050, reaching nearly 2.1 billion. The senior citizen segment constitutes a major portion of the population in the developed world and is the largest user of preventive and predictive medication. Health problems faced by the older population such as vision damage is often associated with insufficient intake of vitamins. This is anticipated to boost the demand for carotenoids, thereby driving the growth of the carotenoids industry.

Despite the fact that carotenoids provide a number of health advantages, their usage is prohibited in many nations due to strong regulatory control. For instance, the U.S. Food and Drug Administration (USDA) has authorized astaxanthin as a food color only for particular usage in animal and fish meals. Lycopene is widely used as a food coloring agent. It is produced preferably from tomatoes. Moreover, annatto is used to give color to meals and drinks with neutral pH, such as flavored milk and drinks, but not to those with low pH due to precipitation. Its usage is more limited in European nations than it is in the U.S. as a food colorant. The expansion of the worldwide market for carotenoids is thus hampered by strict regulatory and approval standards.

Consumers, these days, are looking for food and food ingredients that address specific health concerns. Thus, demand for naturally fortified food & beverages is on the increase as customers have become aware of the advantages of vitamins and cell reinforcement. Natural food colors obtained from carotenoids are being widely adopted by the food processing industry. Carotenoids such as lycopene offer a credible option for pink, red, and orange tints at different pH and temperatures. Similarly, beta-carotene is the preferred choice for yellow/orange tones for manufacturers in human food, dietary supplements, and cosmetic products as it also grants various medical advantages.

Aquaculture is a rapidly growing industry across the globe, which comprises the cultivation of various freshwater and marine species of finfish, mollusks, ornamental fish, and shellfish. By 2020, up to 20% of the global production of fish will be based on aquaculture. Thus, appropriately formulated feeds would play a significant part in a successful aquaculture market. Pigmentation is one of the significant quality attributes of the aquatic animal for consumer acceptability as consumers subconsciously relate product color to nutritive value, healthiness, freshness, and taste. Thus, carotenoid is anticipated to play a major role in commercial aquaculture, thereby driving the market growth during the carotenoids market forecast

According to the market analysis, the global carotenoids market is segmented into product, source application, and region. Based on product, the market is divided into astaxanthin, capsanthin, lutein, beta-carotene, lycopene, and others. Based on source, the market is divided into natural and synthetic. Based on application, the market is divided into animal feed, human food, dietary supplement, and others. Region-wise, the market is analyzed across North America (the U.S., Canada, and Mexico), Europe (Germany, France, Italy, Spain, and the rest of Europe), Asia-Pacific (China, Japan, India, South Korea, Indonesia, and rest of Asia-Pacific), and LAMEA (Brazil, South Africa, Saudi Arabia, Argentina, and rest of LAMEA).
Carotenoids Market

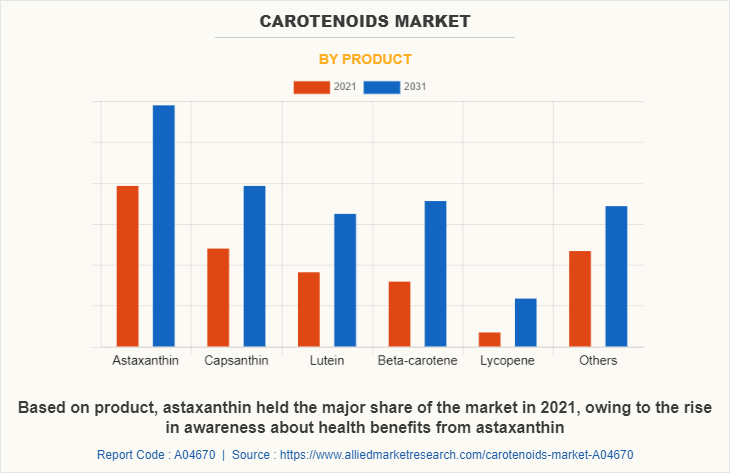
In 2021, astaxanthin accounted for the highest market share in the market in terms of value. Astaxanthin, which was earlier used only for imparting a rich pink color to farmed salmon, has recently gained attention in the dietary supplement for joint, skin, and eye health. An increase in spending on personal care and cosmetic products is growing awareness regarding natural ingredients, which is expected to drive the demand for algae-based astaxanthin. Furthermore, numerous health benefits such as maintenance of skin glow, brain health improvement, and healthy vision drive customer preference toward algae-based astaxanthin products, thus supporting the growth of the global market. In addition, changes in consumer preference have forced various wellness spa service providers and personal care & cosmetic manufacturers to develop and produce astaxanthin-based products. In addition, the approval of the FDA for the application of astaxanthin as a color additive in fish and animal food applications boosts the carotenoids market demand.
Carotenoids Market

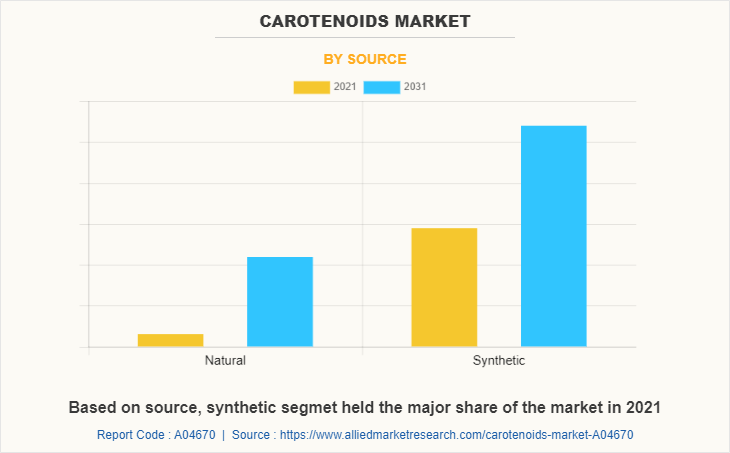
By source, the synthetic segment held the major carotenoids market share. The penetration of synthetically manufactured carotenoids has increased as a result of lower pricing. Nonetheless, due to rising customer desire for goods with organically derived ingredients, it is projected that this category will develop slowly over the course of the forecast period.
Carotenoids Market

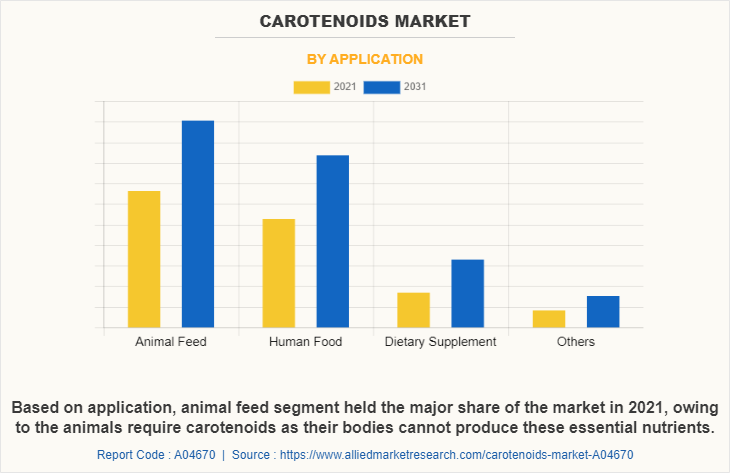
In 2021, animal feed was the prominent segment and accounted for the highest share of the global carotenoids market. Dietary supplements application witnessed significant gains and is expected to grow at the highest CAGR during the forecast period owing to a rise in health consciousness and changes in the lifestyles of the consumers.
Carotenoids Market

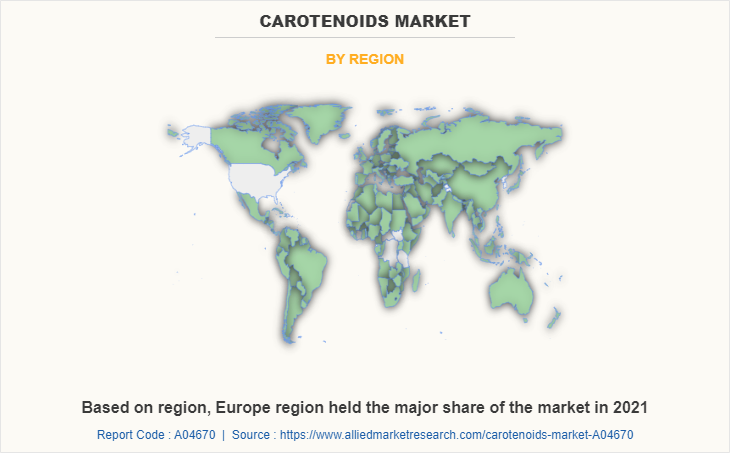
In 2021, Europe was estimated to be the largest market for carotenoids and is projected to witness steady revenue growth from 2022 to 2031 owing to the large animal feed industry and the rise in demand for health supplements. Moreover, the highly established cosmetics industry owing to the presence of key manufacturers such as Unilever, Beiersdorf, L'Oral, and Henkel, is anticipated to supplement the growth of the carotenoids market in the region.

The key players in the market have focused on acquisitions, collaborations, and expansions as their key strategies to gain a significant share in the market. Some of the major players analyzed in this report are BASF SE, Koninklijke DSM N.V., Chr. Hansen A/S, FMC Corporation, Cyanotech Corporation, Kemin Industries Inc., DDW The Colour House, Döhler Group, Allied Biotech Corporation, and Excelvite.

Key Benefits For Stakeholders

  • This report provides a quantitative analysis of the carotenoids market segmntation, current trends, estimations, and dynamics of the carotenoids market analysis from 2021 to 2031 to identify the prevailing carotenoids market opportunities.
  • Market research is offered along with information related to key drivers, restraints, and opportunities.
  • Porter's five forces analysis highlights the potency of buyers and suppliers to enable stakeholders to make profit-oriented business decisions and strengthen their supplier-buyer network.
  • An in-depth analysis of the carotenoids market segmentation assists to determine the prevailing market opportunities.
  • Major countries in each region are mapped according to their revenue contribution to the global market.
  • Market player positioning facilitates benchmarking and provides a clear understanding of the present position of the market players.
  • The report includes an analysis of the regional as well as global carotenoids market trends, key players, market segments, application areas, and market growth strategies.

Carotenoids Market Report Highlights

Aspects Details
Market Size By 2031 USD 2.7 billion
Growth Rate CAGR of 3.9%
Forecast period 2021 - 2031
Report Pages 310
By Product
  • Lutein
  • Beta-carotene
  • Lycopene
  • Others
  • Astaxanthin
  • Capsanthin
By Source
  • Natural
  • Synthetic
By Application
  • Animal Feed
  • Human Food
  • Dietary Supplement
  • Others
By Region
  • North America  (U.S., Canada, Mexico)
  • Europe  (UK, Germany, France, Italy, Spain, Rest of Europe)
  • Asia-Pacific  (China, India, Japan, Indonesia, South Korea, Rest of Asia-Pacific)
  • LAMEA  (Brazil, Argentina, South Africa, Saudi Arabia, Rest of LAMEA)
Key Market Players DDW, Inc., Dohler Group, Kemin Industries, Inc., ExcelVite Sdn. Bhd., Allied Biotech Corporation, BASF SE, Cyanotech Corporation, Koninklijke DSM N.V., Divis Laboratories Limited, Chr. Hansen Holding A/S

Analyst Review

Based on the interviews of various top-level CXOs of leading companies, health benefits associated with carotenoids has led to their increased application in animal feed, human food, dietary supplement, cosmetics, pharmaceuticals, and the aquaculture industry. For instance, carotenoids as a preventive healthcare and nutraceuticals have led to their higher consumption of human food and dietary supplement. Changes in lifestyle, food preferences, and increase in awareness have led to the growth in demand for natural colors in food processing, beverages, and cosmetics industry, which is projected to open new avenues for carotenoid manufacturers. CXOs are optimistic about the growth of the carotenoid market in Asia-Pacific. Owing to the emergence of massive Chinese manufacturers with high-quality carotenoid products, products across all types of formulations and origins have seen a big drop in price. Rapid economic growth, technological advancements, industrial growth, and low cost of production in countries such as China and India are further anticipated to drive market growth. However, stringent regulations on the use of carotenoids in human food, threats of adulteration, and higher cost of naturally sourced carotenoids as compared to synthetic carotenoids hamper the growth of the market.

 
  • CHAPTER 1: INTRODUCTION

    • 1.1. Report description

    • 1.2. Key market segments

    • 1.3. Key benefits to the stakeholders

    • 1.4. Research Methodology

      • 1.4.1. Primary research

      • 1.4.2. Secondary research

      • 1.4.3. Analyst tools and models

  • CHAPTER 2: EXECUTIVE SUMMARY

    • 2.1. CXO Perspective

  • CHAPTER 3: MARKET OVERVIEW

    • 3.1. Market definition and scope

    • 3.2. Key findings

      • 3.2.1. Top impacting factors

      • 3.2.2. Top investment pockets

    • 3.3. Porter’s five forces analysis

      • 3.3.1. Bargaining power of suppliers

      • 3.3.2. Bargaining power of buyers

      • 3.3.3. Threat of substitutes

      • 3.3.4. Threat of new entrants

      • 3.3.5. Intensity of rivalry

    • 3.4. Market dynamics

      • 3.4.1. Drivers

        • 3.4.1.1. Increase in demand for dietary supplements from an older population
        • 3.4.1.2. Growth in end-user applications
        • 3.4.1.3. Rise in Demand for natural colorants

      • 3.4.2. Restraints

        • 3.4.2.1. Stringent regulatory and approval norms

      • 3.4.3. Opportunities

        • 3.4.3.1. Increase in use of carotenoid in aquaculture

    • 3.5. COVID-19 Impact Analysis on the market

  • CHAPTER 4: CAROTENOIDS MARKET, BY PRODUCT

    • 4.1. Overview

      • 4.1.1. Market size and forecast

    • 4.2. Astaxanthin

      • 4.2.1. Key market trends, growth factors and opportunities

      • 4.2.2. Market size and forecast, by region

      • 4.2.3. Market share analysis by country

    • 4.3. Capsanthin

      • 4.3.1. Key market trends, growth factors and opportunities

      • 4.3.2. Market size and forecast, by region

      • 4.3.3. Market share analysis by country

    • 4.4. Lutein

      • 4.4.1. Key market trends, growth factors and opportunities

      • 4.4.2. Market size and forecast, by region

      • 4.4.3. Market share analysis by country

    • 4.5. Beta-carotene

      • 4.5.1. Key market trends, growth factors and opportunities

      • 4.5.2. Market size and forecast, by region

      • 4.5.3. Market share analysis by country

    • 4.6. Lycopene

      • 4.6.1. Key market trends, growth factors and opportunities

      • 4.6.2. Market size and forecast, by region

      • 4.6.3. Market share analysis by country

    • 4.7. Others

      • 4.7.1. Key market trends, growth factors and opportunities

      • 4.7.2. Market size and forecast, by region

      • 4.7.3. Market share analysis by country

  • CHAPTER 5: CAROTENOIDS MARKET, BY SOURCE

    • 5.1. Overview

      • 5.1.1. Market size and forecast

    • 5.2. Natural

      • 5.2.1. Key market trends, growth factors and opportunities

      • 5.2.2. Market size and forecast, by region

      • 5.2.3. Market share analysis by country

    • 5.3. Synthetic

      • 5.3.1. Key market trends, growth factors and opportunities

      • 5.3.2. Market size and forecast, by region

      • 5.3.3. Market share analysis by country

  • CHAPTER 6: CAROTENOIDS MARKET, BY APPLICATION

    • 6.1. Overview

      • 6.1.1. Market size and forecast

    • 6.2. Animal Feed

      • 6.2.1. Key market trends, growth factors and opportunities

      • 6.2.2. Market size and forecast, by region

      • 6.2.3. Market share analysis by country

    • 6.3. Human Food

      • 6.3.1. Key market trends, growth factors and opportunities

      • 6.3.2. Market size and forecast, by region

      • 6.3.3. Market share analysis by country

    • 6.4. Dietary Supplement

      • 6.4.1. Key market trends, growth factors and opportunities

      • 6.4.2. Market size and forecast, by region

      • 6.4.3. Market share analysis by country

    • 6.5. Others

      • 6.5.1. Key market trends, growth factors and opportunities

      • 6.5.2. Market size and forecast, by region

      • 6.5.3. Market share analysis by country

  • CHAPTER 7: CAROTENOIDS MARKET, BY REGION

    • 7.1. Overview

      • 7.1.1. Market size and forecast By Region

    • 7.2. North America

      • 7.2.1. Key trends and opportunities

      • 7.2.2. Market size and forecast, by Product

      • 7.2.3. Market size and forecast, by Source

      • 7.2.4. Market size and forecast, by Application

      • 7.2.5. Market size and forecast, by country

        • 7.2.5.1. U.S.
          • 7.2.5.1.1. Key market trends, growth factors and opportunities
          • 7.2.5.1.2. Market size and forecast, by Product
          • 7.2.5.1.3. Market size and forecast, by Source
          • 7.2.5.1.4. Market size and forecast, by Application
        • 7.2.5.2. Canada
          • 7.2.5.2.1. Key market trends, growth factors and opportunities
          • 7.2.5.2.2. Market size and forecast, by Product
          • 7.2.5.2.3. Market size and forecast, by Source
          • 7.2.5.2.4. Market size and forecast, by Application
        • 7.2.5.3. Mexico
          • 7.2.5.3.1. Key market trends, growth factors and opportunities
          • 7.2.5.3.2. Market size and forecast, by Product
          • 7.2.5.3.3. Market size and forecast, by Source
          • 7.2.5.3.4. Market size and forecast, by Application
    • 7.3. Europe

      • 7.3.1. Key trends and opportunities

      • 7.3.2. Market size and forecast, by Product

      • 7.3.3. Market size and forecast, by Source

      • 7.3.4. Market size and forecast, by Application

      • 7.3.5. Market size and forecast, by country

        • 7.3.5.1. UK
          • 7.3.5.1.1. Key market trends, growth factors and opportunities
          • 7.3.5.1.2. Market size and forecast, by Product
          • 7.3.5.1.3. Market size and forecast, by Source
          • 7.3.5.1.4. Market size and forecast, by Application
        • 7.3.5.2. Germany
          • 7.3.5.2.1. Key market trends, growth factors and opportunities
          • 7.3.5.2.2. Market size and forecast, by Product
          • 7.3.5.2.3. Market size and forecast, by Source
          • 7.3.5.2.4. Market size and forecast, by Application
        • 7.3.5.3. France
          • 7.3.5.3.1. Key market trends, growth factors and opportunities
          • 7.3.5.3.2. Market size and forecast, by Product
          • 7.3.5.3.3. Market size and forecast, by Source
          • 7.3.5.3.4. Market size and forecast, by Application
        • 7.3.5.4. Italy
          • 7.3.5.4.1. Key market trends, growth factors and opportunities
          • 7.3.5.4.2. Market size and forecast, by Product
          • 7.3.5.4.3. Market size and forecast, by Source
          • 7.3.5.4.4. Market size and forecast, by Application
        • 7.3.5.5. Spain
          • 7.3.5.5.1. Key market trends, growth factors and opportunities
          • 7.3.5.5.2. Market size and forecast, by Product
          • 7.3.5.5.3. Market size and forecast, by Source
          • 7.3.5.5.4. Market size and forecast, by Application
        • 7.3.5.6. Rest of Europe
          • 7.3.5.6.1. Key market trends, growth factors and opportunities
          • 7.3.5.6.2. Market size and forecast, by Product
          • 7.3.5.6.3. Market size and forecast, by Source
          • 7.3.5.6.4. Market size and forecast, by Application
    • 7.4. Asia-Pacific

      • 7.4.1. Key trends and opportunities

      • 7.4.2. Market size and forecast, by Product

      • 7.4.3. Market size and forecast, by Source

      • 7.4.4. Market size and forecast, by Application

      • 7.4.5. Market size and forecast, by country

        • 7.4.5.1. China
          • 7.4.5.1.1. Key market trends, growth factors and opportunities
          • 7.4.5.1.2. Market size and forecast, by Product
          • 7.4.5.1.3. Market size and forecast, by Source
          • 7.4.5.1.4. Market size and forecast, by Application
        • 7.4.5.2. India
          • 7.4.5.2.1. Key market trends, growth factors and opportunities
          • 7.4.5.2.2. Market size and forecast, by Product
          • 7.4.5.2.3. Market size and forecast, by Source
          • 7.4.5.2.4. Market size and forecast, by Application
        • 7.4.5.3. Japan
          • 7.4.5.3.1. Key market trends, growth factors and opportunities
          • 7.4.5.3.2. Market size and forecast, by Product
          • 7.4.5.3.3. Market size and forecast, by Source
          • 7.4.5.3.4. Market size and forecast, by Application
        • 7.4.5.4. Indonesia
          • 7.4.5.4.1. Key market trends, growth factors and opportunities
          • 7.4.5.4.2. Market size and forecast, by Product
          • 7.4.5.4.3. Market size and forecast, by Source
          • 7.4.5.4.4. Market size and forecast, by Application
        • 7.4.5.5. South Korea
          • 7.4.5.5.1. Key market trends, growth factors and opportunities
          • 7.4.5.5.2. Market size and forecast, by Product
          • 7.4.5.5.3. Market size and forecast, by Source
          • 7.4.5.5.4. Market size and forecast, by Application
        • 7.4.5.6. Rest of Asia-Pacific
          • 7.4.5.6.1. Key market trends, growth factors and opportunities
          • 7.4.5.6.2. Market size and forecast, by Product
          • 7.4.5.6.3. Market size and forecast, by Source
          • 7.4.5.6.4. Market size and forecast, by Application
    • 7.5. LAMEA

      • 7.5.1. Key trends and opportunities

      • 7.5.2. Market size and forecast, by Product

      • 7.5.3. Market size and forecast, by Source

      • 7.5.4. Market size and forecast, by Application

      • 7.5.5. Market size and forecast, by country

        • 7.5.5.1. Brazil
          • 7.5.5.1.1. Key market trends, growth factors and opportunities
          • 7.5.5.1.2. Market size and forecast, by Product
          • 7.5.5.1.3. Market size and forecast, by Source
          • 7.5.5.1.4. Market size and forecast, by Application
        • 7.5.5.2. Argentina
          • 7.5.5.2.1. Key market trends, growth factors and opportunities
          • 7.5.5.2.2. Market size and forecast, by Product
          • 7.5.5.2.3. Market size and forecast, by Source
          • 7.5.5.2.4. Market size and forecast, by Application
        • 7.5.5.3. South Africa
          • 7.5.5.3.1. Key market trends, growth factors and opportunities
          • 7.5.5.3.2. Market size and forecast, by Product
          • 7.5.5.3.3. Market size and forecast, by Source
          • 7.5.5.3.4. Market size and forecast, by Application
        • 7.5.5.4. Saudi Arabia
          • 7.5.5.4.1. Key market trends, growth factors and opportunities
          • 7.5.5.4.2. Market size and forecast, by Product
          • 7.5.5.4.3. Market size and forecast, by Source
          • 7.5.5.4.4. Market size and forecast, by Application
        • 7.5.5.5. Rest of LAMEA
          • 7.5.5.5.1. Key market trends, growth factors and opportunities
          • 7.5.5.5.2. Market size and forecast, by Product
          • 7.5.5.5.3. Market size and forecast, by Source
          • 7.5.5.5.4. Market size and forecast, by Application
  • CHAPTER 8: COMPETITIVE LANDSCAPE

    • 8.1. Introduction

    • 8.2. Top winning strategies

    • 8.3. Product Mapping of Top 10 Player

    • 8.4. Competitive Dashboard

    • 8.5. Competitive Heatmap

    • 8.6. Top player positioning, 2021

  • CHAPTER 9: COMPANY PROFILES

    • 9.1. BASF SE

      • 9.1.1. Company overview

      • 9.1.2. Key Executives

      • 9.1.3. Company snapshot

      • 9.1.4. Operating business segments

      • 9.1.5. Product portfolio

      • 9.1.6. Business performance

    • 9.2. Koninklijke DSM N.V.

      • 9.2.1. Company overview

      • 9.2.2. Key Executives

      • 9.2.3. Company snapshot

      • 9.2.4. Operating business segments

      • 9.2.5. Product portfolio

    • 9.3. Chr. Hansen Holding A/S

      • 9.3.1. Company overview

      • 9.3.2. Key Executives

      • 9.3.3. Company snapshot

      • 9.3.4. Operating business segments

      • 9.3.5. Product portfolio

      • 9.3.6. Business performance

    • 9.4. Divis Laboratories Limited

      • 9.4.1. Company overview

      • 9.4.2. Key Executives

      • 9.4.3. Company snapshot

      • 9.4.4. Operating business segments

      • 9.4.5. Product portfolio

      • 9.4.6. Business performance

      • 9.4.7. Key strategic moves and developments

    • 9.5. Cyanotech Corporation

      • 9.5.1. Company overview

      • 9.5.2. Key Executives

      • 9.5.3. Company snapshot

      • 9.5.4. Operating business segments

      • 9.5.5. Product portfolio

      • 9.5.6. Business performance

      • 9.5.7. Key strategic moves and developments

    • 9.6. Kemin Industries, Inc.

      • 9.6.1. Company overview

      • 9.6.2. Key Executives

      • 9.6.3. Company snapshot

      • 9.6.4. Operating business segments

      • 9.6.5. Product portfolio

      • 9.6.6. Key strategic moves and developments

    • 9.7. DDW, Inc.

      • 9.7.1. Company overview

      • 9.7.2. Key Executives

      • 9.7.3. Company snapshot

      • 9.7.4. Operating business segments

      • 9.7.5. Product portfolio

    • 9.8. Dohler Group

      • 9.8.1. Company overview

      • 9.8.2. Key Executives

      • 9.8.3. Company snapshot

      • 9.8.4. Operating business segments

      • 9.8.5. Product portfolio

    • 9.9. Allied Biotech Corporation

      • 9.9.1. Company overview

      • 9.9.2. Key Executives

      • 9.9.3. Company snapshot

      • 9.9.4. Operating business segments

      • 9.9.5. Product portfolio

    • 9.10. ExcelVite Sdn. Bhd.

      • 9.10.1. Company overview

      • 9.10.2. Key Executives

      • 9.10.3. Company snapshot

      • 9.10.4. Operating business segments

      • 9.10.5. Product portfolio

      • 9.10.6. Key strategic moves and developments

  • LIST OF TABLES

  • TABLE 01. GLOBAL CAROTENOIDS MARKET, BY PRODUCT, 2021-2031 ($MILLION)
    TABLE 02. CAROTENOIDS MARKET FOR ASTAXANTHIN, BY REGION, 2021-2031 ($MILLION)
    TABLE 03. CAROTENOIDS MARKET FOR CAPSANTHIN, BY REGION, 2021-2031 ($MILLION)
    TABLE 04. CAROTENOIDS MARKET FOR LUTEIN, BY REGION, 2021-2031 ($MILLION)
    TABLE 05. CAROTENOIDS MARKET FOR BETA-CAROTENE, BY REGION, 2021-2031 ($MILLION)
    TABLE 06. CAROTENOIDS MARKET FOR LYCOPENE, BY REGION, 2021-2031 ($MILLION)
    TABLE 07. CAROTENOIDS MARKET FOR OTHERS, BY REGION, 2021-2031 ($MILLION)
    TABLE 08. GLOBAL CAROTENOIDS MARKET, BY SOURCE, 2021-2031 ($MILLION)
    TABLE 09. CAROTENOIDS MARKET FOR NATURAL, BY REGION, 2021-2031 ($MILLION)
    TABLE 10. CAROTENOIDS MARKET FOR SYNTHETIC, BY REGION, 2021-2031 ($MILLION)
    TABLE 11. GLOBAL CAROTENOIDS MARKET, BY APPLICATION, 2021-2031 ($MILLION)
    TABLE 12. CAROTENOIDS MARKET FOR ANIMAL FEED, BY REGION, 2021-2031 ($MILLION)
    TABLE 13. CAROTENOIDS MARKET FOR HUMAN FOOD, BY REGION, 2021-2031 ($MILLION)
    TABLE 14. CAROTENOIDS MARKET FOR DIETARY SUPPLEMENT, BY REGION, 2021-2031 ($MILLION)
    TABLE 15. CAROTENOIDS MARKET FOR OTHERS, BY REGION, 2021-2031 ($MILLION)
    TABLE 16. CAROTENOIDS MARKET, BY REGION, 2021-2031 ($MILLION)
    TABLE 17. NORTH AMERICA CAROTENOIDS MARKET, BY PRODUCT, 2021-2031 ($MILLION)
    TABLE 18. NORTH AMERICA CAROTENOIDS MARKET, BY SOURCE, 2021-2031 ($MILLION)
    TABLE 19. NORTH AMERICA CAROTENOIDS MARKET, BY APPLICATION, 2021-2031 ($MILLION)
    TABLE 20. NORTH AMERICA CAROTENOIDS MARKET, BY COUNTRY, 2021-2031 ($MILLION)
    TABLE 21. U.S. CAROTENOIDS MARKET, BY PRODUCT, 2021-2031 ($MILLION)
    TABLE 22. U.S. CAROTENOIDS MARKET, BY SOURCE, 2021-2031 ($MILLION)
    TABLE 23. U.S. CAROTENOIDS MARKET, BY APPLICATION, 2021-2031 ($MILLION)
    TABLE 24. CANADA CAROTENOIDS MARKET, BY PRODUCT, 2021-2031 ($MILLION)
    TABLE 25. CANADA CAROTENOIDS MARKET, BY SOURCE, 2021-2031 ($MILLION)
    TABLE 26. CANADA CAROTENOIDS MARKET, BY APPLICATION, 2021-2031 ($MILLION)
    TABLE 27. MEXICO CAROTENOIDS MARKET, BY PRODUCT, 2021-2031 ($MILLION)
    TABLE 28. MEXICO CAROTENOIDS MARKET, BY SOURCE, 2021-2031 ($MILLION)
    TABLE 29. MEXICO CAROTENOIDS MARKET, BY APPLICATION, 2021-2031 ($MILLION)
    TABLE 30. EUROPE CAROTENOIDS MARKET, BY PRODUCT, 2021-2031 ($MILLION)
    TABLE 31. EUROPE CAROTENOIDS MARKET, BY SOURCE, 2021-2031 ($MILLION)
    TABLE 32. EUROPE CAROTENOIDS MARKET, BY APPLICATION, 2021-2031 ($MILLION)
    TABLE 33. EUROPE CAROTENOIDS MARKET, BY COUNTRY, 2021-2031 ($MILLION)
    TABLE 34. UK CAROTENOIDS MARKET, BY PRODUCT, 2021-2031 ($MILLION)
    TABLE 35. UK CAROTENOIDS MARKET, BY SOURCE, 2021-2031 ($MILLION)
    TABLE 36. UK CAROTENOIDS MARKET, BY APPLICATION, 2021-2031 ($MILLION)
    TABLE 37. GERMANY CAROTENOIDS MARKET, BY PRODUCT, 2021-2031 ($MILLION)
    TABLE 38. GERMANY CAROTENOIDS MARKET, BY SOURCE, 2021-2031 ($MILLION)
    TABLE 39. GERMANY CAROTENOIDS MARKET, BY APPLICATION, 2021-2031 ($MILLION)
    TABLE 40. FRANCE CAROTENOIDS MARKET, BY PRODUCT, 2021-2031 ($MILLION)
    TABLE 41. FRANCE CAROTENOIDS MARKET, BY SOURCE, 2021-2031 ($MILLION)
    TABLE 42. FRANCE CAROTENOIDS MARKET, BY APPLICATION, 2021-2031 ($MILLION)
    TABLE 43. ITALY CAROTENOIDS MARKET, BY PRODUCT, 2021-2031 ($MILLION)
    TABLE 44. ITALY CAROTENOIDS MARKET, BY SOURCE, 2021-2031 ($MILLION)
    TABLE 45. ITALY CAROTENOIDS MARKET, BY APPLICATION, 2021-2031 ($MILLION)
    TABLE 46. SPAIN CAROTENOIDS MARKET, BY PRODUCT, 2021-2031 ($MILLION)
    TABLE 47. SPAIN CAROTENOIDS MARKET, BY SOURCE, 2021-2031 ($MILLION)
    TABLE 48. SPAIN CAROTENOIDS MARKET, BY APPLICATION, 2021-2031 ($MILLION)
    TABLE 49. REST OF EUROPE CAROTENOIDS MARKET, BY PRODUCT, 2021-2031 ($MILLION)
    TABLE 50. REST OF EUROPE CAROTENOIDS MARKET, BY SOURCE, 2021-2031 ($MILLION)
    TABLE 51. REST OF EUROPE CAROTENOIDS MARKET, BY APPLICATION, 2021-2031 ($MILLION)
    TABLE 52. ASIA-PACIFIC CAROTENOIDS MARKET, BY PRODUCT, 2021-2031 ($MILLION)
    TABLE 53. ASIA-PACIFIC CAROTENOIDS MARKET, BY SOURCE, 2021-2031 ($MILLION)
    TABLE 54. ASIA-PACIFIC CAROTENOIDS MARKET, BY APPLICATION, 2021-2031 ($MILLION)
    TABLE 55. ASIA-PACIFIC CAROTENOIDS MARKET, BY COUNTRY, 2021-2031 ($MILLION)
    TABLE 56. CHINA CAROTENOIDS MARKET, BY PRODUCT, 2021-2031 ($MILLION)
    TABLE 57. CHINA CAROTENOIDS MARKET, BY SOURCE, 2021-2031 ($MILLION)
    TABLE 58. CHINA CAROTENOIDS MARKET, BY APPLICATION, 2021-2031 ($MILLION)
    TABLE 59. INDIA CAROTENOIDS MARKET, BY PRODUCT, 2021-2031 ($MILLION)
    TABLE 60. INDIA CAROTENOIDS MARKET, BY SOURCE, 2021-2031 ($MILLION)
    TABLE 61. INDIA CAROTENOIDS MARKET, BY APPLICATION, 2021-2031 ($MILLION)
    TABLE 62. JAPAN CAROTENOIDS MARKET, BY PRODUCT, 2021-2031 ($MILLION)
    TABLE 63. JAPAN CAROTENOIDS MARKET, BY SOURCE, 2021-2031 ($MILLION)
    TABLE 64. JAPAN CAROTENOIDS MARKET, BY APPLICATION, 2021-2031 ($MILLION)
    TABLE 65. INDONESIA CAROTENOIDS MARKET, BY PRODUCT, 2021-2031 ($MILLION)
    TABLE 66. INDONESIA CAROTENOIDS MARKET, BY SOURCE, 2021-2031 ($MILLION)
    TABLE 67. INDONESIA CAROTENOIDS MARKET, BY APPLICATION, 2021-2031 ($MILLION)
    TABLE 68. SOUTH KOREA CAROTENOIDS MARKET, BY PRODUCT, 2021-2031 ($MILLION)
    TABLE 69. SOUTH KOREA CAROTENOIDS MARKET, BY SOURCE, 2021-2031 ($MILLION)
    TABLE 70. SOUTH KOREA CAROTENOIDS MARKET, BY APPLICATION, 2021-2031 ($MILLION)
    TABLE 71. REST OF ASIA-PACIFIC CAROTENOIDS MARKET, BY PRODUCT, 2021-2031 ($MILLION)
    TABLE 72. REST OF ASIA-PACIFIC CAROTENOIDS MARKET, BY SOURCE, 2021-2031 ($MILLION)
    TABLE 73. REST OF ASIA-PACIFIC CAROTENOIDS MARKET, BY APPLICATION, 2021-2031 ($MILLION)
    TABLE 74. LAMEA CAROTENOIDS MARKET, BY PRODUCT, 2021-2031 ($MILLION)
    TABLE 75. LAMEA CAROTENOIDS MARKET, BY SOURCE, 2021-2031 ($MILLION)
    TABLE 76. LAMEA CAROTENOIDS MARKET, BY APPLICATION, 2021-2031 ($MILLION)
    TABLE 77. LAMEA CAROTENOIDS MARKET, BY COUNTRY, 2021-2031 ($MILLION)
    TABLE 78. BRAZIL CAROTENOIDS MARKET, BY PRODUCT, 2021-2031 ($MILLION)
    TABLE 79. BRAZIL CAROTENOIDS MARKET, BY SOURCE, 2021-2031 ($MILLION)
    TABLE 80. BRAZIL CAROTENOIDS MARKET, BY APPLICATION, 2021-2031 ($MILLION)
    TABLE 81. ARGENTINA CAROTENOIDS MARKET, BY PRODUCT, 2021-2031 ($MILLION)
    TABLE 82. ARGENTINA CAROTENOIDS MARKET, BY SOURCE, 2021-2031 ($MILLION)
    TABLE 83. ARGENTINA CAROTENOIDS MARKET, BY APPLICATION, 2021-2031 ($MILLION)
    TABLE 84. SOUTH AFRICA CAROTENOIDS MARKET, BY PRODUCT, 2021-2031 ($MILLION)
    TABLE 85. SOUTH AFRICA CAROTENOIDS MARKET, BY SOURCE, 2021-2031 ($MILLION)
    TABLE 86. SOUTH AFRICA CAROTENOIDS MARKET, BY APPLICATION, 2021-2031 ($MILLION)
    TABLE 87. SAUDI ARABIA CAROTENOIDS MARKET, BY PRODUCT, 2021-2031 ($MILLION)
    TABLE 88. SAUDI ARABIA CAROTENOIDS MARKET, BY SOURCE, 2021-2031 ($MILLION)
    TABLE 89. SAUDI ARABIA CAROTENOIDS MARKET, BY APPLICATION, 2021-2031 ($MILLION)
    TABLE 90. REST OF LAMEA CAROTENOIDS MARKET, BY PRODUCT, 2021-2031 ($MILLION)
    TABLE 91. REST OF LAMEA CAROTENOIDS MARKET, BY SOURCE, 2021-2031 ($MILLION)
    TABLE 92. REST OF LAMEA CAROTENOIDS MARKET, BY APPLICATION, 2021-2031 ($MILLION)
    TABLE 93. BASF SE: KEY EXECUTIVES
    TABLE 94. BASF SE: COMPANY SNAPSHOT
    TABLE 95. BASF SE: PRODUCT SEGMENTS
    TABLE 96. BASF SE: PRODUCT PORTFOLIO
    TABLE 97. KONINKLIJKE DSM N.V.: KEY EXECUTIVES
    TABLE 98. KONINKLIJKE DSM N.V.: COMPANY SNAPSHOT
    TABLE 99. KONINKLIJKE DSM N.V.: PRODUCT SEGMENTS
    TABLE 100. KONINKLIJKE DSM N.V.: PRODUCT PORTFOLIO
    TABLE 101. CHR. HANSEN HOLDING A/S: KEY EXECUTIVES
    TABLE 102. CHR. HANSEN HOLDING A/S: COMPANY SNAPSHOT
    TABLE 103. CHR. HANSEN HOLDING A/S: PRODUCT SEGMENTS
    TABLE 104. CHR. HANSEN HOLDING A/S: PRODUCT PORTFOLIO
    TABLE 105. DIVIS LABORATORIES LIMITED: KEY EXECUTIVES
    TABLE 106. DIVIS LABORATORIES LIMITED: COMPANY SNAPSHOT
    TABLE 107. DIVIS LABORATORIES LIMITED: PRODUCT SEGMENTS
    TABLE 108. DIVIS LABORATORIES LIMITED: PRODUCT PORTFOLIO
    TABLE 109. DIVIS LABORATORIES LIMITED: KEY STRATERGIES
    TABLE 110. CYANOTECH CORPORATION: KEY EXECUTIVES
    TABLE 111. CYANOTECH CORPORATION: COMPANY SNAPSHOT
    TABLE 112. CYANOTECH CORPORATION: PRODUCT SEGMENTS
    TABLE 113. CYANOTECH CORPORATION: PRODUCT PORTFOLIO
    TABLE 114. CYANOTECH CORPORATION: KEY STRATERGIES
    TABLE 115. KEMIN INDUSTRIES, INC.: KEY EXECUTIVES
    TABLE 116. KEMIN INDUSTRIES, INC.: COMPANY SNAPSHOT
    TABLE 117. KEMIN INDUSTRIES, INC.: PRODUCT SEGMENTS
    TABLE 118. KEMIN INDUSTRIES, INC.: PRODUCT PORTFOLIO
    TABLE 119. KEMIN INDUSTRIES, INC.: KEY STRATERGIES
    TABLE 120. DDW, INC.: KEY EXECUTIVES
    TABLE 121. DDW, INC.: COMPANY SNAPSHOT
    TABLE 122. DDW, INC.: PRODUCT SEGMENTS
    TABLE 123. DDW, INC.: PRODUCT PORTFOLIO
    TABLE 124. DOHLER GROUP: KEY EXECUTIVES
    TABLE 125. DOHLER GROUP: COMPANY SNAPSHOT
    TABLE 126. DOHLER GROUP: PRODUCT SEGMENTS
    TABLE 127. DOHLER GROUP: PRODUCT PORTFOLIO
    TABLE 128. ALLIED BIOTECH CORPORATION: KEY EXECUTIVES
    TABLE 129. ALLIED BIOTECH CORPORATION: COMPANY SNAPSHOT
    TABLE 130. ALLIED BIOTECH CORPORATION: PRODUCT SEGMENTS
    TABLE 131. ALLIED BIOTECH CORPORATION: PRODUCT PORTFOLIO
    TABLE 132. EXCELVITE SDN. BHD.: KEY EXECUTIVES
    TABLE 133. EXCELVITE SDN. BHD.: COMPANY SNAPSHOT
    TABLE 134. EXCELVITE SDN. BHD.: PRODUCT SEGMENTS
    TABLE 135. EXCELVITE SDN. BHD.: PRODUCT PORTFOLIO
    TABLE 136. EXCELVITE SDN. BHD.: KEY STRATERGIES
  • LIST OF FIGURES

  • FIGURE 01. CAROTENOIDS MARKET, 2021-2031
    FIGURE 02. SEGMENTATION OF CAROTENOIDS MARKET, 2021-2031
    FIGURE 03. TOP INVESTMENT POCKETS IN CAROTENOIDS MARKET (2022-2031)
    FIGURE 04. PORTER FIVE-1
    FIGURE 05. PORTER FIVE-2
    FIGURE 06. PORTER FIVE-3
    FIGURE 07. PORTER FIVE-4
    FIGURE 08. PORTER FIVE-5
    FIGURE 09. DRIVERS, RESTRAINTS AND OPPORTUNITIES: GLOBALCAROTENOIDS MARKET
    FIGURE 10. CAROTENOIDS MARKET, BY PRODUCT, 2021(%)
    FIGURE 11. COMPARATIVE SHARE ANALYSIS OF CAROTENOIDS MARKET FOR ASTAXANTHIN, BY COUNTRY 2021-2031(%)
    FIGURE 12. COMPARATIVE SHARE ANALYSIS OF CAROTENOIDS MARKET FOR CAPSANTHIN, BY COUNTRY 2021-2031(%)
    FIGURE 13. COMPARATIVE SHARE ANALYSIS OF CAROTENOIDS MARKET FOR LUTEIN, BY COUNTRY 2021-2031(%)
    FIGURE 14. COMPARATIVE SHARE ANALYSIS OF CAROTENOIDS MARKET FOR BETA-CAROTENE, BY COUNTRY 2021-2031(%)
    FIGURE 15. COMPARATIVE SHARE ANALYSIS OF CAROTENOIDS MARKET FOR LYCOPENE, BY COUNTRY 2021-2031(%)
    FIGURE 16. COMPARATIVE SHARE ANALYSIS OF CAROTENOIDS MARKET FOR OTHERS, BY COUNTRY 2021-2031(%)
    FIGURE 17. CAROTENOIDS MARKET, BY SOURCE, 2021(%)
    FIGURE 18. COMPARATIVE SHARE ANALYSIS OF CAROTENOIDS MARKET FOR NATURAL, BY COUNTRY 2021-2031(%)
    FIGURE 19. COMPARATIVE SHARE ANALYSIS OF CAROTENOIDS MARKET FOR SYNTHETIC, BY COUNTRY 2021-2031(%)
    FIGURE 20. CAROTENOIDS MARKET, BY APPLICATION, 2021(%)
    FIGURE 21. COMPARATIVE SHARE ANALYSIS OF CAROTENOIDS MARKET FOR ANIMAL FEED, BY COUNTRY 2021-2031(%)
    FIGURE 22. COMPARATIVE SHARE ANALYSIS OF CAROTENOIDS MARKET FOR HUMAN FOOD, BY COUNTRY 2021-2031(%)
    FIGURE 23. COMPARATIVE SHARE ANALYSIS OF CAROTENOIDS MARKET FOR DIETARY SUPPLEMENT, BY COUNTRY 2021-2031(%)
    FIGURE 24. COMPARATIVE SHARE ANALYSIS OF CAROTENOIDS MARKET FOR OTHERS, BY COUNTRY 2021-2031(%)
    FIGURE 25. CAROTENOIDS MARKET BY REGION, 2021
    FIGURE 26. U.S. CAROTENOIDS MARKET, 2021-2031 ($MILLION)
    FIGURE 27. CANADA CAROTENOIDS MARKET, 2021-2031 ($MILLION)
    FIGURE 28. MEXICO CAROTENOIDS MARKET, 2021-2031 ($MILLION)
    FIGURE 29. UK CAROTENOIDS MARKET, 2021-2031 ($MILLION)
    FIGURE 30. GERMANY CAROTENOIDS MARKET, 2021-2031 ($MILLION)
    FIGURE 31. FRANCE CAROTENOIDS MARKET, 2021-2031 ($MILLION)
    FIGURE 32. ITALY CAROTENOIDS MARKET, 2021-2031 ($MILLION)
    FIGURE 33. SPAIN CAROTENOIDS MARKET, 2021-2031 ($MILLION)
    FIGURE 34. REST OF EUROPE CAROTENOIDS MARKET, 2021-2031 ($MILLION)
    FIGURE 35. CHINA CAROTENOIDS MARKET, 2021-2031 ($MILLION)
    FIGURE 36. INDIA CAROTENOIDS MARKET, 2021-2031 ($MILLION)
    FIGURE 37. JAPAN CAROTENOIDS MARKET, 2021-2031 ($MILLION)
    FIGURE 38. INDONESIA CAROTENOIDS MARKET, 2021-2031 ($MILLION)
    FIGURE 39. SOUTH KOREA CAROTENOIDS MARKET, 2021-2031 ($MILLION)
    FIGURE 40. REST OF ASIA-PACIFIC CAROTENOIDS MARKET, 2021-2031 ($MILLION)
    FIGURE 41. BRAZIL CAROTENOIDS MARKET, 2021-2031 ($MILLION)
    FIGURE 42. ARGENTINA CAROTENOIDS MARKET, 2021-2031 ($MILLION)
    FIGURE 43. SOUTH AFRICA CAROTENOIDS MARKET, 2021-2031 ($MILLION)
    FIGURE 44. SAUDI ARABIA CAROTENOIDS MARKET, 2021-2031 ($MILLION)
    FIGURE 45. REST OF LAMEA CAROTENOIDS MARKET, 2021-2031 ($MILLION)
    FIGURE 46. TOP WINNING STRATEGIES, BY YEAR
    FIGURE 47. TOP WINNING STRATEGIES, BY DEVELOPMENT
    FIGURE 48. TOP WINNING STRATEGIES, BY COMPANY
    FIGURE 49. PRODUCT MAPPING OF TOP 10 PLAYERS
    FIGURE 50. COMPETITIVE DASHBOARD
    FIGURE 51. COMPETITIVE HEATMAP: CAROTENOIDS MARKET
    FIGURE 52. TOP PLAYER POSITIONING, 2021
    FIGURE 53. BASF SE: NET SALES, 2020-2022 ($MILLION)
    FIGURE 54. BASF SE: RESEARCH & DEVELOPMENT EXPENDITURE, 2020-2022 ($MILLION)
    FIGURE 55. BASF SE: REVENUE SHARE BY SEGMENT, 2022 (%)
    FIGURE 56. BASF SE: REVENUE SHARE BY REGION, 2022 (%)
    FIGURE 57. CHR. HANSEN HOLDING A/S: RESEARCH & DEVELOPMENT EXPENDITURE, 2019-2021
    FIGURE 58. CHR. HANSEN HOLDING A/S: NET REVENUE, 2019-2021 ($MILLION)
    FIGURE 59. CHR. HANSEN HOLDING A/S: REVENUE SHARE BY SEGMENT, 2021 (%)
    FIGURE 60. CHR. HANSEN HOLDING A/S: REVENUE SHARE BY REGION, 2021 (%)
    FIGURE 61. DIVIS LABORATORIES LIMITED: NET REVENUE, 2019-2021 ($MILLION)
    FIGURE 62. DIVIS LABORATORIES LIMITED: REVENUE SHARE BY REGION, 2021 (%)
    FIGURE 63. CYANOTECH CORPORATION: NET SALES, 2019-2021 ($MILLION)
    FIGURE 64. CYANOTECH CORPORATION: RESEARCH & DEVELOPMENT EXPENDITURE, 2019-2021 ($MILLION)
    FIGURE 65. CYANOTECH CORPORATION: REVENUE SHARE BY REGION, 2021 (%)


Carotenoids are a class of compounds that have coloring power. They are widely used in the food industry. They occur widely in nature and all colored fruits and vegetables are good sources of carotenoids. The carotenoids, which are used industrially are majorly synthesized chemically, whereas a small portion is obtained through natural sources such as extraction from plants or algae.

Health benefits associated with carotenoids increase their applications in animal feed, human food, dietary supplement, cosmetics, pharmaceuticals, and aquaculture industry. For instance, carotenoids, as preventive healthcare and nutraceuticals, have led to its higher consumption in human food and dietary supplement. Changes in lifestyle, food preferences, and increase in awareness have led to the growth in demand for natural colors in food processing, beverages, and cosmetics industry, which are projected to open new avenues for carotenoid manufacturers. Owing to the emergence of massive Chinese manufacturers with high-quality carotenoid products, the products across all types of formulation and origin have seen a big drop in price. Rapid economic growth, technological advancements, industrial growth, and low costs of production in countries such as China and India are further anticipated to drive the market growth.

However, stringent regulations on use of carotenoids in human food, threats of adulteration, and higher cost of naturally sourced carotenoids as compared to synthetic carotenoids are projected to hamper the market growth.

PURCHASE OPTIONS

Call or Email us

U.S.-Canada Toll-free: +1-800-792-5285
Int'l : +1-503-894-6022
Europe : +44-845-528-1300
Email : help@alliedmarketresearch.com
 
FREQUENTLY ASKED QUESTIONS?

A. The global carotenoids market size was valued at $1,838.8 million in 2021 and is projected to reach $2,719.3 million by 2031, registering a CAGR of 3.9% from 2022 to 2031.

A. The global carotenoids market is segmented on the basis of product, source, application, and region. By product, the market is divided into astaxanthin, capsanthin, lutein, beta-carotene, lycopene, and others. Based on source, the market is bifurcated into natural and synthetic. Based on application, the market is classified into animal feed, human food, dietary supplement, and others. By region, it is analyzed across North America, Europe, Asia-Pacific, and LAMEA

A. Europe is the largest regional market for carotenoids.

A. The major players analyzed for the carotenoids market are BASF SE, Koninklijke DSM N.V., Chr. Hansen A/S, FMC Corporation, Cyanotech Corporation, Kemin Industries Inc., DDW The Colour House, Döhler Group, Allied Biotech Corporation, and Excelvite

A. The global carotenoids market report is available on request on the website of Allied Market Research.

A. The forecast period considered in the global carotenoids market report is from 2022 to 2031. The report analyzes the market sizes from 2022 to 2031 along with the upcoming market trends and opportunities. The report also covers the key strategies adopted by the key players operating in the market.

Looking for Customization?

 Customization Request

Have a Question?

 Speak with Analyst

Any Confusion?

 Inquire Before Buying

Have a glance of the Report

  Request Sample
RELATED TAGS

Purchase Full Report of
Carotenoids Market

Start reading instantly.
This Report and over 68,113+ more Reports, Available with Avenue Library. T&C*.

  • Online Only
  • $3,570
  • Online cloud access only
  • Restricted print, copy, paste & download
  • Read only
  • Free industry update
    (Within 180 days)
  • Free report update in next update cycle
    (Mar 2024 - Mar 2025)
  • Data Pack
  • $3,840
  • Restricted to one authorized user
  • One print only
  • Available in
    Excel
  • Free industry update
    (Within 180 days)
  •   Free report update in next update cycle
    (Mar 2024 - Mar 2025)
  • Single User
  • $5,730
  • Restricted to one authorized user
  • One print only
  • Available in
    PDF
  • Free industry update
    (Within 180 days)
  •   Free report update in next update cycle
    (Mar 2024 - Mar 2025)
  • Five Users
  • $6,450
  • Limited to five authorized users
  • Print upto five copies
  • Available in
    PDF
  • Free industry update
    (Within 180 days)
  •   Free report update in next update cycle
    (Mar 2024 - Mar 2025)
  • Enterprise
    License/PDF

  • $9,600
  • Unlimited
    within
    company/enterprise
  • Available in Excel & PDF
  • Free industry update
    (Within 180 days)
  •   Free report update in next update cycle
    (Mar 2024 - Mar 2025)
  • Library
    Membership

  • $999 $ 1,175
    Per User/ Per month/ Billed annually
  • Published Content
    E-access
  • Company Profiles
    E-access
  • Newly Added Content Access
  • 10 PDF
    Downloads
  • 5 Excel Data
    Pack Downloads
  • 250 Company Profiles PDF Downloads
  • Buy Now

*Taxes/Fees, if applicable will be added during checkout. All prices in USD

RELATED REPORTS
 

Why Allied Market Research?


Infallible Methodology

To ensure high-level data integrity, accurate analysis, and impeccable forecasts

Analyst Support

For complete satisfaction

Customization

On-demand customization of scope of the report to exactly meet your needs

TARGETED MARKET VIEW

Targeted market view to provide pertinent information and save time of readers

Get fresh content delivered

Get insights on topics that are crucial for your business. Stay abreast of your interest areas.

Get Industry Data Alerts

Why Allied Market Research?

Infallible Methodology

To ensure high-level data integrity, accurate analysis, and impeccable forecasts

Analyst Support

For complete satisfaction

Customization

On-demand customization of scope of the report to exactly meet your needs

TARGETED MARKET VIEW

Targeted market view to provide pertinent information and save time of readers