Report Code: A11275 | May 2021 | Pages: 327 | ||
Tables: 165 | Charts: 71 |
|
Pandemic disrupted the entire world and affected many industries.
Get detailed COVID-19 impact analysis on the Cooking Oil Market
Request Now !
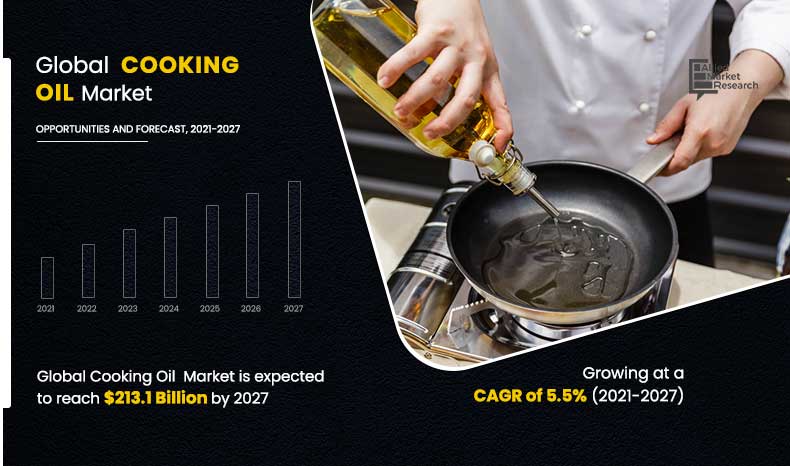
The cooking oil market size was valued at $168.4 billion in 2019, and is projected reach $213.1 billion by 2027, registering a CAGR of 5.5% from 2021 to 2027. The palm oil segment led in terms of the cooking oil market share in 2019, and is expected to retain its dominance during the forecast period.
Fortification of cooking oil is an emerging process in order to add on some myriad of micronutrients into the cooking oil to enhance nutritional value of the oil. According to FSSAI, fortification of cooking oil can help an individual to meet 25-30% of the required dietary intake for vitamin D & A. Furthermore, this process of fortification started in India, owing to a major deficiency of vitamins A & D in children. Thus, demand for fortified cooking is driving the global market.
Palm oil which holds the major share in the global cooking oil market is highly impacted by import bans by developed economies of North America and Europe. For instance, U.S. has banned the import of palm oil from the Malaysian company Sime Darby Plantation Berhad. It is the third Malaysian company to be slapped with an import ban over allegations of using forced labor. Similarly, Sri Lanka have imposed ban on import of palm oil and new palm plantations. According to some estimates, Sri Lanka imports about 200 KT of palm oil from Indonesia and Malaysia annually. Such bans and restriction negatively impacts the palm oil industry which in turn hampering the expansion of cooking oil market. In addition, Palm oil cultivation has been associated with deforestation, associated loss of bio diversity and land use change. Over the past 4 decades, palm oil have resulted in 16% and 47% deforestation in Indonesia and Malaysia respectively. Such environmental concerns further dissuades market expansion and results in upward price pressure on other edible oils.
The global cooking oil market is segmented based on product type, distribution channel, and region. Based on product type, the global market is divided into palm oil, soy oil, sunflower oil, peanut oil, olive oil, rapeseed oil, and others. By end user, the market is divided into residential, food services and food processing. By distribution channel, the market is categorized into hypermarket/supermarket, independent retail store, business to business and online sales channel. Region-wise, the global market is studied across North America (U.S., Canada, and Mexico), Europe (UK, Germany, France, Italy, Spain, Russia, and the rest of Europe), Asia-Pacific (China, India, Japan, ASEAN, Australia, and the rest of Asia-Pacific), and LAMEA (Brazil, Saudi Arabia, South Africa, and the rest of LAMEA).
On the basis of product type, the global market is categorized into palm oil, soy oil, sunflower oil, peanut oil, olive oil, rapeseed oil, and others. In 2019, palm oil segment accounted for the highest market share owing to its high nutritional value competitive prices however, others segment is likely to be the fastest growing segment during the forecast period.
On the basis of end user, the market is divided into residential, food services and food processing. The residential segment leads in terms of market share and is contributing to almost half of the cooking oil revenue. However, the food services segment is expected to be the fastest growing segment during the forecast period.
On the basis of distribution channel, the market is classified into hypermarket/supermarket, independent retail stores, business to business and online sales channels. The hypermarket/supermarket segment is dominating the market. However, the online segment is expected to grow with the highest CAGR during the forecast period.
Some of the major players profiled in the cooking oil market analysis include Archer-Daniels-Midland Company, American vegetable oil, Bunge Limited, Cargill, Fuji oil, Indo Agri, J-Oils, Louis Drayfus Company, Richardsons International and Wilmar International.
Key Benefits For Stakeholders
Key Market Segments
By Type
By Distribution Channel
By Region
Cooking Oil Market Report Highlights
Aspects | Details |
---|---|
By PRODUCT TYPE |
|
By END USER |
|
By DISTRIBUTION CHANNEL |
|
By Region |
|
Key Market Players | FUJI OIL HOLDING INC, BUNGE LIMITED, LOUIS DREYFUS COMPANY, CARGILL, INCORPORATED, WILMAR INTERNATIONAL, INDO AGRI, AMERICAN VEGETABLE OIL INC., RICHARDSON INTERNATIONAL, J-OIL MILLS INC, ARCHER DANIELS MIDLAND COMPANY |
CHAPTER 1:INTRODUCTION
1.1.Report description
1.2.Key benefits for stakeholders
1.3.Key market segment
1.4.Research methodology
1.4.1.Primary research
1.4.2.Secondary research
1.4.3.Analyst tools and models
CHAPTER 2:EXECUTIVE SUMMARY
2.1.Key findings of the study
2.1.1.Top impacting factors
2.1.2.Top investment pockets
2.2.CXO perspective
CHAPTER 3:MARKET OVERVIEW
3.1.Market definition and scope
3.2.Porter's five forces analysis
3.2.1.Bargaining power of suppliers
3.2.2.Threat of new entrants
3.2.3.Threat of substitute
3.2.4.Intensity of rivalry
3.2.5.Bargaining power of buyers
3.3.Market dynamics
3.3.1.Drivers
3.3.1.1.Growth of food processing industries in developing countries is anticipated to strengthen the demand for cooking oils.
3.3.1.2.Demand for organic cooking oil is catering the cooking oil market
3.3.1.3.Disruptive technologies are driving the market as it is pushing companies to innovate
3.3.2.Restraints
3.3.2.1.Counterfeiting of cooking oil fetching the restraints of the market
3.3.2.2.Constantly changing consumer’s preference, extreme weather conditions, and geo-political factors are restraining the palm oil supply
3.3.3.Opportunities
3.3.3.1.Fortification of cooking oil is a new adoption in cooking oil enhancement.
3.3.3.2.Recyclable packaging is an emerging market opportunity
3.4.Impact of COVID-19
3.4.1.Multiple scenarios
3.1.Value chain analysis
3.2.Pricing analysis
3.3.Parent market analysis
3.4.Consumer behavior analysis
CHAPTER 4:GLOBAL COOKING OIL, BY PRODUCT TYPE
4.1.Overview
4.1.1.Market size and forecast
4.2.Palm oil
4.2.1.Key market trends, growth factors and opportunities
4.2.2.Market size and forecast
4.2.3.Market analysis by country
4.3.Soy oil
4.3.1.Key market trends, growth factors and opportunities
4.3.2.Market size and forecast
4.3.3.Market analysis by country
4.4.Sunflower oil
4.4.1.Key market trends, growth factors and opportunities
4.4.2.Market size and forecast
4.4.3.Market analysis by country
4.5.Peanut oil
4.5.1.Key market trends, growth factors and opportunities
4.5.2.Market size and forecast
4.5.3.Market analysis by country
4.6.Olive oil
4.6.1.Key market trends, growth factors and opportunities
4.6.2.Market size and forecast
4.6.3.Market analysis by country
4.7.Rapeseed oil
4.7.1.Key market trends, growth factors and opportunities
4.7.2.Market size and forecast
4.7.3.Market analysis by country
4.8.Others
4.8.1.Key market trends, growth factors and opportunities
4.8.2.Market size and forecast
4.8.3.Market analysis by country
CHAPTER 5:COOKING OIL, BY END USER
5.1.Overview
5.1.1.Market size and forecast
5.2.RESIDENTIAL
5.2.1.Key market trends, growth factors and opportunities
5.2.2.Market size and forecast
5.2.3.Market analysis by country
5.3.FOOD SERVICES
5.3.1.Key market trends, growth factors and opportunities
5.3.2.Market size and forecast
5.3.3.Market analysis by country
5.4.FOOD PROCCESSING
5.4.1.Key market trends, growth factors and opportunities
5.4.2.Market size and forecast
5.4.3.Market analysis by country
CHAPTER 6:GLOBAL COOKING OIL,BY DISTRIBUTION CHANNEL
6.1.Overview
6.1.1.Market size and forecast
6.2.Supermarket/Hypermarket
6.2.1.Key market trends, growth factors and opportunities
6.2.2.Market size and forecast
6.2.3.Market analysis by country
6.3.Independent Retail Stores
6.3.1.Key market trends, growth factors and opportunities
6.3.2.Market size and forecast
6.3.3.Market analysis by country
6.4.Business to business
6.4.1.Key market trends, growth factors and opportunities
6.4.2.Market size and forecast
6.4.3.Market analysis by country
6.5.Online Sales Channel
6.5.1.Key market trends, growth factors and opportunities
6.5.2.Market size and forecast
6.5.3.Market analysis by country
CHAPTER 7:COOKING OIL MARKET, BY REGION
7.1.Overview
7.1.1.Market size and forecast, by region
7.2.North America
7.2.1.Key market trends, growth factors, and opportunities
7.2.2.Market size and forecast, by end user
7.2.3.Market size and forecast, by end user
7.2.4.Market size and forecast, by distribution channel
7.2.5.Market analysis by country
7.2.5.1.U.S.
7.2.5.1.1.Market size and forecast, by product type
7.2.5.1.2.Market size and forecast, by end user
7.2.5.1.3.Market size and forecast, by distribution channel
7.2.5.2.CANADA
7.2.5.2.1.Market size and forecast, by product type
7.2.5.2.2.Market size and forecast, by end user
7.2.5.2.3.Market size and forecast, by distribution channel
7.2.5.3.MEXICO
7.2.5.3.1.Market size and forecast, by product type
7.2.5.3.2.Market size and forecast, by end user
7.2.5.3.3.Market size and forecast, by distribution channel
7.3.Europe
7.3.1.Key market trends, growth factors, and opportunities
7.3.2.Market size and forecast, by end user
7.3.3.Market size and forecast, by end user
7.3.4.Market size and forecast, by distribution channel
7.3.5.Market analysis by country
7.3.5.1.U.K.
7.3.5.1.1.Market size and forecast, by product type
7.3.5.1.2.Market size and forecast, by end user
7.3.5.1.3.Market size and forecast, by distribution channel
7.3.5.2.GERMANY
7.3.5.2.1.Market size and forecast, by product type
7.3.5.2.2.Market size and forecast, by end user
7.3.5.2.3.Market size and forecast, by distribution channel
7.3.5.3.FRANCE
7.3.5.3.1.Market size and forecast, by product type
7.3.5.3.2.Market size and forecast, by end user
7.3.5.3.3.Market size and forecast, by distribution channel
7.3.5.4.ITALY
7.3.5.4.1.Market size and forecast, by product type
7.3.5.4.2.Market size and forecast, by end user
7.3.5.4.3.Market size and forecast, by distribution channel
7.3.5.5.RUSSIA
7.3.5.5.1.Market size and forecast, by product type
7.3.5.5.2.Market size and forecast, by end user
7.3.5.5.3.Market size and forecast, by distribution channel
7.3.5.6.REST OF EUROPE
7.3.5.6.1.Market size and forecast, by product type
7.3.5.6.2.Market size and forecast, by end user
7.3.5.6.3.Market size and forecast, by distribution channel
7.4.Asia-pacific
7.4.1.Key market trends, growth factors, and opportunities
7.4.2.Market size and forecast, by end user
7.4.3.Market size and forecast, by end user
7.4.4.Market size and forecast, by distribution channel
7.4.5.Market size and country analysis
7.4.5.1.CHINA
7.4.5.1.1.Market size and forecast, by product type
7.4.5.1.2.Market size and forecast, by end user
7.4.5.1.3.Market size and forecast, by distribution channel
7.4.5.2.INDIA
7.4.5.2.1.Market size and forecast, by product type
7.4.5.2.2.Market size and forecast, by end user
7.4.5.2.3.Market size and forecast, by distribution channel
7.4.5.3.JAPAN
7.4.5.3.1.Market size and forecast, by product type
7.4.5.3.2.Market size and forecast, by end user
7.4.5.3.3.Market size and forecast, by distribution channel
7.4.5.4.ASEAN
7.4.5.4.1.Market size and forecast, by product type
7.4.5.4.2.Market size and forecast, by end user
7.4.5.4.3.Market size and forecast, by distribution channel
7.4.5.5.AUSTRALIA
7.4.5.5.1.Market size and forecast, by product type
7.4.5.5.2.Market size and forecast, by end user
7.4.5.5.3.Market size and forecast, by distribution channel
7.4.5.6.REST OF ASIA PACIFIC
7.4.5.6.1.Market size and forecast, by product type
7.4.5.6.2.Market size and forecast, by end user
7.4.5.6.3.Market size and forecast, by distribution channel
7.5.LAMEA
7.5.1.Key market trends, growth factors, and opportunities
7.5.2.Market size and forecast, by end user
7.5.3.Market size and forecast, by end user
7.5.4.Market size and forecast, by distribution channel
7.5.5.Market analysis by country
7.5.5.1.BRAZIL
7.5.5.1.1.Market size and forecast, by product type
7.5.5.1.2.Market size and forecast, by end user
7.5.5.1.3.Market size and forecast, by distribution channel
7.5.5.2.SAUDI ARABIA
7.5.5.2.1.Market size and forecast, by product type
7.5.5.2.2.Market size and forecast, by end user
7.5.5.2.3.Market size and forecast, by distribution channel
7.5.5.3.SOUTH AFRICA
7.5.5.3.1.Market size and forecast, by product type
7.5.5.3.2.Market size and forecast, by end user
7.5.5.3.3.Market size and forecast, by distribution channel
7.5.5.4.REST OF LAMEA
7.5.5.4.1.Market size and forecast, by product type
7.5.5.4.2.Market size and forecast, by end user
7.5.5.4.3.Market size and forecast, by distribution channel
CHAPTER 8:COMPETITION LANDSCAPE
8.1.Top winning strategies
8.2.Top player positioning
8.3.Competitive dashboard
8.4.Competitive heat map
8.5.Key developments
8.5.1.Acquisition
8.5.2.Business Expansion
8.5.3.Product Launch
CHAPTER 9:COMPANY PROFILES
9.1.ARCHER DANIELS MIDLAND COMPANY
9.1.1.Company overview
9.1.2.Key Executives
9.1.3.Company snapshot
9.1.4.Operating business segments
9.1.5.Product portfolio
9.1.6.Business performance
9.1.7.Key strategic moves and developments
9.2.AMERICAN VEGETABLE OIL INC.
9.2.1.Company overview
9.2.9.Company snapshot
9.2.3.Operating business segments
9.2.4.Product portfolio
9.3.BUNGE LIMITED
9.3.1.Company overview
9.3.2.Key Executives
9.3.3.Company snapshot
9.3.4.Operating business segments
9.3.5.Product portfolio
9.3.6.Business performance
9.3.7.Key strategic moves and developments
9.4.CARGILL, INCORPORATED
9.4.1.Company overview
9.4.2.Key Executives
9.4.3.Company snapshot
9.4.4.Operating business segments
9.4.5.Product portfolio
9.4.6.Business performance
9.4.7.Key strategic moves and developments
9.5.FUJI OIL HOLDING INC
9.5.1.Company overview
9.5.2.Key Executives
9.5.3.Company snapshot
9.5.4.Operating business segments
9.5.5.Business performance
9.5.6.Key strategic moves and developments
9.6.INDO AGRI
9.6.1.Company overview
9.6.2.Key Executives
9.6.3.Company snapshot
9.6.4.Product portfolio
9.6.5.Business performance
9.7.J-OIL MILLS INC
9.7.1.Company overview
9.7.2.Key Executives
9.7.3.Company snapshot
9.7.4.Operating business segments
9.7.5.Product portfolio
9.7.6.Business performance
9.7.7.Key strategic moves and developments
9.8.LOUIS DREYFUS COMPANY
9.8.1.Company overview
9.8.2.Key Executives
9.8.3.Company snapshot
9.8.4.Operating business segments
9.8.5.Product portfolio
9.8.6.Business performance
9.8.7.Key strategic moves and developments
9.9.RICHARDSON INTERNATIONAL
9.9.1.Company overview
9.9.2.Company snapshot
9.9.3.Product portfolio
9.9.4.Key strategic moves and developments
9.10.WILMAR INTERNATIONAL
9.10.1.Company overview
9.10.2.Key Executives
9.10.3.Company snapshot
9.10.4.Operating business segments
9.10.5.Product portfolio
9.10.6.Business performance
9.10.7.Key strategic moves and developments
LIST OF TABLES
TABLE 01.GLOBAL COOKING OIL MARKET REVENUE, BY PRODUCT TYPE, 2019–2027 ($MILLION)
TABLE 02.GLOBAL COOKING OIL VOLUME, BY PRODUCT TYPE, 2019–2027 ($KILLO TONS)
TABLE 03.PALM COOKING OIL MARKET REVENUE, BY REGION, 2019–2027 ($MILLION)
TABLE 04.PALM COOKING OIL VOLUME, BY REGION, 2019–2027 ($KILLO TON)
TABLE 05.SOY COOKING OIL MARKET REVENUE, BY REGION, 2019–2027 ($MILLION)
TABLE 06.SOY COOKING OIL VOLUME, BY REGION, 2019–2027 ($KILLO TON)
TABLE 07.SUNFLOWER COOKING OIL MARKET REVENUE, BY REGION, 2019–2027 ($MILLION)
TABLE 08.SUNFLOWER COOKING OIL VOLUME, BY REGION, 2019–2027 ($KILLO TON)
TABLE 09.PEANUT COOKING OIL MARKET REVENUE, BY REGION, 2019–2027 ($MILLION)
TABLE 10.PEANUT COOKING OIL VOLUME, BY REGION, 2019–2027 ($KILLO TON)
TABLE 11.OLIVE COOKING OIL MARKET REVENUE FOR OLIVE OIL, BY REGION, 2019–2027 ($MILLION)
TABLE 12.OLIVE COOKING OIL VOLUME, BY REGION, 2019–2027 ($KILLO TON)
TABLE 13.RAPESEED COOKING OIL MARKET REVENUE, BY REGION, 2019–2027 ($MILLION)
TABLE 14.RAPESEED COOKING OIL VOLUME, BY REGION, 2019–2027 ($KILLO TON)
TABLE 15.OTHER COOKING OIL MARKET REVENUE, BY REGION, 2019–2027 ($MILLION)
TABLE 16.OTHERS COOKING OIL VOLUME, BY REGION, 2019–2027 ($KILLO TON)
TABLE 17.GLOBAL COOKING OIL MARKET REVENUE, BY END USER, 2019–2027 ($MILLION)
TABLE 18.COOKING OIL MARKET REVENUE FOR RESIDENTIAL , BY REGION, 2019–2027 ($MILLION)
TABLE 19.COOKING OIL MARKET REVENUE FOR FOOD SERVICES, BY REGION, 2019–2027 ($MILLION)
TABLE 20.COOKING OIL MARKET REVENUE FOR FOOD PROCCESSING, BY REGION, 2019–2027 ($MILLION)
TABLE 21.GLOBAL COOKING OIL MARKET REVENUE, BY DISTRUBUTION CHANNEL, 2019–2027 ($MILLION)
TABLE 22.COOKING OIL MARKET REVENUE FOR HYPERMARKET/SUPERMARKET , BY REGION, 2019–2027 ($MILLION)
TABLE 23.COOKING OIL MARKET REVENUE FOR INDEPENDENT RETAIL STORES, BY REGION, 2019–2027 ($MILLION)
TABLE 24.COOKING OIL MARKET REVENUE FOR BUSINESS TO BUSINESS, BY REGION, 2019–2027 ($MILLION)
TABLE 25.COOKING OIL MARKET REVENUE FOR ONLINE SALES CHANNEL, BY REGION, 2019–2027 ($MILLION)
TABLE 26.COOKING OIL MARKET REVENUE, BY REGION, 2019–2027 ($MILLION)
TABLE 27.NORTH AMERICA COOKING OIL MARKET REVENUE, BY PRODUCT TYPE, 2019–2027 ($MILLION)
TABLE 28.NORTH AMERICA COOKING OIL VOLUME, BY PRODUCT TYPE, 2019–2027 ($KILLO TONS)
TABLE 29.NORTH AMERICA COOKING OIL MARKET REVENUE, BY END USER TYPE, 2019–2027 ($MILLION)
TABLE 30.NORTH AMERICA COOKING OIL MARKET REVENUE, BY DISTRIBUTION CHANNEL, 2019–2027 ($MILLION)
TABLE 31.NORTH AMERICA COOKING OIL MARKET, BY COUNTRY, 2019–2027 ($MILLION)
TABLE 32.U.S. COOKING OIL MARKET REVENUE, BY PRODUCT TYPE, 2019–2027 ($MILLION)
TABLE 33.U.S. COOKING OIL VOLUME, BY PRODUCT TYPE, 2019–2027 ($KILLO TONS)
TABLE 34.U.S. COOKING OIL MARKET REVENUE, BY END USER, 2019–2027 ($MILLION)
TABLE 35.U.S. COOKING OIL MARKET REVENUE, BY DISTRIBUTION CHANNEL, 2019–2027 ($MILLION)
TABLE 36.CANADA COOKING OIL MARKET REVENUE, BY PRODUCT TYPE, 2019–2027 ($MILLION)
TABLE 37.CANADA COOKING OIL VOLUME, BY PRODUCT TYPE, 2019–2027 ($KILLO TONS)
TABLE 38.CANADA COOKING OIL MARKET REVENUE, BY END USER, 2019–2027 ($MILLION)
TABLE 39.CANADA COOKING OIL MARKET REVENUE, BY DISTRIBUTION CHANNEL, 2019–2027 ($MILLION)
TABLE 40.MEXICO COOKING OIL MARKET REVENUE, BY PRODUCT TYPE, 2019–2027 ($MILLION)
TABLE 41.MEXICO COOKING OIL VOLUME, BY PRODUCT TYPE, 2019–2027 ($KILLO TONS)
TABLE 42.MEXICO COOKING OIL MARKET REVENUE, BY END USER, 2019–2027 ($MILLION)
TABLE 43.MEXICO COOKING OIL MARKET REVENUE, BY DISTRIBUTION CHANNEL, 2019–2027 ($MILLION)
TABLE 44.EUROPE COOKING OIL MARKET REVENUE, BY PRODUCT TYPE, 2019–2027 ($MILLION)
TABLE 45.EUROPE COOKING OIL VOLUME, BY PRODUCT TYPE, 2019–2027 ($KILLO TONS)
TABLE 46.EUROPE COOKING OIL MARKET REVENUE, BY END USER TYPE, 2019–2027 ($MILLION)
TABLE 47.EUROPE COOKING OIL MARKET REVENUE, BY DISTRIBUTION CHANNEL, 2019–2027 ($MILLION)
TABLE 48.EUROPE COOKING OIL MARKET, BY COUNTRY, 2019–2027 ($MILLION)
TABLE 49.UK COOKING OIL MARKET REVENUE, BY PRODUCT TYPE, 2019–2027 ($MILLION)
TABLE 50.UK COOKING OIL VOLUME, BY PRODUCT TYPE, 2019–2027 ($KILLO TONS)
TABLE 51.UK COOKING OIL MARKET REVENUE, BY END USER, 2019–2027 ($MILLION)
TABLE 52.UK COOKING OIL MARKET REVENUE, BY DISTRIBUTION CHANNEL, 2019–2027 ($MILLION)
TABLE 53.GERMANY COOKING OIL MARKET REVENUE, BY PRODUCT TYPE, 2019–2027 ($MILLION)
TABLE 54.GERMANY COOKING OIL VOLUME, BY PRODUCT TYPE, 2019–2027 ($KILLO TONS)
TABLE 55.GERMANY COOKING OIL MARKET REVENUE, BY END USER, 2019–2027 ($MILLION)
TABLE 56.GERMANY COOKING OIL MARKET REVENUE, BY DISTRIBUTION CHANNEL, 2019–2027 ($MILLION)
TABLE 57.FRANCE COOKING OIL MARKET REVENUE, BY PRODUCT TYPE, 2019–2027 ($MILLION)
TABLE 58.FRANCE COOKING OIL VOLUME, BY PRODUCT TYPE, 2019–2027 ($KILLO TONS)
TABLE 59.FRANCE COOKING OIL MARKET REVENUE, BY END USER, 2019–2027 ($MILLION)
TABLE 60.FRANCE COOKING OIL MARKET REVENUE, BY DISTRIBUTION CHANNEL, 2019–2027 ($MILLION)
TABLE 61.ITALY COOKING OIL MARKET REVENUE, BY PRODUCT TYPE, 2019–2027 ($MILLION)
TABLE 62.ITALY COOKING OIL VOLUME, BY PRODUCT TYPE, 2019–2027 ($KILLO TONS)
TABLE 63.ITALY COOKING OIL MARKET REVENUE, BY END USER, 2019–2027 ($MILLION)
TABLE 64.ITALY COOKING OIL MARKET REVENUE, BY DISTRIBUTION CHANNEL, 2019–2027 ($MILLION)
TABLE 65.RUSSIA COOKING OIL MARKET REVENUE, BY PRODUCT TYPE, 2019–2027 ($MILLION)
TABLE 66.RUSSIA COOKING OIL VOLUME, BY PRODUCT TYPE, 2019–2027 ($KILLO TONS)
TABLE 67.RUSSIA COOKING OIL MARKET REVENUE, BY END USER, 2019–2027 ($MILLION)
TABLE 68.RUSSIA COOKING OIL MARKET REVENUE, BY DISTRIBUTION CHANNEL, 2019–2027 ($MILLION)
TABLE 69.REST OF EUROPE COOKING OIL MARKET REVENUE, BY PRODUCT TYPE, 2019–2027 ($MILLION)
TABLE 70.REST OF EUROPE COOKING OIL VOLUME, BY PRODUCT TYPE, 2019–2027 ($KILLO TONS)
TABLE 71.REST OF EUROPE COOKING OIL MARKET REVENUE, BY END USER, 2019–2027 ($MILLION)
TABLE 72.REST OF EUROPE COOKING OIL MARKET REVENUE, BY DISTRIBUTION CHANNEL, 2019–2027 ($MILLION)
TABLE 73.ASIA-PACIFIC COOKING OIL MARKET REVENUE, BY PRODUCT TYPE, 2019–2027 ($MILLION)
TABLE 74.ASIA-PACIFIC COOKING OIL VOLUME, BY PRODUCT TYPE, 2019–2027 ($KILLO TONS)
TABLE 75.ASIA-PACIFIC COOKING OIL MARKET REVENUE, BY END USER TYPE, 2019–2027 ($MILLION)
TABLE 76.ASIA-PACIFIC COOKING OIL MARKET REVENUE, BY DISTRIBUTION CHANNEL, 2019–2027 ($MILLION)
TABLE 77.ASIA-PACIFIC COOKING OIL MARKET REVENUE, BY COUNTRY, 2019–2027 ($MILLION)
TABLE 78.CHINA COOKING OIL MARKET REVENUE, BY PRODUCT TYPE, 2019–2027 ($MILLION)
TABLE 79.CHINA COOKING OIL VOLUME, BY PRODUCT TYPE, 2019–2027 ($KILLO TONS)
TABLE 80.CHINA COOKING OIL MARKET REVENUE, BY END USER, 2019–2027 ($MILLION)
TABLE 81.CHINA COOKING OIL MARKET REVENUE, BY DISTRIBUTION CHANNEL, 2019–2027 ($MILLION)
TABLE 82.INDIA COOKING OIL MARKET REVENUE, BY PRODUCT TYPE, 2019–2027 ($MILLION)
TABLE 83.INDIA COOKING OIL VOLUME, BY PRODUCT TYPE, 2019–2027 ($KILLO TONS)
TABLE 84.INDIA COOKING OIL MARKET REVENUE, BY END USER, 2019–2027 ($MILLION)
TABLE 85.INDIA COOKING OIL MARKET REVENUE, BY DISTRIBUTION CHANNEL, 2019–2027 ($MILLION)
TABLE 86.JAPAN COOKING OIL MARKET REVENUE, BY PRODUCT TYPE, 2019–2027 ($MILLION)
TABLE 87.JAPAN COOKING OIL VOLUME, BY PRODUCT TYPE, 2019–2027 ($KILLO TONS)
TABLE 88.JAPAN COOKING OIL MARKET REVENUE, BY END USER, 2019–2027 ($MILLION)
TABLE 89.JAPAN COOKING OIL MARKET REVENUE, BY DISTRIBUTION CHANNEL, 2019–2027 ($MILLION)
TABLE 90.ASEAN COOKING OIL MARKET REVENUE, BY PRODUCT TYPE, 2019–2027 ($MILLION)
TABLE 91.ASEAN COOKING OIL VOLUME, BY PRODUCT TYPE, 2019–2027 ($KILLO TONS)
TABLE 92.ASEAN COOKING OIL MARKET REVENUE, BY END USER, 2019–2027 ($MILLION)
TABLE 93.ASEAN COOKING OIL MARKET REVENUE, BY DISTRIBUTION CHANNEL, 2019–2027 ($MILLION)
TABLE 94.AUSTRALIA COOKING OIL MARKET REVENUE, BY PRODUCT TYPE, 2019–2027 ($MILLION)
TABLE 95.AUSTRALIA COOKING OIL VOLUME, BY PRODUCT TYPE, 2019–2027 ($KILLO TONS)
TABLE 96.AUSTRALIA COOKING OIL MARKET REVENUE, BY END USER, 2019–2027 ($MILLION)
TABLE 97.AUSTRALIA COOKING OIL MARKET REVENUE, BY DISTRIBUTION CHANNEL, 2019–2027 ($MILLION)
TABLE 98.REST OF ASIA-PACIFIC COOKING OIL MARKET REVENUE, BY PRODUCT TYPE, 2019–2027 ($MILLION)
TABLE 99.REST OF ASIA-PACIFIC COOKING OIL VOLUME, BY PRODUCT TYPE, 2019–2027 ($KILLO TONS)
TABLE 100.REST OF ASIA-PACIFIC COOKING OIL MARKET REVENUE, BY END USER, 2019–2027 ($MILLION)
TABLE 101.REST OF ASIA-PACIFIC COOKING OIL MARKET REVENUE, BY DISTRIBUTION CHANNEL, 2019–2027 ($MILLION)
TABLE 102.LAMEA COOKING OIL MARKET REVENUE, BY PRODUCT TYPE, 2019–2027 ($MILLION)
TABLE 103.LAMEA COOKING OIL VOLUME, BY PRODUCT TYPE, 2019–2027 ($KILLO TONS)
TABLE 104.LAMEA COOKING OIL MARKET REVENUE, BY END USER TYPE, 2019–2027 ($MILLION)
TABLE 105.LAMEA COOKING OIL MARKET REVENUE, BY DISTRIBUTION CHANNEL, 2019–2027 ($MILLION)
TABLE 106.LAMEA COOKING OIL MARKET, BY COUNTRY, 2019–2027 ($MILLION)
TABLE 107.BRAZIL COOKING OIL MARKET REVENUE, BY PRODUCT TYPE, 2019–2027 ($MILLION)
TABLE 108.BRAZIL COOKING OIL VOLUME, BY PRODUCT TYPE, 2019–2027 ($KILLO TONS)
TABLE 109.BRAZIL COOKING OIL MARKET REVENUE, BY END USER, 2019–2027 ($MILLION)
TABLE 110.BRAZIL COOKING OIL MARKET REVENUE, BY DISTRIBUTION CHANNEL, 2019–2027 ($MILLION)
TABLE 111.SAUDI ARABIA COOKING OIL MARKET REVENUE, BY PRODUCT TYPE, 2019–2027 ($MILLION)
TABLE 112.SAUDI ARABIA COOKING OIL VOLUME, BY PRODUCT TYPE, 2019–2027 ($KILLO TONS)
TABLE 113.SAUDI ARABIA COOKING OIL MARKET REVENUE, BY END USER, 2019–2027 ($MILLION)
TABLE 114.SAUDI ARABIA COOKING OIL MARKET REVENUE, BY DISTRIBUTION CHANNEL, 2019–2027 ($MILLION)
TABLE 115.SOUTH AFRICA COOKING OIL MARKET REVENUE, BY PRODUCT TYPE, 2019–2027 ($MILLION)
TABLE 116.SOUTH AFRICA COOKING OIL VOLUME, BY PRODUCT TYPE, 2019–2027 ($KILLO TONS)
TABLE 117.SOUTH AFRICA COOKING OIL MARKET REVENUE, BY END USER, 2019–2027 ($MILLION)
TABLE 118.SOUTH AFRICA COOKING OIL MARKET REVENUE, BY DISTRIBUTION CHANNEL, 2019–2027 ($MILLION)
TABLE 119.REST OF LAMEA COOKING OIL MARKET REVENUE, BY PRODUCT TYPE, 2019–2027 ($MILLION)
TABLE 120.REST OF LAMEA COOKING OIL VOLUME, BY PRODUCT TYPE, 2019–2027 ($KILLO TONS)
TABLE 121.REST OF LAMEA COOKING OIL MARKET REVENUE, BY END USER, 2019–2027 ($MILLION)
TABLE 122.REST OF LAMEA COOKING OIL MARKET REVENUE, BY DISTRIBUTION CHANNEL, 2019–2027 ($MILLION)
TABLE 123.ARCHER DANIELS MIDLAND COMPANY: KEY EXECUTIVES
TABLE 124.ARCHER DANIELS MIDLAND COMPANY: COMPANY SNAPSHOT
TABLE 125.ARCHER DANIELS MIDLAND COMPANY: OPERATING SEGMENTS
TABLE 126.ARCHER DANIELS MIDLAND COMPANY: PRODUCT PORTFOLIO
TABLE 127.ARCHER DANIELS MIDLAND COMPANY: NET SALES, 2017–2019 ($MILLION)
TABLE 128.AVO: COMPANY SNAPSHOT
TABLE 129.AVO: OPERATING SEGMENTS
TABLE 130.AVO: PRODUCT PORTFOLIO
TABLE 131.BUNGE LIMITED: KEY EXECUTIVES
TABLE 132.BUNGE LIMITED: COMPANY SNAPSHOT
TABLE 133.BUNGE LIMITED: OPERATING SEGMENTS
TABLE 134.BUNGE LIMITED: PRODUCT PORTFOLIO
TABLE 135.BUNGE LIMITED: NET SALES, 2017–2019 ($MILLION)
TABLE 136.CARGILL, INCORPORATED : KEY EXECUTIVES
TABLE 137.CARGILL, INCORPORATED : COMPANY SNAPSHOT
TABLE 138.CARGILL, INCORPORATED : OPERATING SEGMENTS
TABLE 139.CARGILL, INCORPORATED : PRODUCT PORTFOLIO
TABLE 140.CARGILL, INCORPORATED : NET SALES, 2017–2019 ($MILLION)
TABLE 141.FUJI OIL HOLDING INC : KEY EXECUTIVES
TABLE 142.FUJI OIL HOLDING INC: COMPANY SNAPSHOT
TABLE 143.FUJI OIL HOLDING INC.: OPERATING SEGMENTS
TABLE 144.FUJI OIL HOLDING INC.: NET SALES, 2017–2019 ($MILLION)
TABLE 145.INDO AGRI: KEY EXECUTIVES
TABLE 146.INDO AGRI: COMPANY SNAPSHOT
TABLE 147.INDO AGRI: PRODUCT PORTFOLIO
TABLE 148.INDO AGRI: NET SALES, 2017–2019 ($MILLION)
TABLE 149.J-OIL MILLS INC: KEY EXECUTIVES
TABLE 150.J-OIL MILLS INC: COMPANY SNAPSHOT
TABLE 151.J-OIL MILLS INC: OPERATING SEGMENTS
TABLE 152.J-OIL MILLS INC: PRODUCT PORTFOLIO
TABLE 153.J-OIL MILLS INC: NET SALES, 2017–2019 ($MILLION)
TABLE 154.LOUIS DREYFUS COMPANY B.V. : KEY EXECUTIVES
TABLE 155.LOUIS DREYFUS COMPANY B.V. : COMPANY SNAPSHOT
TABLE 156.LOUIS DREYFUS COMPANY B.V. : OPERATING SEGMENTS
TABLE 157.LOUIS DREYFUS: PRODUCT PORTFOLIO
TABLE 158.LOUIS DREYFUS: NET SALES, 2017–2019 ($MILLION)
TABLE 159.RICHARDSON INTERNATIONAL: COMPANY SNAPSHOT
TABLE 160.RICHARDSON INTERNATIONAL: PRODUCT PORTFOLIO
TABLE 161.WILMAR INTERNATIONAL : KEY EXECUTIVES
TABLE 162.WILMAR INTERNATIONAL : COMPANY SNAPSHOT
TABLE 163.WILMAR INTERNATIONAL : OPERATING SEGMENTS
TABLE 164.WILMAR INTERNATIONAL : PRODUCT PORTFOLIO
TABLE 165.WILMAR: NET SALES, 2017–2019 ($MILLION)
LIST OF FIGURES
FIGURE 01.KEY MARKET SEGMENTS
FIGURE 02.EXECUTIVE SUMMARY
FIGURE 03.TOP IMPACTING FACTORS
FIGURE 04.TOP INVESTMENT POCKETS
FIGURE 05.MODERATE BARGAINING POWER OF SUPPLIERS
FIGURE 06.LOW THREAT OF NEW ENTRANTS
FIGURE 08.MODERATE THREAT OF SUBSTITUTES
FIGURE 09.MODERATE INTENSITY OF RIVALRY
FIGURE 10.MODERATE BARGAINING POWER OF BUYERS
FIGURE 11.GLOBAL COOKING OIL: DRIVERS, RESTRAINTS, AND OPPORTUNITIES
FIGURE 12.GLOBAL COOKING OIL, BY PRODUCT TYPE, 2019 (%)
FIGURE 13.COMPARATIVE SHARE ANALYSIS FOR COOKING OIL MARKET REVENUE FOR PALM OIL, BY COUNTRY, 2019 & 2027 (%)
FIGURE 14.COMPARATIVE SHARE ANALYSIS FOR COOKING OIL MARKET REVENUE FOR SOY OIL, BY COUNTRY, 2019 & 2027 (%)
FIGURE 15.COMPARATIVE SHARE ANALYSIS FOR COOKING OIL MARKET REVENUE FOR SUNFLOWER OIL, BY COUNTRY, 2019 & 2027 (%)
FIGURE 16.COMPARATIVE SHARE ANALYSIS FOR COOKING OIL MARKET REVENUE FOR PEANUT OIL, BY COUNTRY, 2019 & 2027 (%)
FIGURE 17.COMPARATIVE SHARE ANALYSIS FOR COOKING OIL MARKET REVENUE FOR OLIVE OIL, BY COUNTRY, 2019 & 2027 (%)
FIGURE 18.COMPARATIVE SHARE ANALYSIS FOR COOKING OIL MARKET REVENUE FOR RAPESEED OIL, BY COUNTRY, 2019 & 2027 (%)
FIGURE 19.COMPARATIVE SHARE ANALYSIS FOR COOKING OIL MARKET REVENUE FOR OTHERS, BY COUNTRY, 2019 & 2027 (%)
FIGURE 20.GLOBAL COOKING OIL, BY END USER, 2019 (%)
FIGURE 21.COMPARATIVE SHARE ANALYSIS FOR GLOBAL COOKING OIL MARKET REVENUE FOR RESIDENTIAL, BY COUNTRY, 2019 & 2027 (%)
FIGURE 22.COMPARATIVE SHARE ANALYSIS FOR GLOBAL COOKING OIL MARKET REVENUE FOR FOOD SERVICES, BY COUNTRY, 2019 & 2027 (%)
FIGURE 23.COMPARATIVE SHARE ANALYSIS FOR GLOBAL COOKING OIL MARKET REVENUE FOR FOOD PROCCESSING, BY COUNTRY, 2019 & 2027 (%)
FIGURE 24.GLOBAL COOKING OIL, BY DISTRIBUTION CHANNEL, 2019 (%)
FIGURE 25.COMPARATIVE SHARE ANALYSIS FOR GLOBAL COOKING OIL MARKET REVENUE FOR HYPERMARKET/SUPERMARKET, BY COUNTRY, 2019 & 2027 (%)
FIGURE 26.COMPARATIVE SHARE ANALYSIS FOR GLOBAL COOKING OIL MARKET REVENUE FOR INDEPENDENT RETAIL STORES, BY COUNTRY, 2019 & 2027 (%)
FIGURE 27.COMPARATIVE SHARE ANALYSIS FOR GLOBAL COOKING OIL MARKET REVENUE FOR BUSINESS TO BUSINESS, BY COUNTRY, 2019 & 2027 (%)
FIGURE 28.COMPARATIVE SHARE ANALYSIS FOR GLOBAL COOKING OIL MARKET REVENUE FOR ONLINE SALES CHANNEL, BY COUNTRY, 2019 & 2027 (%)
FIGURE 29.COOKING OIL MARKET, BY REGION, 2019 (%)
FIGURE 30.U.S. COOKING OIL, 2019–2027 ($MILLION)
FIGURE 31.CANADA COOKING OIL, 2019–2027 ($MILLION)
FIGURE 32.MEXICO COOKING OIL, 2019–2027 ($MILLION)
FIGURE 33.U.K. COOKING OIL, 2019–2027 ($MILLION)
FIGURE 34.GERMANY COOKING OIL, 2019–2027 ($MILLION)
FIGURE 35.FRANCE COOKING OIL, 2019–2027 ($MILLION)
FIGURE 36.ITALY COOKING OIL, 2019–2027 ($MILLION)
FIGURE 37.RUSSIA COOKING OIL, 2019–2027 ($MILLION)
FIGURE 38.REST OF EUROPE COOKING OIL, 2019–2027 ($MILLION)
FIGURE 39.CHINA COOKING OIL, 2019–2027 ($MILLION)
FIGURE 40.INDIA COOKING OIL, 2019–2027 ($MILLION)
FIGURE 41.JAPAN COOKING OIL, 2019–2027 ($MILLION)
FIGURE 42.ASEAN COOKING OIL, 2019–2027 ($MILLION)
FIGURE 43.AUSTRALIA COOKING OIL, 2019–2027 ($MILLION)
FIGURE 44.REST OF ASIA-PACIFIC COOKING OIL, 2019–2027 ($MILLION)
FIGURE 45.BRAZIL COOKING OIL, 2019–2027 ($MILLION)
FIGURE 46.SAUDI ARABIA COOKING OIL, 2019–2027 ($MILLION)
FIGURE 47.SOUTH AFRICA COOKING OIL, 2019–2027 ($MILLION)
FIGURE 48.REST OF LAMEA COOKING OIL, 2019–2027 ($MILLION)
FIGURE 49.TOP WINNING STRATEGIES, BY YEAR, 2017–2020*
FIGURE 50.TOP WINNING STRATEGIES, BY DEVELOPMENT, 2017–2020* (%)
FIGURE 51.TOP WINNING STRATEGIES, BY COMPANY, 2017–2020*
FIGURE 52.COMPETITIVE DASHBOARD OF TOP 10 KEY PLAYERS
FIGURE 53.COMPETITIVE HEATMAP OF TOP 10 KEY PLAYERS
FIGURE 54.ARCHER DANIELS MIDLAND COMPANY: NET SALES, 2018–2020 ($MILLION)
FIGURE 55.ARCHER DANIELS MIDLAND COMPANY: REVENUE SHARE BY SEGMENT, 2020 (%)
FIGURE 56.ARCHER DANIELS MIDLAND COMPANY: REVENUE SHARE BY REGION, 2020 (%)
FIGURE 57.BUNGE LIMITED: NET SALES, 2017–2019 ($MILLION)
FIGURE 58.BUNGE LIMITED: REVENUE SHARE BY SEGMENT, 2019 (%)
FIGURE 59.BUNGE LIMITED: REVENUE SHARE BY REGION, 2019 (%)
FIGURE 60.CARGILL, INCORPORATED : NET SALES, 2017–2019 ($MILLION)
FIGURE 61.FUJI OIL HOLDING INC.: NET SALES, 2017–2019 ($MILLION)
FIGURE 62.FUJI OIL HOLDING INC.: REVENUE SHARE BY SEGMENT, 2019 (%)
FIGURE 63.FUJI OIL HOLDING INC.: REVENUE SHARE BY REGION, 2019 (%)
FIGURE 64.INDO AGRI: NET SALES, 2017–2019 ($MILLION)
FIGURE 65.J-OIL MILLS INC: NET SALES, 2017–2019 ($MILLION)
FIGURE 66.J-OIL MILLS INC: REVENUE SHARE BY SEGMENT, 2019 (%)
FIGURE 67.LOUIS DREYFUS: NET SALES, 2017–2019 ($MILLION)
FIGURE 68.LOUIS DREYFUS: REVENUE SHARE BY REGION, 2019 (%)
FIGURE 69.WILMAR: NET SALES, 2017–2019 ($MILLION)
FIGURE 70.WILMAR: REVENUE SHARE BY SEGMENT, 2019 (%)
FIGURE 71.WILMAR: REVENUE SHARE BY REGION, 2019 (%)
Last decade have seen increasing trend of usage of organic cooking oils among the consumers. Furthermore, recent years have also seen introduction of algae cooking oil. Algae oil contains the lowest carbon footprints of all oils. It is resolving many concerns in the industry of food at present, including a high omega-9 profile, sustainability, and low saturated fat. In addition, algae cooking oil can be perfectly used for industrial frying, blending with other cooking oils and pan spraying. With multiple benefits offerings, algae oil to remain in cynosure for upcoming years as well
CXO further added, cooking oil such as corn oil, canola oil and soy oil are the richest nutritional sources of polyunsaturated fats, which helps in reducing the risk of heart disease, lowers bad cholesterol and others. This in turn has increases the consumer demand amongst health conscious consumers.
In addition, engaged players in the industry are paying high attention towards packaging in order to reduce carbon footprint and thus venturing into circular economy. Developed regions are spearing for paradigm shift with developing region to follow the suit soon
A. The market value of cooking oil in 2019 is $168.4 billion
A. The forecast period of cooking oil market is from 2021 to 2027.
A. 2019 is the base year for the calculations in the report
A. Major companies which are holding the market share of cooking oil market are Archer-Daniels-Midland Company, Bunge Limited, and Cargill Corporation.
A. Food service is the most influencing segment growing in the Cooking Oil Market report.
A. Palm oil holds the maximum market share in cooking oil market
A. The company profile has been selected on the basis of prominent players in the market.
A. The market value of cooking oil market in 2027 is $213.8 billion
Start reading instantly.
This Report and over 67,404+ more Reports, Available with Avenue Library. T&C*.
Enterprise
License/PDF
Library
Membership
*Taxes/Fees, if applicable will be added during checkout. All prices in USD
To ensure high-level data integrity, accurate analysis, and impeccable forecasts
For complete satisfaction
On-demand customization of scope of the report to exactly meet your needs
Targeted market view to provide pertinent information and save time of readers
Get insights on topics that are crucial for your business. Stay abreast of your interest areas.
Get Industry Data AlertsTo ensure high-level data integrity, accurate analysis, and impeccable forecasts
For complete satisfaction
On-demand customization of scope of the report to exactly meet your needs
Targeted market view to provide pertinent information and save time of readers