0
New
New
2023
Deep Learning Market

Deep Learning Market

by Component (Hardware, Software, Service), by Application (Image recognition, Signal recognition, Data mining, Others), by Industry Vertical (Security, Marketing, Automotive, Retail and E-Commerce, Healthcare, Manufacturing, Law, Others): Global Opportunity Analysis and Industry Forecast, 2023-2032

Report Code: A05450
Aug 2023 | Pages: 350
Tables: 136
Charts: 91
  • Formats*:

  • pdf

    Single User License, Five User
    License & Enterprise User License

  • xls

    Data Pack Excel License

  • ppt

    It comes with the additional cost
    of $2500.00 contact sales.


Deep Learning Market Research, 2032

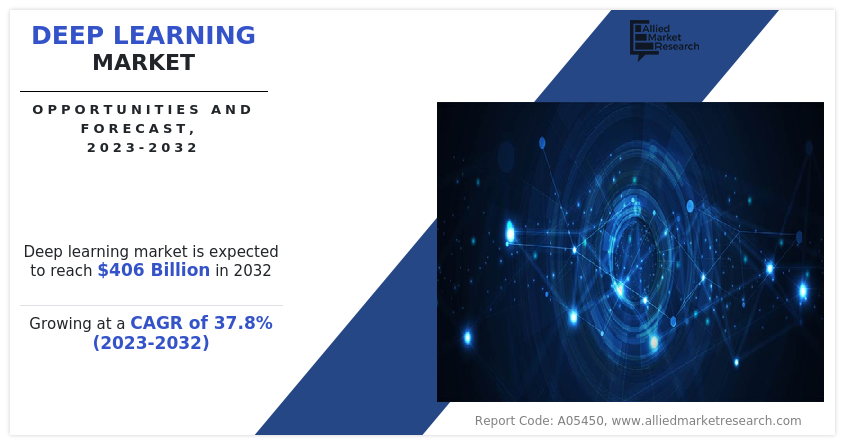
The global deep learning market was valued at $16.9 billion in 2022, and is projected to reach $406 billion by 2032, growing at a CAGR of 37.8% from 2023 to 2032.

Deep learning is a kind of artificial intelligence and machine learning technology that imitates human behavior to generate human brain cells-generated information. The technology is useful in performing classification tasks and recognizing patterns in photos, text, audio, and other data. In addition, it is utilized to automate jobs that ordinarily call for human intellect, such as annotating photographs and transcribing audio files.

The key factors that drive the growth of deep learning market include improving continuing power along with declining hardware cost and increasing adoption of cloud-based technology. Growing organizational demand for processing power and the deployment of Internet of Things (IoT) devices across a variety of industries are driving deep learning market growth. In addition, 2.5 quintillion bytes of new data are generated daily, and that figure is rising. Huge amounts of data generated by numerous industry sectors are creating profitable opportunities for deep learning solutions to give businesses effective, adaptable, and scalable insights. Furthermore, to assist clients, extract the information they require from a large dataset, cloud analytics combines technological, infrastructural, and analytical tools and methodologies. In addition, cloud-based deep learning analytics aid organizations in lowering their infrastructure and storage costs as well as operational expenditures.
The report focuses on growth prospects, restraints, and trends of the deep learning market analysis. The study provides Porter’s five forces analysis to understand the impact of various factors, such as bargaining power of suppliers, competitive intensity of competitors, threat of new entrants, threat of substitutes, and bargaining power of buyers, on the deep learning market.

COVID-19 had a major impact on the technological sector in a positive manner. Deep learning algorithms were used to assist in diagnosing and detecting COVID-19 cases from medical images, such as chest X-rays and CT scans. This increased demand for medical imaging analysis tools contributed to the growth of the deep learning market within the healthcare sector. Furthermore, deep learning models were employed in drug discovery and research efforts to identify potential drug compounds and predict protein structures.

Deep Learning Market

The deep learning market is segmented into Component, Application and Industry Vertical.

Segment Review

The deep learning market is segmented on the basis of component, application, industry vertical, technology, and region. In terms of components, the market is bifurcated into hardware, software, and service. By application, the market is divided into image recognition, signal recognition, data mining, and others. Based on industry vertical, it is divided into security, marketing, automotive, retail & e-commerce, healthcare, manufacturing, law, and others. On the basis of region, it is analyzed across North America, Europe, Asia-Pacific, and LAMEA.
Deep Learning Market

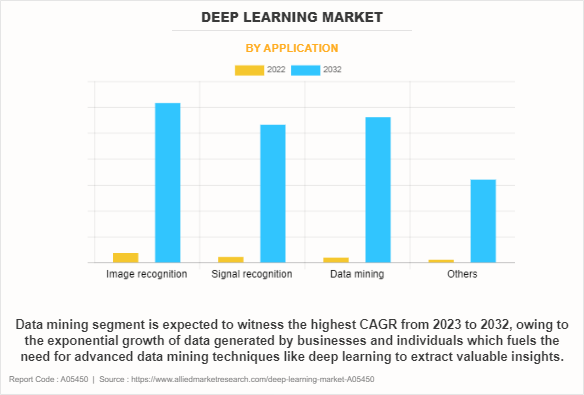
On the basis of application, data mining segment is expected to exhibit fastest CAGR during the deep learning market forecast. This is attributed to the fact that deep learning models can automatically recognize complex patterns, relationships, and correlations in data. This is particularly beneficial for data mining tasks like fraud detection, image recognition, and natural language processing.
Deep Learning Market

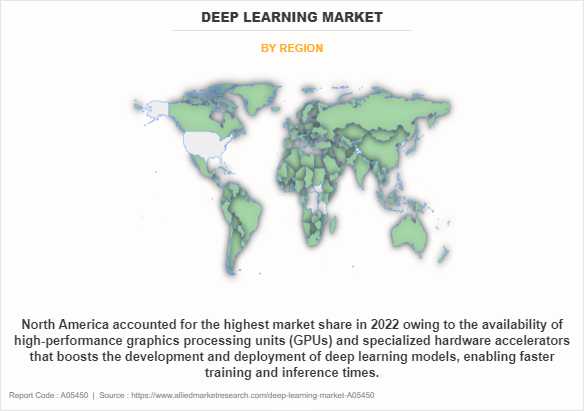
On the basis of region, North America dominated the deep learning market size in the year 2022. This is because of high investments and the availability of settled IT infrastructure in the region.

The report analyzes the profiles of key players operating in the deep learning market such as Advanced Micro Devices Inc., Amazon Web Services Inc., Google LLC, IBM Corporation, Intel Corporation, Microsoft Corporation, NVIDIA Corporation, Qualcomm Technologies, Inc., Samsung, and Xilinx. These players have adopted various strategies to increase their market penetration and strengthen their position in the deep learning industry.

Market Landscape and Trends

The expansion of deep learning market is driven by various trends such as continued advances in model architectures, pre-trained models with transfer learning, and explainable artificial intelligence (XAI). Researchers are continuously developing and refining deep neural network architectures to improve performance and efficiency. This includes innovations in convolutional neural networks (CNNs), recurrent neural networks (RNNs), transformers, and more. Furthermore, the use of pre-trained models for transfer learning is becoming increasingly popular. These models, trained on massive datasets, are fine-tuned for specific tasks, reducing the need for large amounts of labeled data. Moreover, there is a growing emphasis on making deep learning models more interpretable and explainable, as AI systems are applied to critical domains, to understand the reasoning behind model decisions.

Top Impacting Factors

Improving computing power and declining hardware cost

Growing organizational demand for processing power and the deployment of IoT devices across a variety of industries are driving market expansion. In addition, 2.5 quintillion bytes of new data are generated daily, and that figure is rising. Huge amounts of data generated by numerous industry sectors are creating profitable opportunities for deep learning solutions to give businesses effective, adaptable, and scalable insights. Furthermore, the banking, financial services, and insurance (BFSI) industry held the largest deep learning market share in 2020 due to the industry high production of sensitive data, rising cyberattack rate, and emphasis on customer data security and legal compliance, all of which contribute to the growth of deep learning industry.

Increasing adoption of cloud-based technology

Cloud-analytics is the amalgamation of technological, infrastructural, and analytical tools and techniques to help clients drive necessary information from a massive dataset. In addition, cloud-based deep learning analytics helps institutes to reduce their operational costs as well as to reduce infrastructure and storage costs of the organization. Furthermore, cloud-based deep learning analytics offers institutes superior security and provides enhanced safety to critical data of an organization, which provides lucrative opportunities for the market. In addition, cloud computing also helps institutes in analyzing large quantities of data sets and enhance their analytics skill, which propels the demand for deep learning in the future. Furthermore, the rapid adoption of connected devices across various education institutes and government initiatives to increase digitization across the industry vertically propels the growth of the market. For instance, in July 2020, the Australian Catholic University (ACU) turned its newly united data environment into a data lake to provide a single view of student development. It uses Microsoft’s Power BI and Azure data platform to support students who may need extra help or who are at risk of dropping out of the university entirely. Thus, this is considered as an important factor driving the growth of the market.

Key benefits for stakeholders

  • This report provides a quantitative analysis of the market segments, current trends, estimations, and dynamics of the deep learning market forecast from 2022 to 2032 to identify the prevailing market opportunities.
  • Market research is offered along with information related to key drivers, restraints, and opportunities of deep learning market outlook.
  • Porter's five forces analysis highlights the potency of buyers and suppliers to enable stakeholders to make profit-oriented business decisions and strengthen their supplier-buyer network.
  • In-depth analysis of the deep learning market segmentation assists in determining the prevailing deep learning market opportunity.
  • Major countries in each region are mapped according to their revenue contribution to the global market.
  • Market player positioning facilitates benchmarking and provides a clear understanding of the present position of the market players.
  • The report includes an analysis of the regional as well as global deep learning market trends, key players, market segments, application areas, and market growth strategies.

Deep Learning Market Report Highlights

Aspects Details
Market Size By 2032 USD 406 billion
Growth Rate CAGR of 37.8%
Forecast period 2022 - 2032
Report Pages 350
By Component
  • Software
  • Service
  • Hardware
By Application
  • Image recognition
  • Signal recognition
  • Data mining
  • Others
By Industry Vertical
  • Security
  • Marketing
  • Automotive
  • Retail and E-Commerce
  • Healthcare
  • Manufacturing
  • Law
  • Others
By Region
  • North America  (U.S., Canada)
  • Europe  (UK, Germany, France, Italy, Spain, Rest of Europe)
  • Asia-Pacific  (China, Japan, India, Australia, South Korea, Rest of Asia-Pacific)
  • LAMEA  (Latin America, Middle East, Africa)
Key Market Players Google LLC, Advanced Micro Devices Inc.(Xilinx Inc.), Qualcomm Technologies, Inc. , Amazon Web Services, Inc., IBM Corporation, NVIDIA Corporation, Intel Corporation, Xilinx, Microsoft Corporation, Samsung

Analyst Review

The adoption of deep learning has a profound impact on the ICT sector revolutionizing various aspects of the industry. The technology accounts for numerous uses in the ICT industry such as image and video analysis, natural language processing (NLP), speech recognition, recommendation systems, healthcare, finance, autonomous systems, manufacturing and industry, energy management, cybersecurity, supply chain management and virtual reality (VR)/augmented reality (AR). The technology helps in object detection, image classification, facial recognition, and video content understanding. This is particularly useful in areas like surveillance, autonomous vehicles, medical imaging, and entertainment. In addition, the technology enables better language understanding, sentiment analysis, language translation, text generation, chatbots, and others. These advancements have transformed customer support, content generation, and language-related services. Furthermore, deep learning is at the core of many state-of-the-art speech recognition systems, making voice interfaces more accurate and versatile. This technology is crucial for virtual assistants, voice commands, transcription services, and others.

The CXOs further added that market players are adopting strategies like partnership for enhancing their services in the market and improving customer satisfaction. For instance, in June 2023, Microsoft Corporation collaborated with HCL Technologies Inc.  to expand their strategic partnership to assist enterprises leverage generative artificial intelligence (AI) and develop joint solutions to enable businesses to achieve and enhance business transformation. In addition, in March 2023, Qualcomm Technologies Inc. collaborated with Ying Wu College of Computing to produce a federated learning system and zone federated learning the first end-to-end, mobile cloud federated learning systems that function on smartphones. Therefore, such strategies are expected to boost the growth of the deep learning market in the upcoming years.


  • CHAPTER 1: INTRODUCTION

    • 1.1. Report description

    • 1.2. Key market segments

    • 1.3. Key benefits to the stakeholders

    • 1.4. Research Methodology

      • 1.4.1. Primary research

      • 1.4.2. Secondary research

      • 1.4.3. Analyst tools and models

  • CHAPTER 2: EXECUTIVE SUMMARY

    • 2.1. CXO Perspective

  • CHAPTER 3: MARKET OVERVIEW

    • 3.1. Market definition and scope

    • 3.2. Key findings

      • 3.2.1. Top impacting factors

      • 3.2.2. Top investment pockets

    • 3.3. Porter’s five forces analysis

      • 3.3.1. Moderate-to-high bargaining power of suppliers

      • 3.3.2. Moderate-to-high threat of new entrants

      • 3.3.3. Low -to-moderate threat of substitutes

      • 3.3.4. Moderate-to-high intensity of rivalry

      • 3.3.5. Moderate-to-high bargaining power of buyers

    • 3.4. Market dynamics

      • 3.4.1. Drivers

        • 3.4.1.1. Decline in hardware cost
        • 3.4.1.2. Increase in data availability and advancements in the hardware
        • 3.4.1.3. Increasing investment in research and development to support deep learning

      • 3.4.2. Restraints

        • 3.4.2.1. Increase in complexity in hardware due to complex algorithm used in technology
        • 3.4.2.2. Lack of technical expertise & absence of standards and protocols

      • 3.4.3. Opportunities

        • 3.4.3.1. Cumulative spending in healthcare and manufacturing industry

    • 3.5. COVID-19 Impact Analysis on the market

  • CHAPTER 4: DEEP LEARNING MARKET, BY COMPONENT

    • 4.1. Overview

      • 4.1.1. Market size and forecast

    • 4.2. Hardware

      • 4.2.1. Key market trends, growth factors and opportunities

      • 4.2.2. Market size and forecast, by region

      • 4.2.3. Market share analysis by country

    • 4.3. Software

      • 4.3.1. Key market trends, growth factors and opportunities

      • 4.3.2. Market size and forecast, by region

      • 4.3.3. Market share analysis by country

    • 4.4. Service

      • 4.4.1. Key market trends, growth factors and opportunities

      • 4.4.2. Market size and forecast, by region

      • 4.4.3. Market share analysis by country

  • CHAPTER 5: DEEP LEARNING MARKET, BY APPLICATION

    • 5.1. Overview

      • 5.1.1. Market size and forecast

    • 5.2. Image recognition

      • 5.2.1. Key market trends, growth factors and opportunities

      • 5.2.2. Market size and forecast, by region

      • 5.2.3. Market share analysis by country

    • 5.3. Signal recognition

      • 5.3.1. Key market trends, growth factors and opportunities

      • 5.3.2. Market size and forecast, by region

      • 5.3.3. Market share analysis by country

    • 5.4. Data mining

      • 5.4.1. Key market trends, growth factors and opportunities

      • 5.4.2. Market size and forecast, by region

      • 5.4.3. Market share analysis by country

    • 5.5. Others

      • 5.5.1. Key market trends, growth factors and opportunities

      • 5.5.2. Market size and forecast, by region

      • 5.5.3. Market share analysis by country

  • CHAPTER 6: DEEP LEARNING MARKET, BY INDUSTRY VERTICAL

    • 6.1. Overview

      • 6.1.1. Market size and forecast

    • 6.2. Security

      • 6.2.1. Key market trends, growth factors and opportunities

      • 6.2.2. Market size and forecast, by region

      • 6.2.3. Market share analysis by country

    • 6.3. Marketing

      • 6.3.1. Key market trends, growth factors and opportunities

      • 6.3.2. Market size and forecast, by region

      • 6.3.3. Market share analysis by country

    • 6.4. Automotive

      • 6.4.1. Key market trends, growth factors and opportunities

      • 6.4.2. Market size and forecast, by region

      • 6.4.3. Market share analysis by country

    • 6.5. Retail and E-Commerce

      • 6.5.1. Key market trends, growth factors and opportunities

      • 6.5.2. Market size and forecast, by region

      • 6.5.3. Market share analysis by country

    • 6.6. Healthcare

      • 6.6.1. Key market trends, growth factors and opportunities

      • 6.6.2. Market size and forecast, by region

      • 6.6.3. Market share analysis by country

    • 6.7. Manufacturing

      • 6.7.1. Key market trends, growth factors and opportunities

      • 6.7.2. Market size and forecast, by region

      • 6.7.3. Market share analysis by country

    • 6.8. Law

      • 6.8.1. Key market trends, growth factors and opportunities

      • 6.8.2. Market size and forecast, by region

      • 6.8.3. Market share analysis by country

    • 6.9. Others

      • 6.9.1. Key market trends, growth factors and opportunities

      • 6.9.2. Market size and forecast, by region

      • 6.9.3. Market share analysis by country

  • CHAPTER 7: DEEP LEARNING MARKET, BY REGION

    • 7.1. Overview

      • 7.1.1. Market size and forecast By Region

    • 7.2. North America

      • 7.2.1. Key market trends, growth factors and opportunities

      • 7.2.2. Market size and forecast, by Component

      • 7.2.3. Market size and forecast, by Application

      • 7.2.4. Market size and forecast, by Industry Vertical

      • 7.2.5. Market size and forecast, by country

        • 7.2.5.1. U.S.
          • 7.2.5.1.1. Market size and forecast, by Component
          • 7.2.5.1.2. Market size and forecast, by Application
          • 7.2.5.1.3. Market size and forecast, by Industry Vertical
        • 7.2.5.2. Canada
          • 7.2.5.2.1. Market size and forecast, by Component
          • 7.2.5.2.2. Market size and forecast, by Application
          • 7.2.5.2.3. Market size and forecast, by Industry Vertical
    • 7.3. Europe

      • 7.3.1. Key market trends, growth factors and opportunities

      • 7.3.2. Market size and forecast, by Component

      • 7.3.3. Market size and forecast, by Application

      • 7.3.4. Market size and forecast, by Industry Vertical

      • 7.3.5. Market size and forecast, by country

        • 7.3.5.1. UK
          • 7.3.5.1.1. Market size and forecast, by Component
          • 7.3.5.1.2. Market size and forecast, by Application
          • 7.3.5.1.3. Market size and forecast, by Industry Vertical
        • 7.3.5.2. Germany
          • 7.3.5.2.1. Market size and forecast, by Component
          • 7.3.5.2.2. Market size and forecast, by Application
          • 7.3.5.2.3. Market size and forecast, by Industry Vertical
        • 7.3.5.3. France
          • 7.3.5.3.1. Market size and forecast, by Component
          • 7.3.5.3.2. Market size and forecast, by Application
          • 7.3.5.3.3. Market size and forecast, by Industry Vertical
        • 7.3.5.4. Italy
          • 7.3.5.4.1. Market size and forecast, by Component
          • 7.3.5.4.2. Market size and forecast, by Application
          • 7.3.5.4.3. Market size and forecast, by Industry Vertical
        • 7.3.5.5. Spain
          • 7.3.5.5.1. Market size and forecast, by Component
          • 7.3.5.5.2. Market size and forecast, by Application
          • 7.3.5.5.3. Market size and forecast, by Industry Vertical
        • 7.3.5.6. Rest of Europe
          • 7.3.5.6.1. Market size and forecast, by Component
          • 7.3.5.6.2. Market size and forecast, by Application
          • 7.3.5.6.3. Market size and forecast, by Industry Vertical
    • 7.4. Asia-Pacific

      • 7.4.1. Key market trends, growth factors and opportunities

      • 7.4.2. Market size and forecast, by Component

      • 7.4.3. Market size and forecast, by Application

      • 7.4.4. Market size and forecast, by Industry Vertical

      • 7.4.5. Market size and forecast, by country

        • 7.4.5.1. China
          • 7.4.5.1.1. Market size and forecast, by Component
          • 7.4.5.1.2. Market size and forecast, by Application
          • 7.4.5.1.3. Market size and forecast, by Industry Vertical
        • 7.4.5.2. Japan
          • 7.4.5.2.1. Market size and forecast, by Component
          • 7.4.5.2.2. Market size and forecast, by Application
          • 7.4.5.2.3. Market size and forecast, by Industry Vertical
        • 7.4.5.3. India
          • 7.4.5.3.1. Market size and forecast, by Component
          • 7.4.5.3.2. Market size and forecast, by Application
          • 7.4.5.3.3. Market size and forecast, by Industry Vertical
        • 7.4.5.4. Australia
          • 7.4.5.4.1. Market size and forecast, by Component
          • 7.4.5.4.2. Market size and forecast, by Application
          • 7.4.5.4.3. Market size and forecast, by Industry Vertical
        • 7.4.5.5. South Korea
          • 7.4.5.5.1. Market size and forecast, by Component
          • 7.4.5.5.2. Market size and forecast, by Application
          • 7.4.5.5.3. Market size and forecast, by Industry Vertical
        • 7.4.5.6. Rest of Asia-Pacific
          • 7.4.5.6.1. Market size and forecast, by Component
          • 7.4.5.6.2. Market size and forecast, by Application
          • 7.4.5.6.3. Market size and forecast, by Industry Vertical
    • 7.5. LAMEA

      • 7.5.1. Key market trends, growth factors and opportunities

      • 7.5.2. Market size and forecast, by Component

      • 7.5.3. Market size and forecast, by Application

      • 7.5.4. Market size and forecast, by Industry Vertical

      • 7.5.5. Market size and forecast, by country

        • 7.5.5.1. Latin America
          • 7.5.5.1.1. Market size and forecast, by Component
          • 7.5.5.1.2. Market size and forecast, by Application
          • 7.5.5.1.3. Market size and forecast, by Industry Vertical
        • 7.5.5.2. Middle East
          • 7.5.5.2.1. Market size and forecast, by Component
          • 7.5.5.2.2. Market size and forecast, by Application
          • 7.5.5.2.3. Market size and forecast, by Industry Vertical
        • 7.5.5.3. Africa
          • 7.5.5.3.1. Market size and forecast, by Component
          • 7.5.5.3.2. Market size and forecast, by Application
          • 7.5.5.3.3. Market size and forecast, by Industry Vertical
  • CHAPTER 8: COMPETITIVE LANDSCAPE

    • 8.1. Introduction

    • 8.2. Top winning strategies

    • 8.3. Product Mapping of Top 10 Player

    • 8.4. Competitive Dashboard

    • 8.5. Competitive Heatmap

    • 8.6. Top player positioning, 2022

  • CHAPTER 9: COMPANY PROFILES

    • 9.1. Advanced Micro Devices Inc.(Xilinx Inc.)

      • 9.1.1. Company overview

      • 9.1.2. Key Executives

      • 9.1.3. Company snapshot

      • 9.1.4. Operating business segments

      • 9.1.5. Product portfolio

      • 9.1.6. Business performance

      • 9.1.7. Key strategic moves and developments

    • 9.2. Amazon Web Services, Inc.

      • 9.2.1. Company overview

      • 9.2.2. Key Executives

      • 9.2.3. Company snapshot

      • 9.2.4. Operating business segments

      • 9.2.5. Product portfolio

      • 9.2.6. Business performance

      • 9.2.7. Key strategic moves and developments

    • 9.3. Google LLC

      • 9.3.1. Company overview

      • 9.3.2. Key Executives

      • 9.3.3. Company snapshot

      • 9.3.4. Operating business segments

      • 9.3.5. Product portfolio

      • 9.3.6. Business performance

      • 9.3.7. Key strategic moves and developments

    • 9.4. IBM Corporation

      • 9.4.1. Company overview

      • 9.4.2. Key Executives

      • 9.4.3. Company snapshot

      • 9.4.4. Operating business segments

      • 9.4.5. Product portfolio

      • 9.4.6. Business performance

      • 9.4.7. Key strategic moves and developments

    • 9.5. Intel Corporation

      • 9.5.1. Company overview

      • 9.5.2. Key Executives

      • 9.5.3. Company snapshot

      • 9.5.4. Operating business segments

      • 9.5.5. Product portfolio

      • 9.5.6. Business performance

      • 9.5.7. Key strategic moves and developments

    • 9.6. Microsoft Corporation

      • 9.6.1. Company overview

      • 9.6.2. Key Executives

      • 9.6.3. Company snapshot

      • 9.6.4. Operating business segments

      • 9.6.5. Product portfolio

      • 9.6.6. Business performance

      • 9.6.7. Key strategic moves and developments

    • 9.7. NVIDIA Corporation

      • 9.7.1. Company overview

      • 9.7.2. Key Executives

      • 9.7.3. Company snapshot

      • 9.7.4. Operating business segments

      • 9.7.5. Product portfolio

      • 9.7.6. Business performance

      • 9.7.7. Key strategic moves and developments

    • 9.8. Qualcomm Technologies, Inc. 

      • 9.8.1. Company overview

      • 9.8.2. Key Executives

      • 9.8.3. Company snapshot

      • 9.8.4. Operating business segments

      • 9.8.5. Product portfolio

      • 9.8.6. Business performance

      • 9.8.7. Key strategic moves and developments

    • 9.9. Samsung

      • 9.9.1. Company overview

      • 9.9.2. Key Executives

      • 9.9.3. Company snapshot

      • 9.9.4. Operating business segments

      • 9.9.5. Product portfolio

      • 9.9.6. Business performance

      • 9.9.7. Key strategic moves and developments

    • 9.10. Xilinx

      • 9.10.1. Company overview

      • 9.10.2. Key Executives

      • 9.10.3. Company snapshot

      • 9.10.4. Operating business segments

      • 9.10.5. Product portfolio

      • 9.10.6. Business performance

      • 9.10.7. Key strategic moves and developments

  • LIST OF TABLES

  • TABLE 01. GLOBAL DEEP LEARNING MARKET, BY COMPONENT, 2022-2032 ($MILLION)
    TABLE 02. DEEP LEARNING MARKET FOR HARDWARE, BY REGION, 2022-2032 ($MILLION)
    TABLE 03. DEEP LEARNING MARKET FOR SOFTWARE, BY REGION, 2022-2032 ($MILLION)
    TABLE 04. DEEP LEARNING MARKET FOR SERVICE, BY REGION, 2022-2032 ($MILLION)
    TABLE 05. GLOBAL DEEP LEARNING MARKET, BY APPLICATION, 2022-2032 ($MILLION)
    TABLE 06. DEEP LEARNING MARKET FOR IMAGE RECOGNITION, BY REGION, 2022-2032 ($MILLION)
    TABLE 07. DEEP LEARNING MARKET FOR SIGNAL RECOGNITION, BY REGION, 2022-2032 ($MILLION)
    TABLE 08. DEEP LEARNING MARKET FOR DATA MINING, BY REGION, 2022-2032 ($MILLION)
    TABLE 09. DEEP LEARNING MARKET FOR OTHERS, BY REGION, 2022-2032 ($MILLION)
    TABLE 10. GLOBAL DEEP LEARNING MARKET, BY INDUSTRY VERTICAL, 2022-2032 ($MILLION)
    TABLE 11. DEEP LEARNING MARKET FOR SECURITY, BY REGION, 2022-2032 ($MILLION)
    TABLE 12. DEEP LEARNING MARKET FOR MARKETING, BY REGION, 2022-2032 ($MILLION)
    TABLE 13. DEEP LEARNING MARKET FOR AUTOMOTIVE, BY REGION, 2022-2032 ($MILLION)
    TABLE 14. DEEP LEARNING MARKET FOR RETAIL AND E-COMMERCE, BY REGION, 2022-2032 ($MILLION)
    TABLE 15. DEEP LEARNING MARKET FOR HEALTHCARE, BY REGION, 2022-2032 ($MILLION)
    TABLE 16. DEEP LEARNING MARKET FOR MANUFACTURING, BY REGION, 2022-2032 ($MILLION)
    TABLE 17. DEEP LEARNING MARKET FOR LAW, BY REGION, 2022-2032 ($MILLION)
    TABLE 18. DEEP LEARNING MARKET FOR OTHERS, BY REGION, 2022-2032 ($MILLION)
    TABLE 19. DEEP LEARNING MARKET, BY REGION, 2022-2032 ($MILLION)
    TABLE 20. NORTH AMERICA DEEP LEARNING MARKET, BY COMPONENT, 2022-2032 ($MILLION)
    TABLE 21. NORTH AMERICA DEEP LEARNING MARKET, BY APPLICATION, 2022-2032 ($MILLION)
    TABLE 22. NORTH AMERICA DEEP LEARNING MARKET, BY INDUSTRY VERTICAL, 2022-2032 ($MILLION)
    TABLE 23. NORTH AMERICA DEEP LEARNING MARKET, BY COUNTRY, 2022-2032 ($MILLION)
    TABLE 24. U.S. DEEP LEARNING MARKET, BY COMPONENT, 2022-2032 ($MILLION)
    TABLE 25. U.S. DEEP LEARNING MARKET, BY APPLICATION, 2022-2032 ($MILLION)
    TABLE 26. U.S. DEEP LEARNING MARKET, BY INDUSTRY VERTICAL, 2022-2032 ($MILLION)
    TABLE 27. CANADA DEEP LEARNING MARKET, BY COMPONENT, 2022-2032 ($MILLION)
    TABLE 28. CANADA DEEP LEARNING MARKET, BY APPLICATION, 2022-2032 ($MILLION)
    TABLE 29. CANADA DEEP LEARNING MARKET, BY INDUSTRY VERTICAL, 2022-2032 ($MILLION)
    TABLE 30. EUROPE DEEP LEARNING MARKET, BY COMPONENT, 2022-2032 ($MILLION)
    TABLE 31. EUROPE DEEP LEARNING MARKET, BY APPLICATION, 2022-2032 ($MILLION)
    TABLE 32. EUROPE DEEP LEARNING MARKET, BY INDUSTRY VERTICAL, 2022-2032 ($MILLION)
    TABLE 33. EUROPE DEEP LEARNING MARKET, BY COUNTRY, 2022-2032 ($MILLION)
    TABLE 34. UK DEEP LEARNING MARKET, BY COMPONENT, 2022-2032 ($MILLION)
    TABLE 35. UK DEEP LEARNING MARKET, BY APPLICATION, 2022-2032 ($MILLION)
    TABLE 36. UK DEEP LEARNING MARKET, BY INDUSTRY VERTICAL, 2022-2032 ($MILLION)
    TABLE 37. GERMANY DEEP LEARNING MARKET, BY COMPONENT, 2022-2032 ($MILLION)
    TABLE 38. GERMANY DEEP LEARNING MARKET, BY APPLICATION, 2022-2032 ($MILLION)
    TABLE 39. GERMANY DEEP LEARNING MARKET, BY INDUSTRY VERTICAL, 2022-2032 ($MILLION)
    TABLE 40. FRANCE DEEP LEARNING MARKET, BY COMPONENT, 2022-2032 ($MILLION)
    TABLE 41. FRANCE DEEP LEARNING MARKET, BY APPLICATION, 2022-2032 ($MILLION)
    TABLE 42. FRANCE DEEP LEARNING MARKET, BY INDUSTRY VERTICAL, 2022-2032 ($MILLION)
    TABLE 43. ITALY DEEP LEARNING MARKET, BY COMPONENT, 2022-2032 ($MILLION)
    TABLE 44. ITALY DEEP LEARNING MARKET, BY APPLICATION, 2022-2032 ($MILLION)
    TABLE 45. ITALY DEEP LEARNING MARKET, BY INDUSTRY VERTICAL, 2022-2032 ($MILLION)
    TABLE 46. SPAIN DEEP LEARNING MARKET, BY COMPONENT, 2022-2032 ($MILLION)
    TABLE 47. SPAIN DEEP LEARNING MARKET, BY APPLICATION, 2022-2032 ($MILLION)
    TABLE 48. SPAIN DEEP LEARNING MARKET, BY INDUSTRY VERTICAL, 2022-2032 ($MILLION)
    TABLE 49. REST OF EUROPE DEEP LEARNING MARKET, BY COMPONENT, 2022-2032 ($MILLION)
    TABLE 50. REST OF EUROPE DEEP LEARNING MARKET, BY APPLICATION, 2022-2032 ($MILLION)
    TABLE 51. REST OF EUROPE DEEP LEARNING MARKET, BY INDUSTRY VERTICAL, 2022-2032 ($MILLION)
    TABLE 52. ASIA-PACIFIC DEEP LEARNING MARKET, BY COMPONENT, 2022-2032 ($MILLION)
    TABLE 53. ASIA-PACIFIC DEEP LEARNING MARKET, BY APPLICATION, 2022-2032 ($MILLION)
    TABLE 54. ASIA-PACIFIC DEEP LEARNING MARKET, BY INDUSTRY VERTICAL, 2022-2032 ($MILLION)
    TABLE 55. ASIA-PACIFIC DEEP LEARNING MARKET, BY COUNTRY, 2022-2032 ($MILLION)
    TABLE 56. CHINA DEEP LEARNING MARKET, BY COMPONENT, 2022-2032 ($MILLION)
    TABLE 57. CHINA DEEP LEARNING MARKET, BY APPLICATION, 2022-2032 ($MILLION)
    TABLE 58. CHINA DEEP LEARNING MARKET, BY INDUSTRY VERTICAL, 2022-2032 ($MILLION)
    TABLE 59. JAPAN DEEP LEARNING MARKET, BY COMPONENT, 2022-2032 ($MILLION)
    TABLE 60. JAPAN DEEP LEARNING MARKET, BY APPLICATION, 2022-2032 ($MILLION)
    TABLE 61. JAPAN DEEP LEARNING MARKET, BY INDUSTRY VERTICAL, 2022-2032 ($MILLION)
    TABLE 62. INDIA DEEP LEARNING MARKET, BY COMPONENT, 2022-2032 ($MILLION)
    TABLE 63. INDIA DEEP LEARNING MARKET, BY APPLICATION, 2022-2032 ($MILLION)
    TABLE 64. INDIA DEEP LEARNING MARKET, BY INDUSTRY VERTICAL, 2022-2032 ($MILLION)
    TABLE 65. AUSTRALIA DEEP LEARNING MARKET, BY COMPONENT, 2022-2032 ($MILLION)
    TABLE 66. AUSTRALIA DEEP LEARNING MARKET, BY APPLICATION, 2022-2032 ($MILLION)
    TABLE 67. AUSTRALIA DEEP LEARNING MARKET, BY INDUSTRY VERTICAL, 2022-2032 ($MILLION)
    TABLE 68. SOUTH KOREA DEEP LEARNING MARKET, BY COMPONENT, 2022-2032 ($MILLION)
    TABLE 69. SOUTH KOREA DEEP LEARNING MARKET, BY APPLICATION, 2022-2032 ($MILLION)
    TABLE 70. SOUTH KOREA DEEP LEARNING MARKET, BY INDUSTRY VERTICAL, 2022-2032 ($MILLION)
    TABLE 71. REST OF ASIA-PACIFIC DEEP LEARNING MARKET, BY COMPONENT, 2022-2032 ($MILLION)
    TABLE 72. REST OF ASIA-PACIFIC DEEP LEARNING MARKET, BY APPLICATION, 2022-2032 ($MILLION)
    TABLE 73. REST OF ASIA-PACIFIC DEEP LEARNING MARKET, BY INDUSTRY VERTICAL, 2022-2032 ($MILLION)
    TABLE 74. LAMEA DEEP LEARNING MARKET, BY COMPONENT, 2022-2032 ($MILLION)
    TABLE 75. LAMEA DEEP LEARNING MARKET, BY APPLICATION, 2022-2032 ($MILLION)
    TABLE 76. LAMEA DEEP LEARNING MARKET, BY INDUSTRY VERTICAL, 2022-2032 ($MILLION)
    TABLE 77. LAMEA DEEP LEARNING MARKET, BY COUNTRY, 2022-2032 ($MILLION)
    TABLE 78. LATIN AMERICA DEEP LEARNING MARKET, BY COMPONENT, 2022-2032 ($MILLION)
    TABLE 79. LATIN AMERICA DEEP LEARNING MARKET, BY APPLICATION, 2022-2032 ($MILLION)
    TABLE 80. LATIN AMERICA DEEP LEARNING MARKET, BY INDUSTRY VERTICAL, 2022-2032 ($MILLION)
    TABLE 81. MIDDLE EAST DEEP LEARNING MARKET, BY COMPONENT, 2022-2032 ($MILLION)
    TABLE 82. MIDDLE EAST DEEP LEARNING MARKET, BY APPLICATION, 2022-2032 ($MILLION)
    TABLE 83. MIDDLE EAST DEEP LEARNING MARKET, BY INDUSTRY VERTICAL, 2022-2032 ($MILLION)
    TABLE 84. AFRICA DEEP LEARNING MARKET, BY COMPONENT, 2022-2032 ($MILLION)
    TABLE 85. AFRICA DEEP LEARNING MARKET, BY APPLICATION, 2022-2032 ($MILLION)
    TABLE 86. AFRICA DEEP LEARNING MARKET, BY INDUSTRY VERTICAL, 2022-2032 ($MILLION)
    TABLE 87. ADVANCED MICRO DEVICES INC.(XILINX INC.): KEY EXECUTIVES
    TABLE 88. ADVANCED MICRO DEVICES INC.(XILINX INC.): COMPANY SNAPSHOT
    TABLE 89. ADVANCED MICRO DEVICES INC.(XILINX INC.): PRODUCT SEGMENTS
    TABLE 90. ADVANCED MICRO DEVICES INC.(XILINX INC.): PRODUCT PORTFOLIO
    TABLE 91. ADVANCED MICRO DEVICES INC.(XILINX INC.): KEY STRATERGIES
    TABLE 92. AMAZON WEB SERVICES, INC.: KEY EXECUTIVES
    TABLE 93. AMAZON WEB SERVICES, INC.: COMPANY SNAPSHOT
    TABLE 94. AMAZON WEB SERVICES, INC.: SERVICE SEGMENTS
    TABLE 95. AMAZON WEB SERVICES, INC.: PRODUCT PORTFOLIO
    TABLE 96. AMAZON WEB SERVICES, INC.: KEY STRATERGIES
    TABLE 97. GOOGLE LLC: KEY EXECUTIVES
    TABLE 98. GOOGLE LLC: COMPANY SNAPSHOT
    TABLE 99. GOOGLE LLC: SERVICE SEGMENTS
    TABLE 100. GOOGLE LLC: PRODUCT PORTFOLIO
    TABLE 101. GOOGLE LLC: KEY STRATERGIES
    TABLE 102. IBM CORPORATION: KEY EXECUTIVES
    TABLE 103. IBM CORPORATION: COMPANY SNAPSHOT
    TABLE 104. IBM CORPORATION: SERVICE SEGMENTS
    TABLE 105. IBM CORPORATION: PRODUCT PORTFOLIO
    TABLE 106. IBM CORPORATION: KEY STRATERGIES
    TABLE 107. INTEL CORPORATION: KEY EXECUTIVES
    TABLE 108. INTEL CORPORATION: COMPANY SNAPSHOT
    TABLE 109. INTEL CORPORATION: PRODUCT SEGMENTS
    TABLE 110. INTEL CORPORATION: PRODUCT PORTFOLIO
    TABLE 111. INTEL CORPORATION: KEY STRATERGIES
    TABLE 112. MICROSOFT CORPORATION: KEY EXECUTIVES
    TABLE 113. MICROSOFT CORPORATION: COMPANY SNAPSHOT
    TABLE 114. MICROSOFT CORPORATION: SERVICE SEGMENTS
    TABLE 115. MICROSOFT CORPORATION: PRODUCT PORTFOLIO
    TABLE 116. MICROSOFT CORPORATION: KEY STRATERGIES
    TABLE 117. NVIDIA CORPORATION: KEY EXECUTIVES
    TABLE 118. NVIDIA CORPORATION: COMPANY SNAPSHOT
    TABLE 119. NVIDIA CORPORATION: PRODUCT SEGMENTS
    TABLE 120. NVIDIA CORPORATION: PRODUCT PORTFOLIO
    TABLE 121. NVIDIA CORPORATION: KEY STRATERGIES
    TABLE 122. QUALCOMM TECHNOLOGIES, INC. : KEY EXECUTIVES
    TABLE 123. QUALCOMM TECHNOLOGIES, INC. : COMPANY SNAPSHOT
    TABLE 124. QUALCOMM TECHNOLOGIES, INC. : SERVICE SEGMENTS
    TABLE 125. QUALCOMM TECHNOLOGIES, INC. : PRODUCT PORTFOLIO
    TABLE 126. QUALCOMM TECHNOLOGIES, INC. : KEY STRATERGIES
    TABLE 127. SAMSUNG: KEY EXECUTIVES
    TABLE 128. SAMSUNG: COMPANY SNAPSHOT
    TABLE 129. SAMSUNG: SERVICE SEGMENTS
    TABLE 130. SAMSUNG: PRODUCT PORTFOLIO
    TABLE 131. SAMSUNG: KEY STRATERGIES
    TABLE 132. XILINX: KEY EXECUTIVES
    TABLE 133. XILINX: COMPANY SNAPSHOT
    TABLE 134. XILINX: SERVICE SEGMENTS
    TABLE 135. XILINX: PRODUCT PORTFOLIO
    TABLE 136. XILINX: KEY STRATERGIES
  • LIST OF FIGURES

  • FIGURE 01. DEEP LEARNING MARKET, 2022-2032
    FIGURE 02. SEGMENTATION OF DEEP LEARNING MARKET,2022-2032
    FIGURE 03. TOP INVESTMENT POCKETS IN DEEP LEARNING MARKET (2023-2032)
    FIGURE 04. BARGAINING POWER OF SUPPLIERS
    FIGURE 05. BARGAINING POWER OF BUYERS
    FIGURE 06. THREAT OF SUBSTITUTION
    FIGURE 07. THREAT OF SUBSTITUTION
    FIGURE 08. COMPETITIVE RIVALRY
    FIGURE 09. GLOBAL DEEP LEARNING MARKET:DRIVERS, RESTRAINTS AND OPPORTUNITIES
    FIGURE 10. DEEP LEARNING MARKET, BY COMPONENT, 2022(%)
    FIGURE 11. COMPARATIVE SHARE ANALYSIS OF DEEP LEARNING MARKET FOR HARDWARE, BY COUNTRY 2022 AND 2032(%)
    FIGURE 12. COMPARATIVE SHARE ANALYSIS OF DEEP LEARNING MARKET FOR SOFTWARE, BY COUNTRY 2022 AND 2032(%)
    FIGURE 13. COMPARATIVE SHARE ANALYSIS OF DEEP LEARNING MARKET FOR SERVICE, BY COUNTRY 2022 AND 2032(%)
    FIGURE 14. DEEP LEARNING MARKET, BY APPLICATION, 2022(%)
    FIGURE 15. COMPARATIVE SHARE ANALYSIS OF DEEP LEARNING MARKET FOR IMAGE RECOGNITION, BY COUNTRY 2022 AND 2032(%)
    FIGURE 16. COMPARATIVE SHARE ANALYSIS OF DEEP LEARNING MARKET FOR SIGNAL RECOGNITION, BY COUNTRY 2022 AND 2032(%)
    FIGURE 17. COMPARATIVE SHARE ANALYSIS OF DEEP LEARNING MARKET FOR DATA MINING, BY COUNTRY 2022 AND 2032(%)
    FIGURE 18. COMPARATIVE SHARE ANALYSIS OF DEEP LEARNING MARKET FOR OTHERS, BY COUNTRY 2022 AND 2032(%)
    FIGURE 19. DEEP LEARNING MARKET, BY INDUSTRY VERTICAL, 2022(%)
    FIGURE 20. COMPARATIVE SHARE ANALYSIS OF DEEP LEARNING MARKET FOR SECURITY, BY COUNTRY 2022 AND 2032(%)
    FIGURE 21. COMPARATIVE SHARE ANALYSIS OF DEEP LEARNING MARKET FOR MARKETING, BY COUNTRY 2022 AND 2032(%)
    FIGURE 22. COMPARATIVE SHARE ANALYSIS OF DEEP LEARNING MARKET FOR AUTOMOTIVE, BY COUNTRY 2022 AND 2032(%)
    FIGURE 23. COMPARATIVE SHARE ANALYSIS OF DEEP LEARNING MARKET FOR RETAIL AND E-COMMERCE, BY COUNTRY 2022 AND 2032(%)
    FIGURE 24. COMPARATIVE SHARE ANALYSIS OF DEEP LEARNING MARKET FOR HEALTHCARE, BY COUNTRY 2022 AND 2032(%)
    FIGURE 25. COMPARATIVE SHARE ANALYSIS OF DEEP LEARNING MARKET FOR MANUFACTURING, BY COUNTRY 2022 AND 2032(%)
    FIGURE 26. COMPARATIVE SHARE ANALYSIS OF DEEP LEARNING MARKET FOR LAW, BY COUNTRY 2022 AND 2032(%)
    FIGURE 27. COMPARATIVE SHARE ANALYSIS OF DEEP LEARNING MARKET FOR OTHERS, BY COUNTRY 2022 AND 2032(%)
    FIGURE 28. DEEP LEARNING MARKET BY REGION, 2022(%)
    FIGURE 29. U.S. DEEP LEARNING MARKET, 2022-2032 ($MILLION)
    FIGURE 30. CANADA DEEP LEARNING MARKET, 2022-2032 ($MILLION)
    FIGURE 31. UK DEEP LEARNING MARKET, 2022-2032 ($MILLION)
    FIGURE 32. GERMANY DEEP LEARNING MARKET, 2022-2032 ($MILLION)
    FIGURE 33. FRANCE DEEP LEARNING MARKET, 2022-2032 ($MILLION)
    FIGURE 34. ITALY DEEP LEARNING MARKET, 2022-2032 ($MILLION)
    FIGURE 35. SPAIN DEEP LEARNING MARKET, 2022-2032 ($MILLION)
    FIGURE 36. REST OF EUROPE DEEP LEARNING MARKET, 2022-2032 ($MILLION)
    FIGURE 37. CHINA DEEP LEARNING MARKET, 2022-2032 ($MILLION)
    FIGURE 38. JAPAN DEEP LEARNING MARKET, 2022-2032 ($MILLION)
    FIGURE 39. INDIA DEEP LEARNING MARKET, 2022-2032 ($MILLION)
    FIGURE 40. AUSTRALIA DEEP LEARNING MARKET, 2022-2032 ($MILLION)
    FIGURE 41. SOUTH KOREA DEEP LEARNING MARKET, 2022-2032 ($MILLION)
    FIGURE 42. REST OF ASIA-PACIFIC DEEP LEARNING MARKET, 2022-2032 ($MILLION)
    FIGURE 43. LATIN AMERICA DEEP LEARNING MARKET, 2022-2032 ($MILLION)
    FIGURE 44. MIDDLE EAST DEEP LEARNING MARKET, 2022-2032 ($MILLION)
    FIGURE 45. AFRICA DEEP LEARNING MARKET, 2022-2032 ($MILLION)
    FIGURE 46. TOP WINNING STRATEGIES, BY YEAR (2020-2023)
    FIGURE 47. TOP WINNING STRATEGIES, BY DEVELOPMENT (2020-2023)
    FIGURE 48. TOP WINNING STRATEGIES, BY COMPANY (2020-2023)
    FIGURE 49. PRODUCT MAPPING OF TOP 10 PLAYERS
    FIGURE 50. COMPETITIVE DASHBOARD
    FIGURE 51. COMPETITIVE HEATMAP: DEEP LEARNING MARKET
    FIGURE 52. TOP PLAYER POSITIONING, 2022
    FIGURE 53. ADVANCED MICRO DEVICES INC.(XILINX INC.): NET REVENUE, 2020-2022 ($MILLION)
    FIGURE 54. ADVANCED MICRO DEVICES INC.(XILINX INC.): RESEARCH & DEVELOPMENT EXPENDITURE, 2020-2022
    FIGURE 55. ADVANCED MICRO DEVICES INC.(XILINX INC.): REVENUE SHARE BY SEGMENT, 2022 (%)
    FIGURE 56. ADVANCED MICRO DEVICES INC.(XILINX INC.): REVENUE SHARE BY REGION, 2022 (%)
    FIGURE 57. AMAZON WEB SERVICES, INC.: NET REVENUE, 2020-2022 ($MILLION)
    FIGURE 58. AMAZON WEB SERVICES, INC.: REVENUE SHARE BY SEGMENT, 2022 (%)
    FIGURE 59. AMAZON WEB SERVICES, INC.: REVENUE SHARE BY REGION, 2022 (%)
    FIGURE 60. GOOGLE LLC: NET REVENUE, 2020-2022 ($MILLION)
    FIGURE 61. GOOGLE LLC: RESEARCH & DEVELOPMENT EXPENDITURE, 2020-2022 ($MILLION)
    FIGURE 62. GOOGLE LLC: REVENUE SHARE BY SEGMENT, 2022 (%)
    FIGURE 63. GOOGLE LLC: REVENUE SHARE BY REGION, 2022 (%)
    FIGURE 64. IBM CORPORATION: NET REVENUE, 2020-2022 ($MILLION)
    FIGURE 65. IBM CORPORATION: RESEARCH & DEVELOPMENT EXPENDITURE, 2020-2022 ($MILLION)
    FIGURE 66. IBM CORPORATION: REVENUE SHARE BY SEGMENT, 2022 (%)
    FIGURE 67. IBM CORPORATION: REVENUE SHARE BY REGION, 2022 (%)
    FIGURE 68. INTEL CORPORATION: NET REVENUE, 2020-2022 ($MILLION)
    FIGURE 69. INTEL CORPORATION: RESEARCH & DEVELOPMENT EXPENDITURE, 2020-2022 ($MILLION)
    FIGURE 70. INTEL CORPORATION: REVENUE SHARE BY REGION, 2022 (%)
    FIGURE 71. INTEL CORPORATION: REVENUE SHARE BY SEGMENT, 2022 (%)
    FIGURE 72. MICROSOFT CORPORATION: NET REVENUE, 2020-2022 ($MILLION)
    FIGURE 73. MICROSOFT CORPORATION: RESEARCH & DEVELOPMENT EXPENDITURE, 2020-2022 ($MILLION)
    FIGURE 74. MICROSOFT CORPORATION: REVENUE SHARE BY SEGMENT, 2022 (%)
    FIGURE 75. MICROSOFT CORPORATION: REVENUE SHARE BY REGION, 2022 (%)
    FIGURE 76. NVIDIA CORPORATION: NET REVENUE, 2021-2023 ($MILLION)
    FIGURE 77. NVIDIA CORPORATION: RESEARCH & DEVELOPMENT EXPENDITURE, 2021-2023 ($MILLION)
    FIGURE 78. NVIDIA CORPORATION: REVENUE SHARE BY SEGMENT, 2023 (%)
    FIGURE 79. NVIDIA CORPORATION: REVENUE SHARE BY REGION, 2023 (%)
    FIGURE 80. QUALCOMM TECHNOLOGIES, INC. : NET REVENUE, 2020-2022 ($MILLION)
    FIGURE 81. QUALCOMM TECHNOLOGIES, INC. : RESEARCH & DEVELOPMENT EXPENDITURE, 2020-2022 ($MILLION)
    FIGURE 82. QUALCOMM TECHNOLOGIES, INC. : REVENUE SHARE BY SEGMENT, 2022 (%)
    FIGURE 83. QUALCOMM TECHNOLOGIES, INC. : REVENUE SHARE BY REGION, 2022 (%)
    FIGURE 84. SAMSUNG: NET REVENUE, 2020-2022 ($MILLION)
    FIGURE 85. SAMSUNG: RESEARCH & DEVELOPMENT EXPENDITURE, 2020-2022 ($MILLION)
    FIGURE 86. SAMSUNG: REVENUE SHARE BY SEGMENT, 2022 (%)
    FIGURE 87. SAMSUNG: REVENUE SHARE BY REGION, 2022 (%)
    FIGURE 88. XILINX: NET REVENUE, 2020-2022 ($MILLION)
    FIGURE 89. XILINX: RESEARCH & DEVELOPMENT EXPENDITURE, 2020-2022 ($MILLION)
    FIGURE 90. XILINX: REVENUE SHARE BY SEGMENT, 2022 (%)
    FIGURE 91. XILINX: REVENUE SHARE BY SEGMENT, 2021 (%)


PURCHASE OPTIONS

Call or Email us

U.S.-Canada Toll-free: +1-800-792-5285
Int'l : +1-503-894-6022
Europe : +44-845-528-1300
Email : help@alliedmarketresearch.com
 
FREQUENTLY ASKED QUESTIONS?

A. The deep learning market is estimated to grow at a CAGR of 37.8% from 2023 to 2032.

A. The deep learning market is projected to reach $406.01 billion by 2032.

A. Decline in hardware cost, increase in data availability and advancements in the hardware and increasing investment in research and development to support deep learning majorly contribute toward the growth of the market.

A. The key players profiled in the report include deep learning market analysis includes top companies operating in the market such as Advanced Micro Devices Inc., Amazon Web Services, Inc., Google LLC, IBM Corporation, Intel Corporation, Microsoft Corporation, NVIDIA Corporation, Qualcomm Technologies, Inc., Samsung and Xilinx.

A. The key growth strategies of deep learning players include product portfolio expansion, mergers & acquisitions, agreements, geographical expansion, and collaborations.

Looking for Customization?

 Customization Request

Have a Question?

 Speak with Analyst

Any Confusion?

 Inquire Before Buying

Have a glance of the Report

  Request Sample
RELATED TAGS

Purchase Full Report of
Deep Learning Market

Start reading instantly.
This Report and over 66,944+ more Reports, Available with Avenue Library. T&C*.

  • Online Only
  • $3,570
  • Online cloud access only
  • Restricted print, copy, paste & download
  • Read only
  • Free industry update
    (Within 180 days)
  • Free report update in next update cycle
    (Aug 2024 - Aug 2025)
  • Data Pack
  • $3,840
  • Restricted to one authorized user
  • One print only
  • Available in
    Excel
  • Free industry update
    (Within 180 days)
  •   Free report update in next update cycle
    (Aug 2024 - Aug 2025)
  • Single User
  • $5,730
  • Restricted to one authorized user
  • One print only
  • Available in
    PDF
  • Free industry update
    (Within 180 days)
  •   Free report update in next update cycle
    (Aug 2024 - Aug 2025)
  • Five Users
  • $6,450
  • Limited to five authorized users
  • Print upto five copies
  • Available in
    PDF
  • Free industry update
    (Within 180 days)
  •   Free report update in next update cycle
    (Aug 2024 - Aug 2025)
  • Enterprise
    License/PDF

  • $9,600
  • Unlimited
    within
    company/enterprise
  • Available in Excel & PDF
  • Free industry update
    (Within 180 days)
  •   Free report update in next update cycle
    (Aug 2024 - Aug 2025)
  • Library
    Membership

  • $999 $ 1,175
    Per User/ Per month/ Billed annually
  • Published Content
    E-access
  • Company Profiles
    E-access
  • Newly Added Content Access
  • 10 PDF
    Downloads
  • 5 Excel Data
    Pack Downloads
  • 250 Company Profiles PDF Downloads
  • Buy Now

*Taxes/Fees, if applicable will be added during checkout. All prices in USD

RELATED REPORTS
 

Why Allied Market Research?


Infallible Methodology

To ensure high-level data integrity, accurate analysis, and impeccable forecasts

Analyst Support

For complete satisfaction

Customization

On-demand customization of scope of the report to exactly meet your needs

TARGETED MARKET VIEW

Targeted market view to provide pertinent information and save time of readers

Get fresh content delivered

Get insights on topics that are crucial for your business. Stay abreast of your interest areas.

Get Industry Data Alerts

Why Allied Market Research?

Infallible Methodology

To ensure high-level data integrity, accurate analysis, and impeccable forecasts

Analyst Support

For complete satisfaction

Customization

On-demand customization of scope of the report to exactly meet your needs

TARGETED MARKET VIEW

Targeted market view to provide pertinent information and save time of readers