0
2021
Feta Cheese Market

Feta Cheese Market

by Source (Cow Milk, Sheep Milk, and Goat Milk), Type (Bulgarian Feta, French Feta, German Feta, and Others), and Distribution Channel (B2B and B2C Distribution): Global Opportunity Analysis and Industry Forecast, 2021-2028

Report Code: A08419
Jun 2021 | Pages: 310
Tables: 148
Charts: 72
  • Formats*:

  • pdf

    Single User License, Five User
    License & Enterprise User License

  • xls

    Data Pack Excel License

  • ppt

    It comes with the additional cost
    of $2500.00 contact sales.


COVID-19

Pandemic disrupted the entire world and affected many industries.

Get detailed COVID-19 impact analysis on the Feta Cheese Market

Request Now !

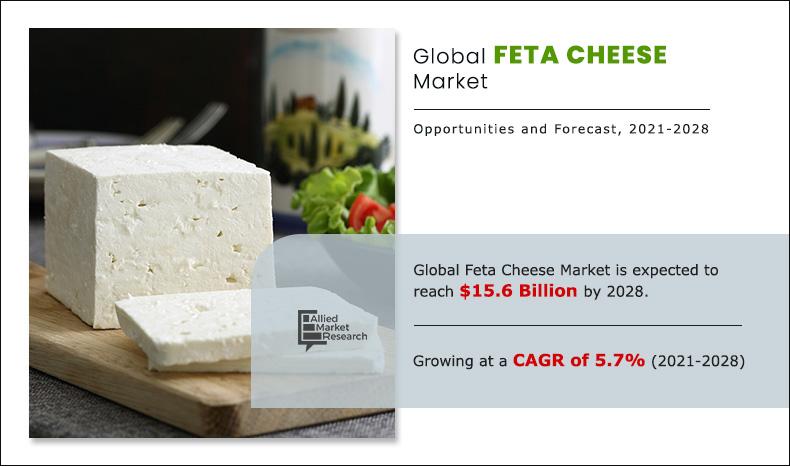
The global feta cheese market size was valued at $10.5 billion in 2019, and is anticipated to reach $15.6 billion by 2028, with a CAGR of 5.7% during the forecast period. The market is expected to exhibit an incremental revenue opportunity of $5.0 billion from 2019 to 2028.      

Feta cheese is a Greece origin cheese made from either sheep milk or a combination of sheep and goat milk. Traditional feta cheese consists of sheep milk and goat milk in a proposition of 70:30, with specific diet given to the animal. The texture of the cheese is creamy, grainy, and soft with a fat content of 21 g per 100 g. It has a fully flavored salty and tangy taste with nutty, strong aroma to it. The curing time is minimum of three months, and is kept in a briny solution. The texture depends on the aging of the cheese, which can be extremely creamy to crumbly. The texture and flavor slightly vary from region to region, owing to the difference in the diet in farm animals. Feta is used both as a table cheese and as a cooking cheese, and is used in Greek salads, spanakopita, pizza, or pie. It can be eaten raw with olive oil, roasted nuts, and chili pepper.  

Feta-Cheese-Market-2021-2028

Feta cheese serves as an ideal dietary source for various nutrition and health-promoting compounds, which help the body function properly. Along with the luscious flavors of cheese, it provides a larger number of nutritional supplements in concentrated form. Protein, calcium, phosphorus, zinc, vitamins A & B12, and sodium are most essential nutrients found in every type of cheese. As the body cannot synthesize them, they are required to be consumed from external sources. Hence, feta cheese acts as a suitable source in which such nutrients are present in concentrated form. 

The demand for feta cheese is high in Germany because it is included in almost every diet and loved by everyone, especially the health-conscious people. It is a very healthy food product because it contains calcium, fiber, vitamin, zinc, phosphorous, protein, and carbs. People can consume feta cheese before and after a workout as it contains very few carbohydrates. Health-conscious people prefer variation in food, which can be found by using feta cheese in a variety of products such as brown bread and whole wheat base. It also comprises fatty acids that help in making the body lean and decreases the chances of breast cancer. However, in pregnancy, doctors advise women not to consume the feta cheese because it is formed with unpasteurized milk.

Germany is the prominent exporter of feta cheese, and it exports a large quantity of feta cheese to other countries. American consumers have adopted feta cheese in their diet after becoming aware of the health benefits of feta cheese. However, in India, the feta cheese is mostly available in big star hotels due to less preference of the low fat and salty cheese. In addition, the demand for goat milk is lesser in India because of the high demand for cow or buffalo milk.

Corona virus has spread all over the world and most of the countries are adopting lockdown measures to control the spread of the virus for securing public health. All business and production activities are fully shut down except food and medical sector or other, leading toward economic crisis in the country. Manufacturing and production functions are stopped which has slowed down the business and inactive trade and transportation has fully disrupted the supply chain because of which companies can face big losses in near future.  

According to the global feta cheese market analysis, the feta cheese market is segmented into source, type, distribution channel, and region. By source, it is categorized into cow milk, sheep milk, and goat milk. Based on type, it is segmented into Bulgarian feta, German feta, French feta, and others. On the basis of distribution channel, it is segregated into B2B and B2C. Further, B2B is sub-segmented into full-service restaurants, fast food outlets, catering services, and other. B2C is sub-segmented into hypermarket/supermarket, food specialty stores, convenience stores, and others. Region wise, it is analyzed across North America (the U.S., Canada, and Mexico), Europe (Germany, France, the UK, Spain, Italy, Greece, and rest of Europe), Asia-Pacific (China, Japan, India, Australia, South Korea, Indonesia, Singapore, and rest of Asia-Pacific), and LAMEA (Brazil, Argentina, United Arab Emirates, Nigeria, Turkey, South Africa, and rest of LAMEA).   

Based on source, sheep milk segment holds the major share in the feta cheese market. The demand for sheep milk is on rise due to its superior qualities as compared to cow, goat, and buffalo milk. Shift in preference toward the sheep milk for production of high-quality and high yielding cheese significantly drives the feta cheese market growth.  

Feta Cheese Market
By Source

Your browser does not support the canvas element.

The sheep milk segment held the major share of 60.1% in 2019

Get more information on this report : Request Sample Pages

Based on type, German feta cheese leads the feta cheese market and is likely to remain dominant throughout the feta cheese market forecast period. The demand for German feta cheese among consumers is growing rapidly. This is attributed to evolving taste preference of consumers and living healthy lifestyle, which boosts the demand for healthy food products. With increased knowledge and understanding of product benefits, consumers have become more conscious of the food’s flavor they eat. Hence, the German feta cheese is expected to increase with a considerable growth rate.

Feta Cheese Market
By Type

Your browser does not support the canvas element.

The German Feta segment helds the higest market share of 39.2% in 2019

Get more information on this report : Request Sample Pages

Depending on distribution channel, B2B distribution channel dominated the market. The B2B distribution channel includes the food services. It serves meals and snacks for immediate consumption on site and take away. It includes full-service restaurants, fast food outlets, caterers, cafeterias, and other places where food is prepared, served, and sold to the general public for a profit. Surge in demand for various fast foods from the leading food chains such as Burger King, KFC, McDonalds, and Dominos is anticipated to boost the demand for cheese through B2B distribution channel. 

Feta Cheese Market
By Distribution Channel

Your browser does not support the canvas element.

The B2B segment helds the higest market share of 59.9% in 2019

Get more information on this report : Request Sample Pages

Europe is likely to hold the major feta cheese market share. Feta cheese is majorly produced in Europe, and exported all over the globe from European countries. Germany and the Netherland are the largest feta cheese market in Europe due to increase in demand from millennial and increase in demand for fresh and ready-to-eat food with changes in lifestyle. Furthermore, rise in awareness about the benefits of cheese, its easy affordability, and increase in applications areas drive the Europe feta cheese market.

Feta Cheese Market
By Region

2028
Europe 
North America
Asia-Pacific
LAMEA

The Europe region helds the higest market share of 55.8% in 2019

Get more information on this report : Request Sample Pages

The key players operating in the feta cheese market include following companies Arla Foods amba, Lactalis American Group, Inc., Fonterra Co-operative Group, Saputo Inc, The Kraft Heinz Company, Dodoni S.A., Kolios S.A. Mevgal, SADAFCO, and Clover Leaf Cheese Ltd. 

Key benefits for stakeholders  

  • The report provides quantitative analysis of the current feta cheese market trends, estimations, and dynamics of the market size from 2019 to 2028 to identify the prevailing feta cheese market opportunities. 
  • Porter’s five forces analysis highlights the potency of buyers and suppliers to enable stakeholders to make profit-oriented business decisions and strengthen their supplier–buyer network.
  • The feta cheese market demand is rising in the western countries. 
  • In-depth analysis and the market size & feta cheese market segment assist to determine the market potential.
  • The major countries in each region are mapped according to their revenue contribution to the market.    
  • The market player positioning segment facilitates benchmarking and provides a clear understanding of the present position of the market players in the feta cheese industry. 

Feta Cheese Market Report Highlights

Aspects Details
By SOURCE
  • Cow Milk
  • Sheep Milk
  • Goat Milk
By Type
  • Bulgarian Feta
  • French Feta
  • German Feta
  • Others
By DISTRIBUTION CHANNEL
  • B2B
    • Fast Food Outlet
    • Catering Services
    • Others
  • B2C
    • Food Specialty stores
    • Convenience Stores
    • Others
By Region
  • North America  (US, Canada, Mexico)
  • Europe  (Germany, France, UK, Italy, Spain, Greece, Rest of Europe)
  • Asia-Pacific  (China, Japan, India, Australia, South Korea, Indonesia, Singapore, Rest of Asia-Pacific)
  • LAMEA  (Brazil, Argentina, United Arab Emirates, Nigeria, Turkey, South Africa, Rest of LAMEA)
Key Market Players SADAFCO, The Kraft Heinz Company, Fonterra Co-operative Group Limited, Clover Leaf Cheese Ltd, KOLIOS S.A., Mevgal, Arla Foods amba, Lactalis American Group, Inc., Dodoni S.A., Saputo Inc.
 

CHAPTER 1:INTRODUCTION

1.1.Key benefits for stakeholders
1.2.Key market segments
1.3.Research methodology

1.3.1.Secondary research
1.3.2.Primary research
1.3.3.Analyst tools and models

CHAPTER 2:EXECUTIVE SUMMARY

2.1.Key findings of the study
2.2.CXO perspective

CHAPTER 3:MARKET OVERVIEW

3.1.Market definition and scope
3.2.Key findings

3.2.1.Top investment pockets

3.3.Parent Market Overview
3.4.Value chain analysis
3.5.Supply Chain Analysis Under Food Service Distribution Sector
3.6.Porter’s five forces analysis
3.7.Market dynamics

3.7.1.Drivers

3.7.1.1.Expansion of quick-service restaurants
3.7.1.2.Rise in popularity of European food culture
3.7.1.3.Surge in demand for protein-rich food
3.7.1.4.Increase in demand for international cuisines

3.7.2.Restraint

3.7.2.1.Lack of storage and transport facility

3.7.3.Opportunities

3.7.3.1.Availability of various options in cheese such as flavor, color, and texture

3.9.Top Exporting Countries of Feta Cheese, (%)
3.10.Top importing countries of Feta Cheese, (%)
3.11.Market share analysis

3.11.1.By Source
3.11.2.By Type
3.11.3.By Distribution Channel
3.11.4.By region

3.12.COVID-19 impact analysis

3.12.1.Introduction
3.12.2.Impact on the Feta Cheese market

CHAPTER 4:FETA CHEESE MARKET, BY SOURCE

4.1.Overview

4.1.1.Market size and forecast

4.2.Cow Milk

4.2.1.Key market trends, growth factors, and opportunities
4.2.2.Market size and forecast

4.3.Sheep Milk

4.3.1.Key market trends, growth factors, and opportunities
4.3.2.Market size and forecast

4.4.Goat Milk

4.4.1.Key market trends, growth factors, and opportunities
4.4.2.Market size and forecast

CHAPTER 5:FETA CHEESE MARKET, BY TYPE

5.1.Overview

5.1.1.Market size and forecast

5.2.Bulgarian Feta

5.2.1.Key market trends, growth factors, and opportunities
5.2.2.Market size and forecast

5.3.French Feta

5.3.1.Key market trends, growth factors, and opportunities
5.3.2.Market size and forecast

5.4.German Feta

5.4.1.Key market trends, growth factors, and opportunities
5.4.2.Market size and forecast

5.5.Others

5.5.1.Key market trends, growth factors, and opportunities
5.5.2.Market size and forecast

CHAPTER 6:FETA CHEESE MARKET, BY DISTRIBUTION CHANNEL

6.1.Overview

6.1.1.Market size and forecast

6.2.B2B

6.2.1.Key market trends, growth factors, and opportunities
6.2.2.Market size and forecast
6.2.3.Full-Service Restaurant

6.2.3.1.Key market trends, growth factors, and opportunities

6.2.4.Fast Food Outlet

6.2.4.1.Key market trends, growth factors, and opportunities

6.2.5.Catering Services

6.2.5.1.Key market trends, growth factors, and opportunities

6.2.6.Others

6.2.6.1.Key market trends, growth factors, and opportunities

6.3.B2C

6.3.1.Key market trends, growth factors, and opportunities
6.3.2.Market size and forecast
6.3.3.Hypermarket/Supermarket

6.3.3.1.Key market trends, growth factors, and opportunities

6.3.4.Food Specialty stores

6.3.4.1.Key market trends, growth factors, and opportunities

6.3.5.Convenience Stores

6.3.5.1.Key market trends, growth factors, and opportunities

6.3.6.Others

6.3.6.1.Key market trends, growth factors, and opportunities

CHAPTER 7:FETA CHEESE MARKET, BY REGION

7.1.Overview

7.1.1.Market size and forecast, by region

7.2.North America

7.2.1.Key market trends, growth factors, and opportunities
7.2.2.Market size and forecast, by Source
7.2.3.Market size and forecast, by Type
7.2.4.Market size and forecast, by Distribution Channel
7.2.6.Market size and forecast, by country

7.2.6.1.U.S.

7.2.6.1.1.Market size and forecast, by Source
7.2.6.1.2.Market size and forecast, by Type
7.2.6.1.3.Market size and forecast, by Distribution Channel

7.2.6.2.Canada

7.2.6.2.1.Market size and forecast, by Source
7.2.6.2.2.Market size and forecast, by Type
7.2.6.2.3.Market size and forecast, by Distribution Channel

7.2.6.3.Mexico

7.2.6.3.1.Market size and forecast, by Source
7.2.6.3.2.Market size and forecast, by Type
7.2.6.3.3.Market size and forecast, by Distribution Channel

7.3.Europe

7.3.1.Key market trends, growth factors, and opportunities
7.3.2.Market size and forecast, by Source
7.3.3.Market size and forecast, by Type
7.3.4.Market size and forecast, by Distribution Channel
7.3.6.Market size and forecast, by country

7.3.6.1.Germany

7.3.6.1.1.Market size and forecast, by Source
7.3.6.1.2.Market size and forecast, by Type
7.3.6.1.3.Market size and forecast, by Distribution Channel

7.3.6.2.France

7.3.6.2.1.Market size and forecast, by Source
7.3.6.2.2.Market size and forecast, by Type
7.3.6.2.3.Market size and forecast, by Distribution Channel

7.3.6.3.UK

7.3.6.3.1.Market size and forecast, by Source
7.3.6.3.2.Market size and forecast, by Type
7.3.6.3.3.Market size and forecast, by Distribution Channel

7.3.6.4.Italy

7.3.6.4.1.Market size and forecast, by Source
7.3.6.4.2.Market size and forecast, by Type
7.3.6.4.3.Market size and forecast, by Distribution Channel

7.3.6.5.Spain

7.3.6.5.1.Market size and forecast, by Source
7.3.6.5.2.Market size and forecast, by Type
7.3.6.5.3.Market size and forecast, by Distribution Channel

7.3.6.6.Greece

7.3.6.6.1.Market size and forecast, by Source
7.3.6.6.2.Market size and forecast, by Type
7.3.6.6.3.Market size and forecast, by Distribution Channel

7.3.6.7.Rest of Europe

7.3.6.7.1.Market size and forecast, by Source
7.3.6.7.2.Market size and forecast, by Type
7.3.6.7.3.Market size and forecast, by Distribution Channel

7.4.Asia-Pacific

7.4.1.Key market trends, growth factors, and opportunities
7.4.2.Market size and forecast, by Source
7.4.3.Market size and forecast, by Type
7.4.4.Market size and forecast, by Distribution Channel
7.4.6.Market size and forecast, by country

7.4.6.1.China

7.4.6.1.1.Market size and forecast, by Source
7.4.6.1.2.Market size and forecast, by Type
7.4.6.1.3.Market size and forecast, by Distribution Channel

7.4.6.2.Japan

7.4.6.2.1.Market size and forecast, by Source
7.4.6.2.2.Market size and forecast, by Type
7.4.6.2.3.Market size and forecast, by Distribution Channel

7.4.6.3.India

7.4.6.3.1.Market size and forecast, by Source
7.4.6.3.2.Market size and forecast, by Type
7.4.6.3.3.Market size and forecast, by Distribution Channel

7.4.6.4.Australia

7.4.6.4.1.Market size and forecast, by Source
7.4.6.4.2.Market size and forecast, by Type
7.4.6.4.3.Market size and forecast, by Distribution Channel

7.4.6.5.South Korea

7.4.6.5.1.Market size and forecast, by Source
7.4.6.5.2.Market size and forecast, by Type
7.4.6.5.3.Market size and forecast, by Distribution Channel

7.4.6.6.Indonesia

7.4.6.6.1.Market size and forecast, by Source
7.4.6.6.2.Market size and forecast, by Type
7.4.6.6.3.Market size and forecast, by Distribution Channel

7.4.6.7.Singapore

7.4.6.7.1.Market size and forecast, by Source
7.4.6.7.2.Market size and forecast, by Type
7.4.6.7.3.Market size and forecast, by Distribution Channel

7.4.6.8.Rest of Asia-Pacific

7.4.6.8.1.Market size and forecast, by Source
7.4.6.8.2.Market size and forecast, by Type
7.4.6.8.3.Market size and forecast, by Distribution Channel

7.5.LAMEA

7.5.1.Key market trends, growth factors, and opportunities
7.5.2.Market size and forecast, by Source
7.5.3.Market size and forecast, by Type
7.5.4.Market size and forecast, by Distribution Channel
7.5.6.Market size and forecast, by country

7.5.6.1.Brazil

7.5.6.1.1.Market size and forecast, by Source
7.5.6.1.2.Market size and forecast, by Type
7.5.6.1.3.Market size and forecast, by Distribution Channel

7.5.6.2.Argentina

7.5.6.2.1.Market size and forecast, by Source
7.5.6.2.2.Market size and forecast, by Type
7.5.6.2.3.Market size and forecast, by Distribution Channel

7.5.6.3.United Arab Emirates

7.5.6.3.1.Market size and forecast, by Source
7.5.6.3.2.Market size and forecast, by Type
7.5.6.3.3.Market size and forecast, by Distribution Channel

7.5.6.4.Nigeria

7.5.6.4.1.Market size and forecast, by Source
7.5.6.4.2.Market size and forecast, by Type
7.5.6.4.3.Market size and forecast, by Distribution Channel

7.5.6.5.Turkey

7.5.6.5.1.Market size and forecast, by Source
7.5.6.5.2.Market size and forecast, by Type
7.5.6.5.3.Market size and forecast, by Distribution Channel

7.5.6.6.South Africa

7.5.6.6.1.Market size and forecast, by Source
7.5.6.6.2.Market size and forecast, by Type
7.5.6.6.3.Market size and forecast, by Distribution Channel

7.5.6.7.Rest of LAMEA

7.5.6.7.1.Market size and forecast, by Source
7.5.6.7.2.Market size and forecast, by Type
7.5.6.7.3.Market size and forecast, by Distribution Channel

CHAPTER 8:COMPETITION LANDSCAPE

8.1.Top winning strategies
8.2.Product mapping
8.3.Competitive dashboard
8.4.Competitive heat map
8.5.Key developments

8.5.1.Acquisition
8.5.2.Business Expansion
8.5.3.Agreement
8.5.4.Product Launch

CHAPTER 9:COMPANY PROFILES

9.1.Arla Foods amba

9.1.1.Company overview
9.1.2.Key Executives
9.1.3.Company snapshot
9.1.4.Operating business segments
9.1.5.Product portfolio
9.1.6.R&D Expenditure
9.1.7.Business performance
9.1.8.Key strategic moves and developments

9.2.Lactalis American Group, Inc.

9.2.1.Company overview
9.2.2.Key Executives
9.2.3.Company snapshot
9.2.4.Product portfolio
9.2.5.Key strategic moves and developments

9.3.Fonterra Co-operative Group Limited

9.3.1.Company overview
9.3.2.Key Executives
9.3.3.Company snapshot
9.3.4.Operating business segments
9.3.5.Product portfolio
9.3.6.R&D Expenditure
9.3.7.Business performance
9.3.8.Key strategic moves and developments

9.4.Saputo Inc.

9.4.1.Company overview
9.4.2.Key Executives
9.4.3.Company snapshot
9.4.4.Operating business segments
9.4.5.Product portfolio
9.4.6.Business performance
9.4.7.Key strategic moves and developments

9.5.The Kraft Heinz Company

9.5.1.Company overview
9.5.2.Key Executives
9.5.3.Company snapshot
9.5.4.Operating business segments
9.5.5.Product portfolio
9.5.6.R&D Expenditure
9.5.7.Business performance
9.5.8.Key strategic moves and developments

9.6.Dodoni S.A.

9.6.1.Company overview
9.6.2.Key Executives
9.6.3.Company snapshot
9.6.4.Product portfolio
9.6.5.Key strategic moves and developments

9.7.KOLIOS S.A.

9.7.1.Company overview
9.7.2.Key Executives
9.7.3.Company snapshot
9.7.4.Product portfolio
9.7.5.Business performance

9.8.Mevgal

9.8.1.Company overview
9.8.2.Key Executives
9.8.3.Company snapshot
9.8.4.Product portfolio

9.9.SADAFCO

9.9.1.Company overview
9.9.2.Key Executives
9.9.3.Company snapshot
9.9.4.Operating business segments
9.9.5.Product portfolio
9.9.6.Business performance
9.9.7.Key strategic moves and developments

9.10.Clover Leaf Cheese Ltd

9.10.1.Company overview
9.10.2.Key Executives
9.10.3.Company snapshot
9.10.4.Product portfolio

TABLE 

TABLE 01.GLOBAL FETA CHEESE MARKET REVENUE, BY SOURCE, 2019–2028 ($MILLION)
TABLE 02.COW MILK MARKET REVENUE FOR FETA CHEESE, BY REGION, 2019–2028 ($MILLION)
TABLE 03.SHEEP MILK MARKET REVENUE FOR FETA CHEESE, BY REGION, 2019–2028 ($MILLION)
TABLE 04.GOAT MILK MARKET REVENUE FOR FETA CHEESE, BY REGION, 2019–2028 ($MILLION)
TABLE 05.GLOBAL FETA CHEESE MARKET REVENUE, BY TYPE 2019–2028 ($MILLION)
TABLE 06.FETA CHEESE MARKET REVENUE FOR BULGARIAN FETA, BY REGION, 2019–2028 ($MILLION)
TABLE 07.FETA CHEESE MARKET REVENUE FOR FRENCH FETA, BY REGION, 2019–2028 ($MILLION)
TABLE 08.FETA CHEESE MARKET REVENUE FOR GERMAN FETA, BY REGION, 2019–2028 ($MILLION)
TABLE 09.FETA CHEESE MARKET REVENUE FOR OTHER TYPES, BY REGION, 2019–2028 ($MILLION)
TABLE 10.GLOBAL FETA CHEESE MARKET REVENUE, BY DISTRIBUTION CHANNEL, 2019–2028 ($MILLION)
TABLE 11.FETA CHEESE MARKET REVENUE FOR B2B, BY REGION, 2019–2028 ($MILLION)
TABLE 12.FETA CHEESE MARKET REVENUE FOR B2C, BY REGION, 2019–2028 ($MILLION)
TABLE 13.FETA CHEESE MARKET REVENUE, BY REGION, 2019–2028 ($MILLION)
TABLE 14.NORTH AMERICA FETA CHEESE MARKET REVENUE, BY SOURCE, 2019–2028 ($MILLION)
TABLE 15.NORTH AMERICA FETA CHEESE MARKET REVENUE, BY TYPE, 2019–2028 ($MILLION)
TABLE 16.NORTH AMERICA FETA CHEESE MARKET REVENUE, BY DISTRIBUTION CHANNEL, 2019–2028 ($MILLION)
TABLE 17.NORTH AMERICA FETA CHEESE MARKET REVENUE, BY COUNTRY, 2019–2028 ($MILLION)
TABLE 18.U.S. FETA CHEESE MARKET REVENUE, BY SOURCE, 2019–2028 ($MILLION)
TABLE 19.U.S. FETA CHEESE MARKET REVENUE, BY TYPE, 2019–2028 ($MILLION)
TABLE 20.U.S. FETA CHEESE MARKET REVENUE, BY DISTRIBUTION CHANNEL, 2019–2028 ($MILLION)
TABLE 21.CANADA FETA CHEESE MARKET REVENUE, BY SOURCE, 2019–2028 ($MILLION)
TABLE 22.CANADA FETA CHEESE MARKET REVENUE, BY TYPE, 2019–2028 ($MILLION)
TABLE 23.CANADA FETA CHEESE MARKET REVENUE, BY DISTRIBUTION CHANNEL, 2019–2028 ($MILLION)
TABLE 24.MEXICO FETA CHEESE MARKET REVENUE, BY SOURCE, 2019–2028 ($MILLION)
TABLE 25.MEXICO FETA CHEESE MARKET REVENUE, BY TYPE, 2019–2028 ($MILLION)
TABLE 26.MEXICO FETA CHEESE MARKET REVENUE, BY DISTRIBUTION CHANNEL, 2019–2028 ($MILLION)
TABLE 27.EUROPE FETA CHEESE MARKET REVENUE, BY SOURCE, 2019–2028 ($MILLION)
TABLE 28.EUROPE FETA CHEESE MARKET REVENUE, BY TYPE, 2019–2028 ($MILLION)
TABLE 29.EUROPE FETA CHEESE MARKET REVENUE, BY DISTRIBUTION CHANNEL, 2019–2028 ($MILLION)
TABLE 30.EUROPE FETA CHEESE MARKET REVENUE, BY COUNTRY, 2019–2028 ($MILLION)
TABLE 31.GERMANY FETA CHEESE MARKET REVENUE, BY SOURCE, 2019–2028 ($MILLION)
TABLE 32.GERMANY FETA CHEESE MARKET REVENUE, BY TYPE, 2019–2028 ($MILLION)
TABLE 33.GERMANY FETA CHEESE MARKET REVENUE, BY DISTRIBUTION CHANNEL, 2019–2028 ($MILLION)
TABLE 34.FRANCE FETA CHEESE MARKET REVENUE, BY SOURCE, 2019–2028 ($MILLION)
TABLE 35.FRANCE FETA CHEESE MARKET REVENUE, BY TYPE, 2019–2028 ($MILLION)
TABLE 36.FRANCE FETA CHEESE MARKET REVENUE, BY DISTRIBUTION CHANNEL, 2019–2028 ($MILLION)
TABLE 37.UK FETA CHEESE MARKET REVENUE, BY SOURCE, 2019–2028 ($MILLION)
TABLE 38.UK FETA CHEESE MARKET REVENUE, BY TYPE, 2019–2028 ($MILLION)
TABLE 39.UK FETA CHEESE MARKET REVENUE, BY DISTRIBUTION CHANNEL, 2019–2028 ($MILLION)
TABLE 40.ITALY FETA CHEESE MARKET REVENUE, BY SOURCE, 2019–2028 ($MILLION)
TABLE 41.ITALY FETA CHEESE MARKET REVENUE, BY TYPE, 2019–2028 ($MILLION)
TABLE 42.ITALY FETA CHEESE MARKET REVENUE, BY DISTRIBUTION CHANNEL, 2019–2028 ($MILLION)
TABLE 43.SPAIN FETA CHEESE MARKET REVENUE, BY SOURCE, 2019–2028 ($MILLION)
TABLE 44.SPAIN FETA CHEESE MARKET REVENUE, BY TYPE, 2019–2028 ($MILLION)
TABLE 45.SPAIN FETA CHEESE MARKET REVENUE, BY DISTRIBUTION CHANNEL, 2019–2028 ($MILLION)
TABLE 46.GREECE FETA CHEESE MARKET REVENUE, BY SOURCE, 2019–2028 ($MILLION)
TABLE 47.GREECE FETA CHEESE MARKET REVENUE, BY TYPE, 2019–2028 ($MILLION)
TABLE 48.GREECE FETA CHEESE MARKET REVENUE, BY DISTRIBUTION CHANNEL, 2019–2028 ($MILLION)
TABLE 49.REST OF EUROPE FETA CHEESE MARKET REVENUE, BY SOURCE, 2019–2028 ($MILLION)
TABLE 50.REST OF EUROPE FETA CHEESE MARKET REVENUE, BY TYPE, 2019–2028 ($MILLION)
TABLE 51.REST OF EUROPE FETA CHEESE MARKET REVENUE, BY DISTRIBUTION CHANNEL, 2019–2028 ($MILLION)
TABLE 52.ASIA-PACIFIC FETA CHEESE MARKET REVENUE, BY SOURCE, 2019–2028 ($MILLION)
TABLE 53.ASIA-PACIFIC FETA CHEESE MARKET REVENUE, BY TYPE, 2019–2028 ($MILLION)
TABLE 54.ASIA-PACIFIC FETA CHEESE MARKET REVENUE, BY DISTRIBUTION CHANNEL, 2019–2028 ($MILLION)
TABLE 55.ASIA-PACIFIC FETA CHEESE MARKET REVENUE, BY COUNTRY, 2019–2028 ($MILLION)
TABLE 56.CHINA FETA CHEESE MARKET REVENUE, BY SOURCE, 2019–2028 ($MILLION)
TABLE 57.CHINA FETA CHEESE MARKET REVENUE, BY TYPE, 2019–2028 ($MILLION)
TABLE 58.CHINA FETA CHEESE MARKET REVENUE, BY DISTRIBUTION CHANNEL, 2019–2028 ($MILLION)
TABLE 59.JAPAN FETA CHEESE MARKET REVENUE, BY SOURCE, 2019–2028 ($MILLION)
TABLE 60.JAPAN FETA CHEESE MARKET REVENUE, BY TYPE, 2019–2028 ($MILLION)
TABLE 61.JAPAN FETA CHEESE MARKET REVENUE, BY DISTRIBUTION CHANNEL, 2019–2028 ($MILLION)
TABLE 62.INDIA FETA CHEESE MARKET REVENUE, BY SOURCE, 2019–2028 ($MILLION)
TABLE 63.INDIA FETA CHEESE MARKET REVENUE, BY TYPE, 2019–2028 ($MILLION)
TABLE 64.INDIA FETA CHEESE MARKET REVENUE, BY DISTRIBUTION CHANNEL, 2019–2028 ($MILLION)
TABLE 65.AUSTRALIA FETA CHEESE MARKET REVENUE, BY SOURCE, 2019–2028 ($MILLION)
TABLE 66.AUSTRALIA FETA CHEESE MARKET REVENUE, BY TYPE, 2019–2028 ($MILLION)
TABLE 67.AUSTRALIA FETA CHEESE MARKET REVENUE, BY DISTRIBUTION CHANNEL, 2019–2028 ($MILLION)
TABLE 68.SOUTH KOREA FETA CHEESE MARKET REVENUE, BY SOURCE, 2019–2028 ($MILLION)
TABLE 69.SOUTH KOREA FETA CHEESE MARKET REVENUE, BY TYPE, 2019–2028 ($MILLION)
TABLE 70.SOUTH KOREA FETA CHEESE MARKET REVENUE, BY DISTRIBUTION CHANNEL, 2019–2028 ($MILLION)
TABLE 71.INDONESIA FETA CHEESE MARKET REVENUE, BY SOURCE, 2019–2028 ($MILLION)
TABLE 72.INDONESIA FETA CHEESE MARKET REVENUE, BY TYPE, 2019–2028 ($MILLION)
TABLE 73.INDONESIA FETA CHEESE MARKET REVENUE, BY DISTRIBUTION CHANNEL, 2019–2028 ($MILLION)
TABLE 74.SINGAPORE FETA CHEESE MARKET REVENUE, BY SOURCE, 2019–2028 ($MILLION)
TABLE 75.SINGAPORE FETA CHEESE MARKET REVENUE, BY TYPE, 2019–2028 ($MILLION)
TABLE 76.SINGAPORE FETA CHEESE MARKET REVENUE, BY DISTRIBUTION CHANNEL, 2019–2028 ($MILLION)
TABLE 77.REST OF ASIA-PACIFIC FETA CHEESE MARKET REVENUE, BY SOURCE, 2019–2028 ($MILLION)
TABLE 78.REST OF ASIA-PACIFIC FETA CHEESE MARKET REVENUE, BY TYPE, 2019–2028 ($MILLION)
TABLE 79.REST OF ASIA-PACIFIC FETA CHEESE MARKET REVENUE, BY DISTRIBUTION CHANNEL, 2019–2028 ($MILLION)
TABLE 80.LAMEA FETA CHEESE MARKET REVENUE, BY SOURCE, 2019–2028 ($MILLION)
TABLE 81.LAMEA FETA CHEESE MARKET REVENUE, BY TYPE, 2019–2028 ($MILLION)
TABLE 82.LAMEA FETA CHEESE MARKET REVENUE, BY DISTRIBUTION CHANNEL, 2019–2028 ($MILLION)
TABLE 83.LAMEA FETA CHEESE MARKET REVENUE, BY COUNTRY, 2019–2028 ($MILLION)
TABLE 84.BRAZIL FETA CHEESE MARKET REVENUE, BY SOURCE, 2019–2028 ($MILLION)
TABLE 85.BRAZIL FETA CHEESE MARKET REVENUE, BY TYPE, 2019–2028 ($MILLION)
TABLE 86.BRAZIL FETA CHEESE MARKET REVENUE, BY DISTRIBUTION CHANNEL, 2019–2028 ($MILLION)
TABLE 87.ARGENTINA FETA CHEESE MARKET REVENUE, BY SOURCE, 2019–2028 ($MILLION)
TABLE 88.ARGENTINA FETA CHEESE MARKET REVENUE, BY TYPE, 2019–2028 ($MILLION)
TABLE 89.ARGENTINA FETA CHEESE MARKET REVENUE, BY DISTRIBUTION CHANNEL, 2019–2028 ($MILLION)
TABLE 90.UNITED ARAB EMIRATES FETA CHEESE MARKET REVENUE, BY SOURCE, 2019–2028 ($MILLION)
TABLE 91.UNITED ARAB EMIRATES FETA CHEESE MARKET REVENUE, BY TYPE, 2019–2028 ($MILLION)
TABLE 92.UNITED ARAB EMIRATES FETA CHEESE MARKET REVENUE, BY DISTRIBUTION CHANNEL, 2019–2028 ($MILLION)
TABLE 93.NIGERIA FETA CHEESE MARKET REVENUE, BY SOURCE, 2019–2028 ($MILLION)
TABLE 94.NIGERIA FETA CHEESE MARKET REVENUE, BY TYPE, 2019–2028 ($MILLION)
TABLE 95.NIGERIA FETA CHEESE MARKET REVENUE, BY DISTRIBUTION CHANNEL, 2019–2028 ($MILLION)
TABLE 96.TURKEY FETA CHEESE MARKET REVENUE, BY SOURCE, 2019–2028 ($MILLION)
TABLE 97.TURKEY FETA CHEESE MARKET REVENUE, BY TYPE, 2019–2028 ($MILLION)
TABLE 98.TURKEY FETA CHEESE MARKET REVENUE, BY DISTRIBUTION CHANNEL, 2019–2028 ($MILLION)
TABLE 99.SOUTH AFRICA FETA CHEESE MARKET REVENUE, BY SOURCE, 2019–2028 ($MILLION)
TABLE 100.SOUTH AFRICA FETA CHEESE MARKET REVENUE, BY TYPE, 2019–2028 ($MILLION)
TABLE 101.SOUTH AFRICA FETA CHEESE MARKET REVENUE, BY DISTRIBUTION CHANNEL, 2019–2028 ($MILLION)
TABLE 102.REST OF LAMEA FETA CHEESE MARKET REVENUE, BY SOURCE, 2019–2028 ($MILLION)
TABLE 103.REST OF LAMEA FETA CHEESE MARKET REVENUE, BY TYPE, 2019–2028 ($MILLION)
TABLE 104.REST OF LAMEA FETA CHEESE MARKET REVENUE, BY DISTRIBUTION CHANNEL, 2019–2028 ($MILLION)
TABLE 105.ARLA FOODS AMBA: KEY EXECUTIVES
TABLE 106.ARLA FOODS AMBA: COMPANY SNAPSHOT
TABLE 107.ARLA FOODS AMBA: OPERATING SEGMENTS
TABLE 108.ARLA FOODS AMBA: PRODUCT PORTFOLIO
TABLE 109.ARLA FOODS AMBA: R&D EXPENDITURE, 2018–2020 ($MILLION)
TABLE 110.ARLA FOODS AMBA: NET SALES, 2018–2020 ($MILLION)
TABLE 111.LACTALIS AMERICAN GROUP INC.: KEY EXECUTIVES
TABLE 112.LACTALIS AMERICAN GROUP INC.: COMPANY SNAPSHOT
TABLE 113.LACTALIS AMERICAN GROUP INC.: PRODUCT PORTFOLIO
TABLE 114.FONTERRA CO-OPERATIVE GROUP LIMITED: KEY EXECUTIVES
TABLE 115.FONTERRA CO-OPERATIVE GROUP LIMITED: COMPANY SNAPSHOT
TABLE 116.FONTERRA CO-OPERATIVE GROUP LIMITED: OPERATING SEGMENTS
TABLE 117.FONTERRA CO-OPERATIVE GROUP LIMITED: PRODUCT PORTFOLIO
TABLE 118.FONTERRA CO-OPERATIVE GROUP LIMITED: R&D EXPENDITURE, 2017–2019 ($MILLION)
TABLE 119.FONTERRA CO-OPERATIVE GROUP LIMITED: NET SALES, 2017–2019 ($MILLION)
TABLE 120.SAPUTO INC.: KEY EXECUTIVES
TABLE 121.SAPUTO INC.: COMPANY SNAPSHOT
TABLE 122.SAPUTO INC.: OPERATING SEGMENTS
TABLE 123.SAPUTO INC.: PRODUCT PORTFOLIO
TABLE 124.SAPUTO INC.: NET SALES, 2017–2019 ($MILLION)
TABLE 125.THE KRAFT HEINZ COMPANY: KEY EXECUTIVES
TABLE 126.THE KRAFT HEINZ COMPANY: COMPANY SNAPSHOT
TABLE 127.THE KRAFT HEINZ COMPANY: OPERATING SEGMENTS
TABLE 128.THE KRAFT HEINZ COMPANY: PRODUCT PORTFOLIO
TABLE 129.THE KRAFT HEINZ COMPANY: R&D EXPENDITURE, 2018–2020 ($MILLION)
TABLE 130.THE KRAFT HEINZ COMPANY: NET SALES, 2018–2020 ($MILLION)
TABLE 131.DODONI S.A.: KEY EXECUTIVES
TABLE 132.DODONI S.A.: COMPANY SNAPSHOT
TABLE 133.DODONI S.A.: PRODUCT PORTFOLIO
TABLE 134.KOLIOS S.A.: KEY EXECUTIVES
TABLE 135.KOLIOS S.A.: COMPANY SNAPSHOT
TABLE 136.KOLIOS S.A.: PRODUCT PORTFOLIO
TABLE 137.KOLIOS S.A.: NET SALES, 2017–2019 ($MILLION)
TABLE 138.MEVGAL: KEY EXECUTIVES
TABLE 139.MEVGAL: COMPANY SNAPSHOT
TABLE 140.MEVGAL: PRODUCT PORTFOLIO
TABLE 141.SADAFCO: KEY EXECUTIVES
TABLE 142.SADAFCO: COMPANY SNAPSHOT
TABLE 143.SADAFCO: OPERATING SEGMENTS
TABLE 144.SADAFCO: PRODUCT PORTFOLIO
TABLE 145.SADAFCO: NET SALES, 2017–2019 ($MILLION)
TABLE 146.CLOVER LEAF CHEESE: KEY EXECUTIVES
TABLE 147.CLOVER LEAF CHEESE: COMPANY SNAPSHOT
TABLE 148.CLOVER LEAF CHEESE: PRODUCT PORTFOLIO

FIGURE

FIGURE 01.GLOBAL FETA CHEESE MARKET SNAPSHOT
FIGURE 02.GLOBAL FETA CHEESE MARKET SEGMENTATION
FIGURE 03.TOP INVESTMENT POCKETS
FIGURE 04.PARENT MARKET ANALYSIS
FIGURE 05.VALUE CHAIN ANALYSIS
FIGURE 06.SUPPLY CHAIN ANALYSIS
FIGURE 07.MODERATE BARGAINING POWER OF SUPPLIERS
FIGURE 08.MODERATE BARGAINING POWER OF BUYERS
FIGURE 09.MODERATE THREAT OF SUBSTITUTION
FIGURE 10.MODERATE THREAT OF NEW ENTRANTS
FIGURE 11.MODERATE INTENSITY OF COMPETITIVE RIVALRY
FIGURE 12.FETA CHEESE MARKET: DRIVERS, RESTRAINTS, AND OPPORTUNITIES
FIGURE 13.TOP EXPORTING COUNTRIES OF FETA CHEESE, (%)
FIGURE 14.TOP IMPORTING COUNTRIES OF FETA CHEESE, (%)
FIGURE 15.GLOBAL FETA CHEESE MARKET, BY SOURCE, 2019 (%)
FIGURE 16.COMPARATIVE SHARE ANALYSIS OF COW MILK MARKET REVENUE FOR FETA CHEESE,  BY COUNTRY, 2019 & 2028 (%)
FIGURE 17.COMPARATIVE SHARE ANALYSIS OF SHEEP MILK MARKET REVENUE FOR FETA CHEESE,  2019 AND 2028 (%)
FIGURE 18.COMPARATIVE SHARE ANALYSIS OF GOAT MILK MARKET REVENUE FOR FETA CHEESE, 2019 AND 2028 (%)
FIGURE 19.GLOBAL FETA CHEESE MARKET, BY TYPE, 2019 (%)
FIGURE 20.COMPARATIVE COUNTRY MARKET SHARE ANALYSIS OF FETA CHEESE MARKET FOR BULGARIAN FETA, 2019 AND 2028 (%)
FIGURE 21.COMPARATIVE COUNTRY MARKET SHARE ANALYSIS OF FETA CHEESE MARKET FOR FRENCH FETA, 2019 AND 2028 (%)
FIGURE 22.COMPARATIVE COUNTRY MARKET SHARE ANALYSIS OF FETA CHEESE MARKET FOR GERMAN FETA, 2019 AND 2028 (%)
FIGURE 23.COMPARATIVE COUNTRY MARKET SHARE ANALYSIS OF FETA CHEESE MARKET FOR OTHER TYPES, 2019 AND 2028 (%)
FIGURE 24.GLOBAL FETA CHEESE MARKET, BY DISTRIBUTION CHANNEL, 2019 (%)
FIGURE 25.COMPARATIVE COUNTRY MARKET SHARE ANALYSIS OF FETA CHEESE MARKET FOR B2B, 2019 & 2028 (%)
FIGURE 26.COMPARATIVE COUNTRY MARKET SHARE ANALYSIS OF FETA CHEESE MARKET FOR B2C, 2019 AND 2028 (%)
FIGURE 27.FETA CHEESE MARKET, BY REGION, 2019 (%)
FIGURE 28.U.S. FETA CHEESE MARKET REVENUE, 2019–2028 ($MILLION)
FIGURE 29.CANADA FETA CHEESE MARKET REVENUE, 2019–2028 ($MILLION)
FIGURE 30.MEXICO FETA CHEESE MARKET REVENUE, 2019–2028 ($MILLION)
FIGURE 31.GERMANY FETA CHEESE MARKET REVENUE, 2019–2028 ($MILLION)
FIGURE 32.FRANCE FETA CHEESE MARKET REVENUE, 2019–2028 ($MILLION)
FIGURE 33.UK FETA CHEESE MARKET REVENUE, 2019–2028 ($MILLION)
FIGURE 34.ITALY FETA CHEESE MARKET REVENUE, 2019–2028 ($MILLION)
FIGURE 35.SPAIN FETA CHEESE MARKET REVENUE, 2019–2028 ($MILLION)
FIGURE 36.GREECE FETA CHEESE MARKET REVENUE, 2019–2028 ($MILLION)
FIGURE 37.REST OF EUROPE FETA CHEESE MARKET REVENUE, 2019–2028 ($MILLION)
FIGURE 38.CHINA FETA CHEESE MARKET REVENUE, 2019–2028 ($MILLION)
FIGURE 39.JAPAN FETA CHEESE MARKET REVENUE, 2019–2028 ($MILLION)
FIGURE 40.INDIA FETA CHEESE MARKET REVENUE, 2019–2028 ($MILLION)
FIGURE 41.AUSTRALIA FETA CHEESE MARKET REVENUE, 2019–2028 ($MILLION)
FIGURE 42.SOUTH KOREA FETA CHEESE MARKET REVENUE, 2019–2028 ($MILLION)
FIGURE 43.INDONESIA FETA CHEESE MARKET REVENUE, 2019–2028 ($MILLION)
FIGURE 44.SINGAPORE FETA CHEESE MARKET REVENUE, 2019–2028 ($MILLION)
FIGURE 45.REST OF ASIA-PACIFIC FETA CHEESE MARKET REVENUE, 2019–2028 ($MILLION)
FIGURE 46.BRAZIL FETA CHEESE MARKET REVENUE, 2019–2028 ($MILLION)
FIGURE 47.ARGENTINA FETA CHEESE MARKET REVENUE, 2019–2028 ($MILLION)
FIGURE 48.UNITED ARAB EMIRATES FETA CHEESE MARKET REVENUE, 2019–2028 ($MILLION)
FIGURE 49.NIGERIA FETA CHEESE MARKET REVENUE, 2019–2028 ($MILLION)
FIGURE 50.TURKEY FETA CHEESE MARKET REVENUE, 2019–2028 ($MILLION)
FIGURE 51.SOUTH AFRICA FETA CHEESE MARKET REVENUE, 2019–2028 ($MILLION)
FIGURE 52.REST OF LAMEA FETA CHEESE MARKET REVENUE, 2019–2028 ($MILLION)
FIGURE 53.TOP WINNING STRATEGIES, BY YEAR, 2017–2020*
FIGURE 54.TOP WINNING STRATEGIES, BY DEVELOPMENT, 2017–2020* (%)
FIGURE 55.PRODUCT MAPPING OF TOP 10 KEY PLAYERS
FIGURE 56.COMPETITIVE DASHBOARD OF TOP 10 KEY PLAYERS
FIGURE 57.COMPETITIVE HEATMAP OF TOP 10 KEY PLAYERS
FIGURE 58.ARLA FOODS AMBA: R&D EXPENDITURE, 2018–2020 ($MILLION)
FIGURE 59.ARLA FOODS AMBA: NET SALES, 2018-2020 ($MILLION)
FIGURE 60.ARLA FOODS AMBA: REVENUE SHARE BY SEGMENT, 2020 (%)
FIGURE 61.ARLA FOODS AMBA: REVENUE SHARE BY COUNTRY, 2020 (%)
FIGURE 62.FONTERRA CO-OPERATIVE GROUP LIMITED: R&D EXPENDITURE, 2017–2019 ($MILLION)
FIGURE 63.FONTERRA CO-OPERATIVE GROUP LIMITED: NET SALES, 2017–2019 ($MILLION)
FIGURE 64.FONTERRA CO-OPERATIVE GROUP LIMITED: REVENUE SHARE BY SEGMENT, 2019 (%)
FIGURE 65.SAPUTO INC.: NET SALES, 2017–2019 ($MILLION)
FIGURE 66.SAPUTO INC.: REVENUE SHARE BY SEGMENT, 2019 (%)
FIGURE 67.THE KRAFT HEINZ COMPANY: R&D EXPENDITURE, 2018–2020 ($MILLION)
FIGURE 68.THE KRAFT HEINZ COMPANY: NET SALES, 2018–2020 ($MILLION)
FIGURE 69.THE KRAFT HEINZ COMPANY: REVENUE SHARE BY SEGMENT, 2020 (%)
FIGURE 70.KOLIOS S.A.: NET SALES, 2017–2019 ($MILLION)
FIGURE 71.SADAFCO: NET SALES, 2017–2019 ($MILLION)
FIGURE 72.SADAFCO: REVENUE SHARE BY SEGMENT, 2019 (%)


Innovation in cheese processing is the key factor that significantly contributes toward the growth of the feta cheese market. Retail market expansion and improvement in economy further support the market growth. However, increase in health awareness and perishability of feta cheese are the factors that are projected to hinder the market growth. Surge in demand for fast food such as pizza and burger significantly boosts the demand for feta cheese. In addition, growth of fast-food chains such as McDonalds & Dominos is anticipated to have a significant impact on the consumption pattern of feta cheese.

PURCHASE OPTIONS

Call or Email us

U.S.-Canada Toll-free: +1-800-792-5285
Int'l : +1-503-894-6022
Europe : +44-845-528-1300
Email : help@alliedmarketresearch.com
 
FREQUENTLY ASKED QUESTIONS?

A. the Feta Cheese market will expand from 2021 – 2028 at a CAGR of 5.7%.

A. The market value of feta cheese by the end of 2028 is $15.6 Billion.

A. Expansion of quick-service restaurants, rise in popularity of European food culture, and surge in demand for protein-rich food are the top impacting factors for the market growth.

A. The top leading players in the feta cheese market are Arla Foods amba, Lactalis American Group, Inc., Fonterra Co-operative Group, Saputo Inc, The Kraft Heinz Company, Dodoni S.A., Kolios S.A. Mevgal, SADAFCO, and Clover Leaf Cheese Ltd.

A. The segments of the feta cheese market are source, type, and distribution channel.

A. The product launch, mergers and acquisition, and expansion are the growth strategies of the market players,

A. The sheep milk segment holds the major share in the market.

Looking for Customization?

 Customization Request

Have a Question?

 Speak with Analyst

Any Confusion?

 Inquire Before Buying

Have a glance of the Report

  Request Sample
RELATED TAGS

Purchase Full Report of
Feta Cheese Market

Start reading instantly.
This Report and over 68,244+ more Reports, Available with Avenue Library. T&C*.

  • Online Only
  • $3,712
  • Online cloud access only
  • Restricted print, copy, paste & download
  • Read only
  • Free industry update
    (Within 180 days)
  • Free report update in next update cycle
    (Jun 2022 - Jun 2023)
  • Data Pack
  • $4,125
  • Restricted to one authorized user
  • One print only
  • Available in
    Excel
  • Free industry update
    (Within 180 days)
  •   Free report update in next update cycle
    (Jun 2022 - Jun 2023)
  • Single User
  • $5,769
  • Restricted to one authorized user
  • One print only
  • Available in
    PDF
  • Free industry update
    (Within 180 days)
  •   Free report update in next update cycle
    (Jun 2022 - Jun 2023)
  • Five Users
  • $6,929
  • Limited to five authorized users
  • Print upto five copies
  • Available in
    PDF
  • Free industry update
    (Within 180 days)
  •   Free report update in next update cycle
    (Jun 2022 - Jun 2023)
  • Enterprise
    License/PDF

  • $10,663
  • Unlimited
    within
    company/enterprise
  • Available in Excel & PDF
  • Free industry update
    (Within 180 days)
  •   Free report update in next update cycle
    (Jun 2022 - Jun 2023)
  • Library
    Membership

  • $999 $ 1,175
    Per User/ Per month/ Billed annually
  • Published Content
    E-access
  • Company Profiles
    E-access
  • Newly Added Content Access
  • 10 PDF
    Downloads
  • 5 Excel Data
    Pack Downloads
  • 250 Company Profiles PDF Downloads
  • Buy Now

*Taxes/Fees, if applicable will be added during checkout. All prices in USD

RELATED REPORTS
 

Why Allied Market Research?


Infallible Methodology

To ensure high-level data integrity, accurate analysis, and impeccable forecasts

Analyst Support

For complete satisfaction

Customization

On-demand customization of scope of the report to exactly meet your needs

TARGETED MARKET VIEW

Targeted market view to provide pertinent information and save time of readers

Get fresh content delivered

Get insights on topics that are crucial for your business. Stay abreast of your interest areas.

Get Industry Data Alerts

Why Allied Market Research?

Infallible Methodology

To ensure high-level data integrity, accurate analysis, and impeccable forecasts

Analyst Support

For complete satisfaction

Customization

On-demand customization of scope of the report to exactly meet your needs

TARGETED MARKET VIEW

Targeted market view to provide pertinent information and save time of readers