0
New
New
2023
Food Texture Market

Food Texture Market

By Type (Cellulose Derivatives, Gums, Pectins, Gelatins, Starch, Inulin, Dextrins, Others), By Application (Dairy Products and Ice Creams, Confectionery, Jams, Layers, Fillings, Bakery, Meat Products, Ready Meals, Sauces, Beverage, Others), By Product (Natural, Synthetic): Global Opportunity Analysis and Industry Forecast, 2023-2032

Report Code: A15660
Jul 2023 | Pages: 378
Tables: 161
Charts: 83
  • Formats*:

  • pdf

    Single User License, Five User
    License & Enterprise User License

  • xls

    Data Pack Excel License

  • ppt

    It comes with the additional cost
    of $2500.00 contact sales.


Food Texture Market Research, 2032

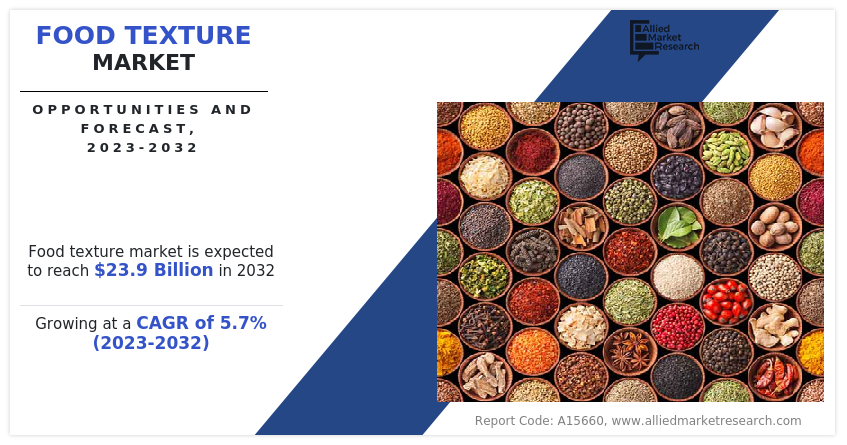
The global food texture market size was valued at $13.8 billion in 2022, and is projected to reach $23.9 billion by 2032, growing at a CAGR of 5.7% from 2023 to 2032.

The food texture market refers to the segment of the food industry that focuses on the texture of food products. Texture plays a crucial role in how we perceive and enjoy food, and it encompasses various sensory aspects such as the feel, consistency, and mouthfeel of a product. Food texture refers to the physical properties and sensations experienced when consuming food. It encompasses the way a food feels in the mouth, its consistency, and the sensations it produces during chewing and swallowing. Texture plays a crucial role in the overall sensory perception and enjoyment of food.

Changes in consumer behavior, limits on food service businesses, and global lockdowns have affected demand and supply dynamics. Demand for specialty and ready-to-eat food products decreased as a result of the closure of eateries, cafes, and other food service establishments. This had an impact on the market for products and ingredients used in these areas to improve texture. In addition, shoppers moved their focus away from texture-focused products to shelf-stable, convenient things. The pandemic affected international supply networks, making it difficult to find raw materials and supplies. The availability and pricing of texture-modifying agents were impacted by the price changes and supply problems that resulted from this.

Food Texture Market

The food texture market is projected to be fueled by evolving consumer preferences. The market for food textures has expanded as a result of the change in consumer tastes. Their preferences for particular textures in food products change as consumers get more sophisticated and seek distinctive, enjoyable, and personalized meal experiences. This increases the need for novel texture-enhancing services and goods. Customers look for new and fascinating textures in the foods they choose. They desire a variety of mouthfeels and feelings that go beyond conventional textures. To meet these changing demands, food producers are forced to create and market new items with distinctive textures.

Owing to the shift in customer preferences, technological improvements, and the rise in demand for processed & convenience foods, the food texture market has steadily expanded in recent years. The market includes a range of product categories, such as texture-modifying products, processing tools, and texturizing agents.

Clean label and natural food products have become more popular. Customers become more aware of the components in their food and favor goods without artificial preservatives and additions. As a result, natural texturizing ingredients such as pectin, agar, and guar gum, which enable texture alteration while passing clean label regulations, have become more popular in the food texture industry.

In addition, a greater emphasis is being placed on creating plant-based and alternative food products as a result of the rise in plant-based diets and the surge in demand for alternative protein sources. To replicate the textures of their animal-based counterparts, such as meat and dairy products, texture is necessary. As a result, there is an increase in texture solutions for food that can simulate the necessary textures in goods made from plants and other alternatives.

Moreover, consumers want customized dining experiences that cater to their unique interests. This includes specialized textures to fit their individual tastes and nutritional requirements. The market for food texture responds to this trend by providing a range of ingredients and customized texture solutions that let customers change or alter the texture of their food.

Companies in the food texture sector have a strategic opportunity to work with food makers. Providers of texture solutions can better meet the demands of manufacturers and create specialized texture solutions for their goods by collaborating closely with them. This teamwork method aids in developing distinctive textures and differentiating products in the marketplace.

Research and development in texture-improving substances have a lot of potential. A growing area of study is on creating innovative substances that can improve or alter textures while adhering to clean label and natural ingredient. Hydrocolloids, emulsifiers, and stabilizers are examples of texture-modifying innovations that present potential for businesses to grow their market share.

However, the overall cost of food products may increase if texture-enhancing additives and methods are used. Particularly in price-sensitive markets, the use of specialized texturizing agents and processing procedures may be constrained by their cost. Manufacturers continue to struggle with striking a balance between price and texture enhancement, which may somewhat constrain market expansion.

The food texture market is segmented on the basis of type, application, product, and region. On the basis of type, the market is classified into cellulose derivatives, gums, pectins, gelatins, starch, inulin, dextrins, and others. On the basis of application, the market is categorized into dairy products & ice creams, confectionery, jams, layers, fillings, bakery, meat products, ready meals, sauces, beverage, and others. By product, the market is bifurcated into natural and synthetic. Region-wise the market is analyzed across North America (the U.S., Canada, and Mexico), Europe (the UK, Germany, France, the Netherlands, Spain, Belgium, Russia, Poland, and rest of Europe), Asia-Pacific (China, Japan, India, South Korea, Australia, Indonesia, Thailand, Malaysia, and rest of Asia-Pacific), LAMEA (Brazil, South Africa, Saudi Arabia, and rest of LAMEA).

Food Texture Market

By type, the market is segmented into cellulose derivatives, gums, pectins, gelatins, starch, inulin, dextrins, and others. The Cellulose Derivatives segment accounted for a major share in the food texture market in 2022 and is expected to grow at a significant CAGR during the food texture market forecast period. The demand for cellulose derivatives has increased in view of increased consumer preference for clean labeling and ingredients derived solely from nature. This derivative is derived from plant and natural sources, making it a clean-label alternative to synthetic or chemical-modified ingredients. These are tools for food producers to increase the texture of their products whilst still meeting consumer demand for a more accurate and comprehensible list of ingredients.

Food Texture Market

According to the food texture market demand, by application, the market is classified into dairy products & ice creams, confectionery, jams, layers, fillings, bakery, meat products, ready meals, sauces, beverage, and others. The dairy products and ice creams segment accounted for a major share in the food texture market in 2022 and is expected to grow at a significant CAGR during the forecast period. Changing consumers' preferences, needs for product differentiation and desire to enhance sensory experience are leading to increased demand for texture-altering ingredients in dairy products and ice cream. A product with more texture, for example, smooth or creamy, is increasingly sought by consumers.

Food Texture Market

By product, the market is bifurcated into natural and synthetic. The natural segment accounted for a major share in the food texture market in 2022 and is expected to grow at a significant CAGR during the forecast period. Consumers are increasingly buying products with clean labels and natural ingredients. The rise in awareness of ingredients used by consumers and the need to be transparent with food labeling influence consumer behavior. With a view to responding to consumers' demands for clean and minimal processed options, natural products in the food texture market provide an alternative by offering texture enhancing ingredients derived from natural sources.

Food Texture Market

Region-wise, the market is analyzed across North America, Europe, Asia-Pacific, and LAMEA. The North America region accounted for a major share in the food texture market in 2022 and is expected to grow at a significant CAGR during the forecast period. The focus is on clean labels and natural ingredients in the North American food texture market. The issue of ingredients used in food has become increasingly important to consumers, and they continue to be sought for products that have more straightforward and identifiable ingredient lists. This has led to an increase in demand for organic and clean-label texture solutions, e.g., natural thickeners, and stabilizers.

The major players operating in the market focus on key market strategies, such as mergers, product launches, acquisitions, collaborations, and partnerships to increase their food texture market share. They have also been focusing on strengthening their market reach to maintain their goodwill in the ever-competitive market. Some of the key players in the food texture market include Cargill Incorporated,  DuPont de Nemours, Inc.., Ingredion Inc., Koninklijke DSM N.V., CP Kelco, Kerry Group PLC,  Jungbunzlauer Holding AG Deosen Biochemical (Ordos) Ltd., Euroduna Food Ingredients GmbH, and Archer Daniels Midland Company.

Key Benefits For Stakeholders

  • This report provides a quantitative analysis of the market segments, current trends, estimations, and dynamics of the food texture market analysis from 2022 to 2032 to identify the prevailing food texture market opportunities.
  • The market research is offered along with information related to key drivers, restraints, and opportunities.
  • Porter's five forces analysis highlights the potency of buyers and suppliers to enable stakeholders make profit-oriented business decisions and strengthen their supplier-buyer network.
  • In-depth analysis of the food texture market segmentation assists to determine the prevailing market opportunities.
  • Major countries in each region are mapped according to their revenue contribution to the global market.
  • Market player positioning facilitates benchmarking and provides a clear understanding of the present position of the market players.
  • The report includes the analysis of the regional as well as global food texture market trends, key players, market segments, application areas, and food texture market growth strategies.

Food Texture Market Report Highlights

Aspects Details
Market Size By 2032 USD 23.9 billion
Growth Rate CAGR of 5.7%
Forecast period 2022 - 2032
Report Pages 378
By Type
  • Gums
  • Pectins
  • Gelatins
  • Starch
  • Inulin
  • Dextrins
  • Others
  • Cellulose Derivatives
By Application
  • Dairy Products and Ice Creams
  • Confectionery
  • Jams
  • Layers
  • Fillings
  • Bakery
  • Ready Meals
  • Sauces
  • Beverage
  • Others
  • Meat Products
By Product
  • Natural
  • Synthetic
By Region
  • North America  (U.S., Canada, Mexico)
  • Europe  (UK, Germany, France, Netherlands, Spain, Belgium, Russia, Poland, Rest of Europe)
  • Asia-Pacific  (China, Japan, India, South Korea, Australia, Indonesia, Thailand, Malaysia, Rest of Asia-Pacific)
  • LAMEA  (Brazil, South Africa,, Saudi Arabia, Rest of LAMEA)
Key Market Players Euroduna Food Ingredients GmbH, Archer-Daniels-Midland Company, Koninklijke DSM N.V., Cargill, Incorporated, Jungbunzlauer Suisse AG, DuPont de Nemours, Inc., Kerry Group P.L.C., Deosen Biochemical (Ordos) Ltd., CP Kelco U.S., Inc, Ingredion Incorporated.

Analyst Review

According to the insights of the CXOs, the continuous growth in demand for food textures market is supported by an increase in developments within the food processing sector. Surge in industrial developments in the food processing sector, changes in consumers' preferences, growth in demand for convenience foodstuffs, and increased use of food texture agents in processed foods and beverages are expected to drive market growth. The market for food texture continues to expand, providing manufacturers with the opportunity to innovate and meet growing consumer demands across the globe in view of consumers' increasing sensory requirements and demand for convenience foods.

 
  • CHAPTER 1: INTRODUCTION

    • 1.1. Report description

    • 1.2. Key market segments

    • 1.3. Key benefits to the stakeholders

    • 1.4. Research Methodology

      • 1.4.1. Primary research

      • 1.4.2. Secondary research

      • 1.4.3. Analyst tools and models

  • CHAPTER 2: EXECUTIVE SUMMARY

    • 2.1. CXO Perspective

  • CHAPTER 3: MARKET OVERVIEW

    • 3.1. Market definition and scope

    • 3.2. Key findings

      • 3.2.1. Top impacting factors

      • 3.2.2. Top investment pockets

    • 3.3. Porter’s five forces analysis

      • 3.3.1. Moderate bargaining power of suppliers

      • 3.3.2. Low threat of new entrants

      • 3.3.3. High threat of substitutes

      • 3.3.4. Moderate intensity of rivalry

      • 3.3.5. Moderate to high bargaining power of buyers

    • 3.4. Market dynamics

      • 3.4.1. Drivers

        • 3.4.1.1. Evolving Consumer Preferences
        • 3.4.1.2. Product Differentiation and Innovation
        • 3.4.1.3. Health and Wellness Trends

      • 3.4.2. Restraints

        • 3.4.2.1. Regulatory and Labeling Challenges

      • 3.4.3. Opportunities

        • 3.4.3.1. Plant-Based and Alternative Protein Products
        • 3.4.3.2. Personalized Nutrition and Texture

    • 3.5. COVID-19 Impact Analysis on the market

  • CHAPTER 4: FOOD TEXTURE MARKET, BY TYPE

    • 4.1. Overview

      • 4.1.1. Market size and forecast

    • 4.2. Cellulose Derivatives

      • 4.2.1. Key market trends, growth factors and opportunities

      • 4.2.2. Market size and forecast, by region

      • 4.2.3. Market share analysis by country

    • 4.3. Gums

      • 4.3.1. Key market trends, growth factors and opportunities

      • 4.3.2. Market size and forecast, by region

      • 4.3.3. Market share analysis by country

    • 4.4. Pectins

      • 4.4.1. Key market trends, growth factors and opportunities

      • 4.4.2. Market size and forecast, by region

      • 4.4.3. Market share analysis by country

    • 4.5. Gelatins

      • 4.5.1. Key market trends, growth factors and opportunities

      • 4.5.2. Market size and forecast, by region

      • 4.5.3. Market share analysis by country

    • 4.6. Starch

      • 4.6.1. Key market trends, growth factors and opportunities

      • 4.6.2. Market size and forecast, by region

      • 4.6.3. Market share analysis by country

    • 4.7. Inulin

      • 4.7.1. Key market trends, growth factors and opportunities

      • 4.7.2. Market size and forecast, by region

      • 4.7.3. Market share analysis by country

    • 4.8. Dextrins

      • 4.8.1. Key market trends, growth factors and opportunities

      • 4.8.2. Market size and forecast, by region

      • 4.8.3. Market share analysis by country

    • 4.9. Others

      • 4.9.1. Key market trends, growth factors and opportunities

      • 4.9.2. Market size and forecast, by region

      • 4.9.3. Market share analysis by country

  • CHAPTER 5: FOOD TEXTURE MARKET, BY APPLICATION

    • 5.1. Overview

      • 5.1.1. Market size and forecast

    • 5.2. Dairy Products and Ice Creams

      • 5.2.1. Key market trends, growth factors and opportunities

      • 5.2.2. Market size and forecast, by region

      • 5.2.3. Market share analysis by country

    • 5.3. Confectionery

      • 5.3.1. Key market trends, growth factors and opportunities

      • 5.3.2. Market size and forecast, by region

      • 5.3.3. Market share analysis by country

    • 5.4. Jams

      • 5.4.1. Key market trends, growth factors and opportunities

      • 5.4.2. Market size and forecast, by region

      • 5.4.3. Market share analysis by country

    • 5.5. Layers

      • 5.5.1. Key market trends, growth factors and opportunities

      • 5.5.2. Market size and forecast, by region

      • 5.5.3. Market share analysis by country

    • 5.6. Fillings

      • 5.6.1. Key market trends, growth factors and opportunities

      • 5.6.2. Market size and forecast, by region

      • 5.6.3. Market share analysis by country

    • 5.7. Bakery

      • 5.7.1. Key market trends, growth factors and opportunities

      • 5.7.2. Market size and forecast, by region

      • 5.7.3. Market share analysis by country

    • 5.8. Meat Products

      • 5.8.1. Key market trends, growth factors and opportunities

      • 5.8.2. Market size and forecast, by region

      • 5.8.3. Market share analysis by country

    • 5.9. Ready Meals

      • 5.9.1. Key market trends, growth factors and opportunities

      • 5.9.2. Market size and forecast, by region

      • 5.9.3. Market share analysis by country

    • 5.10. Sauces

      • 5.10.1. Key market trends, growth factors and opportunities

      • 5.10.2. Market size and forecast, by region

      • 5.10.3. Market share analysis by country

    • 5.11. Beverage

      • 5.11.1. Key market trends, growth factors and opportunities

      • 5.11.2. Market size and forecast, by region

      • 5.11.3. Market share analysis by country

    • 5.12. Others

      • 5.12.1. Key market trends, growth factors and opportunities

      • 5.12.2. Market size and forecast, by region

      • 5.12.3. Market share analysis by country

  • CHAPTER 6: FOOD TEXTURE MARKET, BY PRODUCT

    • 6.1. Overview

      • 6.1.1. Market size and forecast

    • 6.2. Natural

      • 6.2.1. Key market trends, growth factors and opportunities

      • 6.2.2. Market size and forecast, by region

      • 6.2.3. Market share analysis by country

    • 6.3. Synthetic

      • 6.3.1. Key market trends, growth factors and opportunities

      • 6.3.2. Market size and forecast, by region

      • 6.3.3. Market share analysis by country

  • CHAPTER 7: FOOD TEXTURE MARKET, BY REGION

    • 7.1. Overview

      • 7.1.1. Market size and forecast By Region

    • 7.2. North America

      • 7.2.1. Key trends and opportunities

      • 7.2.2. Market size and forecast, by Type

      • 7.2.3. Market size and forecast, by Application

      • 7.2.4. Market size and forecast, by Product

      • 7.2.5. Market size and forecast, by country

        • 7.2.5.1. U.S.
          • 7.2.5.1.1. Key market trends, growth factors and opportunities
          • 7.2.5.1.2. Market size and forecast, by Type
          • 7.2.5.1.3. Market size and forecast, by Application
          • 7.2.5.1.4. Market size and forecast, by Product
        • 7.2.5.2. Canada
          • 7.2.5.2.1. Key market trends, growth factors and opportunities
          • 7.2.5.2.2. Market size and forecast, by Type
          • 7.2.5.2.3. Market size and forecast, by Application
          • 7.2.5.2.4. Market size and forecast, by Product
        • 7.2.5.3. Mexico
          • 7.2.5.3.1. Key market trends, growth factors and opportunities
          • 7.2.5.3.2. Market size and forecast, by Type
          • 7.2.5.3.3. Market size and forecast, by Application
          • 7.2.5.3.4. Market size and forecast, by Product
    • 7.3. Europe

      • 7.3.1. Key trends and opportunities

      • 7.3.2. Market size and forecast, by Type

      • 7.3.3. Market size and forecast, by Application

      • 7.3.4. Market size and forecast, by Product

      • 7.3.5. Market size and forecast, by country

        • 7.3.5.1. UK
          • 7.3.5.1.1. Key market trends, growth factors and opportunities
          • 7.3.5.1.2. Market size and forecast, by Type
          • 7.3.5.1.3. Market size and forecast, by Application
          • 7.3.5.1.4. Market size and forecast, by Product
        • 7.3.5.2. Germany
          • 7.3.5.2.1. Key market trends, growth factors and opportunities
          • 7.3.5.2.2. Market size and forecast, by Type
          • 7.3.5.2.3. Market size and forecast, by Application
          • 7.3.5.2.4. Market size and forecast, by Product
        • 7.3.5.3. France
          • 7.3.5.3.1. Key market trends, growth factors and opportunities
          • 7.3.5.3.2. Market size and forecast, by Type
          • 7.3.5.3.3. Market size and forecast, by Application
          • 7.3.5.3.4. Market size and forecast, by Product
        • 7.3.5.4. Netherlands
          • 7.3.5.4.1. Key market trends, growth factors and opportunities
          • 7.3.5.4.2. Market size and forecast, by Type
          • 7.3.5.4.3. Market size and forecast, by Application
          • 7.3.5.4.4. Market size and forecast, by Product
        • 7.3.5.5. Spain
          • 7.3.5.5.1. Key market trends, growth factors and opportunities
          • 7.3.5.5.2. Market size and forecast, by Type
          • 7.3.5.5.3. Market size and forecast, by Application
          • 7.3.5.5.4. Market size and forecast, by Product
        • 7.3.5.6. Belgium
          • 7.3.5.6.1. Key market trends, growth factors and opportunities
          • 7.3.5.6.2. Market size and forecast, by Type
          • 7.3.5.6.3. Market size and forecast, by Application
          • 7.3.5.6.4. Market size and forecast, by Product
        • 7.3.5.7. Russia
          • 7.3.5.7.1. Key market trends, growth factors and opportunities
          • 7.3.5.7.2. Market size and forecast, by Type
          • 7.3.5.7.3. Market size and forecast, by Application
          • 7.3.5.7.4. Market size and forecast, by Product
        • 7.3.5.8. Poland
          • 7.3.5.8.1. Key market trends, growth factors and opportunities
          • 7.3.5.8.2. Market size and forecast, by Type
          • 7.3.5.8.3. Market size and forecast, by Application
          • 7.3.5.8.4. Market size and forecast, by Product
        • 7.3.5.9. Rest of Europe
          • 7.3.5.9.1. Key market trends, growth factors and opportunities
          • 7.3.5.9.2. Market size and forecast, by Type
          • 7.3.5.9.3. Market size and forecast, by Application
          • 7.3.5.9.4. Market size and forecast, by Product
    • 7.4. Asia-Pacific

      • 7.4.1. Key trends and opportunities

      • 7.4.2. Market size and forecast, by Type

      • 7.4.3. Market size and forecast, by Application

      • 7.4.4. Market size and forecast, by Product

      • 7.4.5. Market size and forecast, by country

        • 7.4.5.1. China
          • 7.4.5.1.1. Key market trends, growth factors and opportunities
          • 7.4.5.1.2. Market size and forecast, by Type
          • 7.4.5.1.3. Market size and forecast, by Application
          • 7.4.5.1.4. Market size and forecast, by Product
        • 7.4.5.2. Japan
          • 7.4.5.2.1. Key market trends, growth factors and opportunities
          • 7.4.5.2.2. Market size and forecast, by Type
          • 7.4.5.2.3. Market size and forecast, by Application
          • 7.4.5.2.4. Market size and forecast, by Product
        • 7.4.5.3. India
          • 7.4.5.3.1. Key market trends, growth factors and opportunities
          • 7.4.5.3.2. Market size and forecast, by Type
          • 7.4.5.3.3. Market size and forecast, by Application
          • 7.4.5.3.4. Market size and forecast, by Product
        • 7.4.5.4. South Korea
          • 7.4.5.4.1. Key market trends, growth factors and opportunities
          • 7.4.5.4.2. Market size and forecast, by Type
          • 7.4.5.4.3. Market size and forecast, by Application
          • 7.4.5.4.4. Market size and forecast, by Product
        • 7.4.5.5. Australia
          • 7.4.5.5.1. Key market trends, growth factors and opportunities
          • 7.4.5.5.2. Market size and forecast, by Type
          • 7.4.5.5.3. Market size and forecast, by Application
          • 7.4.5.5.4. Market size and forecast, by Product
        • 7.4.5.6. Indonesia
          • 7.4.5.6.1. Key market trends, growth factors and opportunities
          • 7.4.5.6.2. Market size and forecast, by Type
          • 7.4.5.6.3. Market size and forecast, by Application
          • 7.4.5.6.4. Market size and forecast, by Product
        • 7.4.5.7. Thailand
          • 7.4.5.7.1. Key market trends, growth factors and opportunities
          • 7.4.5.7.2. Market size and forecast, by Type
          • 7.4.5.7.3. Market size and forecast, by Application
          • 7.4.5.7.4. Market size and forecast, by Product
        • 7.4.5.8. Malaysia
          • 7.4.5.8.1. Key market trends, growth factors and opportunities
          • 7.4.5.8.2. Market size and forecast, by Type
          • 7.4.5.8.3. Market size and forecast, by Application
          • 7.4.5.8.4. Market size and forecast, by Product
        • 7.4.5.9. Rest of Asia-Pacific
          • 7.4.5.9.1. Key market trends, growth factors and opportunities
          • 7.4.5.9.2. Market size and forecast, by Type
          • 7.4.5.9.3. Market size and forecast, by Application
          • 7.4.5.9.4. Market size and forecast, by Product
    • 7.5. LAMEA

      • 7.5.1. Key trends and opportunities

      • 7.5.2. Market size and forecast, by Type

      • 7.5.3. Market size and forecast, by Application

      • 7.5.4. Market size and forecast, by Product

      • 7.5.5. Market size and forecast, by country

        • 7.5.5.1. Brazil
          • 7.5.5.1.1. Key market trends, growth factors and opportunities
          • 7.5.5.1.2. Market size and forecast, by Type
          • 7.5.5.1.3. Market size and forecast, by Application
          • 7.5.5.1.4. Market size and forecast, by Product
        • 7.5.5.2. South Africa,
          • 7.5.5.2.1. Key market trends, growth factors and opportunities
          • 7.5.5.2.2. Market size and forecast, by Type
          • 7.5.5.2.3. Market size and forecast, by Application
          • 7.5.5.2.4. Market size and forecast, by Product
        • 7.5.5.3. Saudi Arabia
          • 7.5.5.3.1. Key market trends, growth factors and opportunities
          • 7.5.5.3.2. Market size and forecast, by Type
          • 7.5.5.3.3. Market size and forecast, by Application
          • 7.5.5.3.4. Market size and forecast, by Product
        • 7.5.5.4. Rest of LAMEA
          • 7.5.5.4.1. Key market trends, growth factors and opportunities
          • 7.5.5.4.2. Market size and forecast, by Type
          • 7.5.5.4.3. Market size and forecast, by Application
          • 7.5.5.4.4. Market size and forecast, by Product
  • CHAPTER 8: COMPETITIVE LANDSCAPE

    • 8.1. Introduction

    • 8.2. Top winning strategies

    • 8.3. Product Mapping of Top 10 Player

    • 8.4. Competitive Dashboard

    • 8.5. Competitive Heatmap

    • 8.6. Top player positioning, 2022

  • CHAPTER 9: COMPANY PROFILES

    • 9.1. Cargill, Incorporated

      • 9.1.1. Company overview

      • 9.1.2. Key Executives

      • 9.1.3. Company snapshot

      • 9.1.4. Operating business segments

      • 9.1.5. Product portfolio

      • 9.1.6. Key strategic moves and developments

    • 9.2. Ingredion Incorporated.

      • 9.2.1. Company overview

      • 9.2.2. Key Executives

      • 9.2.3. Company snapshot

      • 9.2.4. Operating business segments

      • 9.2.5. Product portfolio

      • 9.2.6. Business performance

      • 9.2.7. Key strategic moves and developments

    • 9.3. Koninklijke DSM N.V.

      • 9.3.1. Company overview

      • 9.3.2. Key Executives

      • 9.3.3. Company snapshot

      • 9.3.4. Operating business segments

      • 9.3.5. Product portfolio

      • 9.3.6. Business performance

    • 9.4. Archer-Daniels-Midland Company

      • 9.4.1. Company overview

      • 9.4.2. Key Executives

      • 9.4.3. Company snapshot

      • 9.4.4. Operating business segments

      • 9.4.5. Product portfolio

      • 9.4.6. Business performance

      • 9.4.7. Key strategic moves and developments

    • 9.5. CP Kelco U.S., Inc

      • 9.5.1. Company overview

      • 9.5.2. Key Executives

      • 9.5.3. Company snapshot

      • 9.5.4. Operating business segments

      • 9.5.5. Product portfolio

    • 9.6. Jungbunzlauer Suisse AG

      • 9.6.1. Company overview

      • 9.6.2. Key Executives

      • 9.6.3. Company snapshot

      • 9.6.4. Operating business segments

      • 9.6.5. Product portfolio

      • 9.6.6. Key strategic moves and developments

    • 9.7. Deosen Biochemical (Ordos) Ltd.

      • 9.7.1. Company overview

      • 9.7.2. Key Executives

      • 9.7.3. Company snapshot

      • 9.7.4. Operating business segments

      • 9.7.5. Product portfolio

    • 9.8. Euroduna Food Ingredients GmbH

      • 9.8.1. Company overview

      • 9.8.2. Key Executives

      • 9.8.3. Company snapshot

      • 9.8.4. Operating business segments

      • 9.8.5. Product portfolio

    • 9.9. Kerry Group P.L.C.

      • 9.9.1. Company overview

      • 9.9.2. Key Executives

      • 9.9.3. Company snapshot

      • 9.9.4. Operating business segments

      • 9.9.5. Product portfolio

      • 9.9.6. Business performance

    • 9.10. DuPont de Nemours, Inc.

      • 9.10.1. Company overview

      • 9.10.2. Key Executives

      • 9.10.3. Company snapshot

      • 9.10.4. Operating business segments

      • 9.10.5. Product portfolio

      • 9.10.6. Business performance

      • 9.10.7. Key strategic moves and developments

  • LIST OF TABLES

  • TABLE 01. GLOBAL FOOD TEXTURE MARKET, BY TYPE, 2022-2032 ($MILLION)
    TABLE 02. FOOD TEXTURE MARKET FOR CELLULOSE DERIVATIVES, BY REGION, 2022-2032 ($MILLION)
    TABLE 03. FOOD TEXTURE MARKET FOR GUMS, BY REGION, 2022-2032 ($MILLION)
    TABLE 04. FOOD TEXTURE MARKET FOR PECTINS, BY REGION, 2022-2032 ($MILLION)
    TABLE 05. FOOD TEXTURE MARKET FOR GELATINS, BY REGION, 2022-2032 ($MILLION)
    TABLE 06. FOOD TEXTURE MARKET FOR STARCH, BY REGION, 2022-2032 ($MILLION)
    TABLE 07. FOOD TEXTURE MARKET FOR INULIN, BY REGION, 2022-2032 ($MILLION)
    TABLE 08. FOOD TEXTURE MARKET FOR DEXTRINS, BY REGION, 2022-2032 ($MILLION)
    TABLE 09. FOOD TEXTURE MARKET FOR OTHERS, BY REGION, 2022-2032 ($MILLION)
    TABLE 10. GLOBAL FOOD TEXTURE MARKET, BY APPLICATION, 2022-2032 ($MILLION)
    TABLE 11. FOOD TEXTURE MARKET FOR DAIRY PRODUCTS AND ICE CREAMS, BY REGION, 2022-2032 ($MILLION)
    TABLE 12. FOOD TEXTURE MARKET FOR CONFECTIONERY, BY REGION, 2022-2032 ($MILLION)
    TABLE 13. FOOD TEXTURE MARKET FOR JAMS, BY REGION, 2022-2032 ($MILLION)
    TABLE 14. FOOD TEXTURE MARKET FOR LAYERS, BY REGION, 2022-2032 ($MILLION)
    TABLE 15. FOOD TEXTURE MARKET FOR FILLINGS, BY REGION, 2022-2032 ($MILLION)
    TABLE 16. FOOD TEXTURE MARKET FOR BAKERY, BY REGION, 2022-2032 ($MILLION)
    TABLE 17. FOOD TEXTURE MARKET FOR MEAT PRODUCTS, BY REGION, 2022-2032 ($MILLION)
    TABLE 18. FOOD TEXTURE MARKET FOR READY MEALS, BY REGION, 2022-2032 ($MILLION)
    TABLE 19. FOOD TEXTURE MARKET FOR SAUCES, BY REGION, 2022-2032 ($MILLION)
    TABLE 20. FOOD TEXTURE MARKET FOR BEVERAGE, BY REGION, 2022-2032 ($MILLION)
    TABLE 21. FOOD TEXTURE MARKET FOR OTHERS, BY REGION, 2022-2032 ($MILLION)
    TABLE 22. GLOBAL FOOD TEXTURE MARKET, BY PRODUCT, 2022-2032 ($MILLION)
    TABLE 23. FOOD TEXTURE MARKET FOR NATURAL, BY REGION, 2022-2032 ($MILLION)
    TABLE 24. FOOD TEXTURE MARKET FOR SYNTHETIC, BY REGION, 2022-2032 ($MILLION)
    TABLE 25. FOOD TEXTURE MARKET, BY REGION, 2022-2032 ($MILLION)
    TABLE 26. NORTH AMERICA FOOD TEXTURE MARKET, BY TYPE, 2022-2032 ($MILLION)
    TABLE 27. NORTH AMERICA FOOD TEXTURE MARKET, BY APPLICATION, 2022-2032 ($MILLION)
    TABLE 28. NORTH AMERICA FOOD TEXTURE MARKET, BY PRODUCT, 2022-2032 ($MILLION)
    TABLE 29. NORTH AMERICA FOOD TEXTURE MARKET, BY COUNTRY, 2022-2032 ($MILLION)
    TABLE 30. U.S. FOOD TEXTURE MARKET, BY TYPE, 2022-2032 ($MILLION)
    TABLE 31. U.S. FOOD TEXTURE MARKET, BY APPLICATION, 2022-2032 ($MILLION)
    TABLE 32. U.S. FOOD TEXTURE MARKET, BY PRODUCT, 2022-2032 ($MILLION)
    TABLE 33. CANADA FOOD TEXTURE MARKET, BY TYPE, 2022-2032 ($MILLION)
    TABLE 34. CANADA FOOD TEXTURE MARKET, BY APPLICATION, 2022-2032 ($MILLION)
    TABLE 35. CANADA FOOD TEXTURE MARKET, BY PRODUCT, 2022-2032 ($MILLION)
    TABLE 36. MEXICO FOOD TEXTURE MARKET, BY TYPE, 2022-2032 ($MILLION)
    TABLE 37. MEXICO FOOD TEXTURE MARKET, BY APPLICATION, 2022-2032 ($MILLION)
    TABLE 38. MEXICO FOOD TEXTURE MARKET, BY PRODUCT, 2022-2032 ($MILLION)
    TABLE 39. EUROPE FOOD TEXTURE MARKET, BY TYPE, 2022-2032 ($MILLION)
    TABLE 40. EUROPE FOOD TEXTURE MARKET, BY APPLICATION, 2022-2032 ($MILLION)
    TABLE 41. EUROPE FOOD TEXTURE MARKET, BY PRODUCT, 2022-2032 ($MILLION)
    TABLE 42. EUROPE FOOD TEXTURE MARKET, BY COUNTRY, 2022-2032 ($MILLION)
    TABLE 43. UK FOOD TEXTURE MARKET, BY TYPE, 2022-2032 ($MILLION)
    TABLE 44. UK FOOD TEXTURE MARKET, BY APPLICATION, 2022-2032 ($MILLION)
    TABLE 45. UK FOOD TEXTURE MARKET, BY PRODUCT, 2022-2032 ($MILLION)
    TABLE 46. GERMANY FOOD TEXTURE MARKET, BY TYPE, 2022-2032 ($MILLION)
    TABLE 47. GERMANY FOOD TEXTURE MARKET, BY APPLICATION, 2022-2032 ($MILLION)
    TABLE 48. GERMANY FOOD TEXTURE MARKET, BY PRODUCT, 2022-2032 ($MILLION)
    TABLE 49. FRANCE FOOD TEXTURE MARKET, BY TYPE, 2022-2032 ($MILLION)
    TABLE 50. FRANCE FOOD TEXTURE MARKET, BY APPLICATION, 2022-2032 ($MILLION)
    TABLE 51. FRANCE FOOD TEXTURE MARKET, BY PRODUCT, 2022-2032 ($MILLION)
    TABLE 52. NETHERLANDS FOOD TEXTURE MARKET, BY TYPE, 2022-2032 ($MILLION)
    TABLE 53. NETHERLANDS FOOD TEXTURE MARKET, BY APPLICATION, 2022-2032 ($MILLION)
    TABLE 54. NETHERLANDS FOOD TEXTURE MARKET, BY PRODUCT, 2022-2032 ($MILLION)
    TABLE 55. SPAIN FOOD TEXTURE MARKET, BY TYPE, 2022-2032 ($MILLION)
    TABLE 56. SPAIN FOOD TEXTURE MARKET, BY APPLICATION, 2022-2032 ($MILLION)
    TABLE 57. SPAIN FOOD TEXTURE MARKET, BY PRODUCT, 2022-2032 ($MILLION)
    TABLE 58. BELGIUM FOOD TEXTURE MARKET, BY TYPE, 2022-2032 ($MILLION)
    TABLE 59. BELGIUM FOOD TEXTURE MARKET, BY APPLICATION, 2022-2032 ($MILLION)
    TABLE 60. BELGIUM FOOD TEXTURE MARKET, BY PRODUCT, 2022-2032 ($MILLION)
    TABLE 61. RUSSIA FOOD TEXTURE MARKET, BY TYPE, 2022-2032 ($MILLION)
    TABLE 62. RUSSIA FOOD TEXTURE MARKET, BY APPLICATION, 2022-2032 ($MILLION)
    TABLE 63. RUSSIA FOOD TEXTURE MARKET, BY PRODUCT, 2022-2032 ($MILLION)
    TABLE 64. POLAND FOOD TEXTURE MARKET, BY TYPE, 2022-2032 ($MILLION)
    TABLE 65. POLAND FOOD TEXTURE MARKET, BY APPLICATION, 2022-2032 ($MILLION)
    TABLE 66. POLAND FOOD TEXTURE MARKET, BY PRODUCT, 2022-2032 ($MILLION)
    TABLE 67. REST OF EUROPE FOOD TEXTURE MARKET, BY TYPE, 2022-2032 ($MILLION)
    TABLE 68. REST OF EUROPE FOOD TEXTURE MARKET, BY APPLICATION, 2022-2032 ($MILLION)
    TABLE 69. REST OF EUROPE FOOD TEXTURE MARKET, BY PRODUCT, 2022-2032 ($MILLION)
    TABLE 70. ASIA-PACIFIC FOOD TEXTURE MARKET, BY TYPE, 2022-2032 ($MILLION)
    TABLE 71. ASIA-PACIFIC FOOD TEXTURE MARKET, BY APPLICATION, 2022-2032 ($MILLION)
    TABLE 72. ASIA-PACIFIC FOOD TEXTURE MARKET, BY PRODUCT, 2022-2032 ($MILLION)
    TABLE 73. ASIA-PACIFIC FOOD TEXTURE MARKET, BY COUNTRY, 2022-2032 ($MILLION)
    TABLE 74. CHINA FOOD TEXTURE MARKET, BY TYPE, 2022-2032 ($MILLION)
    TABLE 75. CHINA FOOD TEXTURE MARKET, BY APPLICATION, 2022-2032 ($MILLION)
    TABLE 76. CHINA FOOD TEXTURE MARKET, BY PRODUCT, 2022-2032 ($MILLION)
    TABLE 77. JAPAN FOOD TEXTURE MARKET, BY TYPE, 2022-2032 ($MILLION)
    TABLE 78. JAPAN FOOD TEXTURE MARKET, BY APPLICATION, 2022-2032 ($MILLION)
    TABLE 79. JAPAN FOOD TEXTURE MARKET, BY PRODUCT, 2022-2032 ($MILLION)
    TABLE 80. INDIA FOOD TEXTURE MARKET, BY TYPE, 2022-2032 ($MILLION)
    TABLE 81. INDIA FOOD TEXTURE MARKET, BY APPLICATION, 2022-2032 ($MILLION)
    TABLE 82. INDIA FOOD TEXTURE MARKET, BY PRODUCT, 2022-2032 ($MILLION)
    TABLE 83. SOUTH KOREA FOOD TEXTURE MARKET, BY TYPE, 2022-2032 ($MILLION)
    TABLE 84. SOUTH KOREA FOOD TEXTURE MARKET, BY APPLICATION, 2022-2032 ($MILLION)
    TABLE 85. SOUTH KOREA FOOD TEXTURE MARKET, BY PRODUCT, 2022-2032 ($MILLION)
    TABLE 86. AUSTRALIA FOOD TEXTURE MARKET, BY TYPE, 2022-2032 ($MILLION)
    TABLE 87. AUSTRALIA FOOD TEXTURE MARKET, BY APPLICATION, 2022-2032 ($MILLION)
    TABLE 88. AUSTRALIA FOOD TEXTURE MARKET, BY PRODUCT, 2022-2032 ($MILLION)
    TABLE 89. INDONESIA FOOD TEXTURE MARKET, BY TYPE, 2022-2032 ($MILLION)
    TABLE 90. INDONESIA FOOD TEXTURE MARKET, BY APPLICATION, 2022-2032 ($MILLION)
    TABLE 91. INDONESIA FOOD TEXTURE MARKET, BY PRODUCT, 2022-2032 ($MILLION)
    TABLE 92. THAILAND FOOD TEXTURE MARKET, BY TYPE, 2022-2032 ($MILLION)
    TABLE 93. THAILAND FOOD TEXTURE MARKET, BY APPLICATION, 2022-2032 ($MILLION)
    TABLE 94. THAILAND FOOD TEXTURE MARKET, BY PRODUCT, 2022-2032 ($MILLION)
    TABLE 95. MALAYSIA FOOD TEXTURE MARKET, BY TYPE, 2022-2032 ($MILLION)
    TABLE 96. MALAYSIA FOOD TEXTURE MARKET, BY APPLICATION, 2022-2032 ($MILLION)
    TABLE 97. MALAYSIA FOOD TEXTURE MARKET, BY PRODUCT, 2022-2032 ($MILLION)
    TABLE 98. REST OF ASIA-PACIFIC FOOD TEXTURE MARKET, BY TYPE, 2022-2032 ($MILLION)
    TABLE 99. REST OF ASIA-PACIFIC FOOD TEXTURE MARKET, BY APPLICATION, 2022-2032 ($MILLION)
    TABLE 100. REST OF ASIA-PACIFIC FOOD TEXTURE MARKET, BY PRODUCT, 2022-2032 ($MILLION)
    TABLE 101. LAMEA FOOD TEXTURE MARKET, BY TYPE, 2022-2032 ($MILLION)
    TABLE 102. LAMEA FOOD TEXTURE MARKET, BY APPLICATION, 2022-2032 ($MILLION)
    TABLE 103. LAMEA FOOD TEXTURE MARKET, BY PRODUCT, 2022-2032 ($MILLION)
    TABLE 104. LAMEA FOOD TEXTURE MARKET, BY COUNTRY, 2022-2032 ($MILLION)
    TABLE 105. BRAZIL FOOD TEXTURE MARKET, BY TYPE, 2022-2032 ($MILLION)
    TABLE 106. BRAZIL FOOD TEXTURE MARKET, BY APPLICATION, 2022-2032 ($MILLION)
    TABLE 107. BRAZIL FOOD TEXTURE MARKET, BY PRODUCT, 2022-2032 ($MILLION)
    TABLE 108. SOUTH AFRICA, FOOD TEXTURE MARKET, BY TYPE, 2022-2032 ($MILLION)
    TABLE 109. SOUTH AFRICA, FOOD TEXTURE MARKET, BY APPLICATION, 2022-2032 ($MILLION)
    TABLE 110. SOUTH AFRICA, FOOD TEXTURE MARKET, BY PRODUCT, 2022-2032 ($MILLION)
    TABLE 111. SAUDI ARABIA FOOD TEXTURE MARKET, BY TYPE, 2022-2032 ($MILLION)
    TABLE 112. SAUDI ARABIA FOOD TEXTURE MARKET, BY APPLICATION, 2022-2032 ($MILLION)
    TABLE 113. SAUDI ARABIA FOOD TEXTURE MARKET, BY PRODUCT, 2022-2032 ($MILLION)
    TABLE 114. REST OF LAMEA FOOD TEXTURE MARKET, BY TYPE, 2022-2032 ($MILLION)
    TABLE 115. REST OF LAMEA FOOD TEXTURE MARKET, BY APPLICATION, 2022-2032 ($MILLION)
    TABLE 116. REST OF LAMEA FOOD TEXTURE MARKET, BY PRODUCT, 2022-2032 ($MILLION)
    TABLE 117. CARGILL, INCORPORATED: KEY EXECUTIVES
    TABLE 118. CARGILL, INCORPORATED: COMPANY SNAPSHOT
    TABLE 119. CARGILL, INCORPORATED: PRODUCT SEGMENTS
    TABLE 120. CARGILL, INCORPORATED: PRODUCT PORTFOLIO
    TABLE 121. CARGILL, INCORPORATED: KEY STRATERGIES
    TABLE 122. INGREDION INCORPORATED.: KEY EXECUTIVES
    TABLE 123. INGREDION INCORPORATED.: COMPANY SNAPSHOT
    TABLE 124. INGREDION INCORPORATED.: PRODUCT SEGMENTS
    TABLE 125. INGREDION INCORPORATED.: PRODUCT PORTFOLIO
    TABLE 126. INGREDION INCORPORATED.: KEY STRATERGIES
    TABLE 127. KONINKLIJKE DSM N.V.: KEY EXECUTIVES
    TABLE 128. KONINKLIJKE DSM N.V.: COMPANY SNAPSHOT
    TABLE 129. KONINKLIJKE DSM N.V.: PRODUCT SEGMENTS
    TABLE 130. KONINKLIJKE DSM N.V.: PRODUCT PORTFOLIO
    TABLE 131. ARCHER-DANIELS-MIDLAND COMPANY: KEY EXECUTIVES
    TABLE 132. ARCHER-DANIELS-MIDLAND COMPANY: COMPANY SNAPSHOT
    TABLE 133. ARCHER-DANIELS-MIDLAND COMPANY: PRODUCT SEGMENTS
    TABLE 134. ARCHER-DANIELS-MIDLAND COMPANY: PRODUCT PORTFOLIO
    TABLE 135. ARCHER-DANIELS-MIDLAND COMPANY: KEY STRATERGIES
    TABLE 136. CP KELCO U.S., INC: KEY EXECUTIVES
    TABLE 137. CP KELCO U.S., INC: COMPANY SNAPSHOT
    TABLE 138. CP KELCO U.S., INC: PRODUCT SEGMENTS
    TABLE 139. CP KELCO U.S., INC: PRODUCT PORTFOLIO
    TABLE 140. JUNGBUNZLAUER SUISSE AG: KEY EXECUTIVES
    TABLE 141. JUNGBUNZLAUER SUISSE AG: COMPANY SNAPSHOT
    TABLE 142. JUNGBUNZLAUER SUISSE AG: PRODUCT SEGMENTS
    TABLE 143. JUNGBUNZLAUER SUISSE AG: PRODUCT PORTFOLIO
    TABLE 144. JUNGBUNZLAUER SUISSE AG: KEY STRATERGIES
    TABLE 145. DEOSEN BIOCHEMICAL (ORDOS) LTD.: KEY EXECUTIVES
    TABLE 146. DEOSEN BIOCHEMICAL (ORDOS) LTD.: COMPANY SNAPSHOT
    TABLE 147. DEOSEN BIOCHEMICAL (ORDOS) LTD.: PRODUCT SEGMENTS
    TABLE 148. DEOSEN BIOCHEMICAL (ORDOS) LTD.: PRODUCT PORTFOLIO
    TABLE 149. EURODUNA FOOD INGREDIENTS GMBH: KEY EXECUTIVES
    TABLE 150. EURODUNA FOOD INGREDIENTS GMBH: COMPANY SNAPSHOT
    TABLE 151. EURODUNA FOOD INGREDIENTS GMBH: PRODUCT SEGMENTS
    TABLE 152. EURODUNA FOOD INGREDIENTS GMBH: PRODUCT PORTFOLIO
    TABLE 153. KERRY GROUP P.L.C.: KEY EXECUTIVES
    TABLE 154. KERRY GROUP P.L.C.: COMPANY SNAPSHOT
    TABLE 155. KERRY GROUP P.L.C.: PRODUCT SEGMENTS
    TABLE 156. KERRY GROUP P.L.C.: PRODUCT PORTFOLIO
    TABLE 157. DUPONT DE NEMOURS, INC.: KEY EXECUTIVES
    TABLE 158. DUPONT DE NEMOURS, INC.: COMPANY SNAPSHOT
    TABLE 159. DUPONT DE NEMOURS, INC.: PRODUCT SEGMENTS
    TABLE 160. DUPONT DE NEMOURS, INC.: PRODUCT PORTFOLIO
    TABLE 161. DUPONT DE NEMOURS, INC.: KEY STRATERGIES
  • LIST OF FIGURES

  • FIGURE 01. FOOD TEXTURE MARKET, 2022-2032
    FIGURE 02. SEGMENTATION OF FOOD TEXTURE MARKET, 2022-2032
    FIGURE 03. TOP INVESTMENT POCKETS IN FOOD TEXTURE MARKET (2023-2032)
    FIGURE 04. MODERATE BARGAINING POWER OF SUPPLIERS
    FIGURE 05. LOW THREAT OF NEW ENTRANTS
    FIGURE 06. HIGH THREAT OF SUBSTITUTES
    FIGURE 07. MODERATE INTENSITY OF RIVALRY
    FIGURE 08. MODERATE TO HIGH BARGAINING POWER OF BUYERS
    FIGURE 09. DRIVERS, RESTRAINTS AND OPPORTUNITIES: GLOBALFOOD TEXTURE MARKET
    FIGURE 09. FOOD TEXTURE MARKET, BY TYPE, 2022(%)
    FIGURE 10. COMPARATIVE SHARE ANALYSIS OF FOOD TEXTURE MARKET FOR CELLULOSE DERIVATIVES, BY COUNTRY 2022 AND 2032(%)
    FIGURE 11. COMPARATIVE SHARE ANALYSIS OF FOOD TEXTURE MARKET FOR GUMS, BY COUNTRY 2022 AND 2032(%)
    FIGURE 12. COMPARATIVE SHARE ANALYSIS OF FOOD TEXTURE MARKET FOR PECTINS, BY COUNTRY 2022 AND 2032(%)
    FIGURE 13. COMPARATIVE SHARE ANALYSIS OF FOOD TEXTURE MARKET FOR GELATINS, BY COUNTRY 2022 AND 2032(%)
    FIGURE 14. COMPARATIVE SHARE ANALYSIS OF FOOD TEXTURE MARKET FOR STARCH, BY COUNTRY 2022 AND 2032(%)
    FIGURE 15. COMPARATIVE SHARE ANALYSIS OF FOOD TEXTURE MARKET FOR INULIN, BY COUNTRY 2022 AND 2032(%)
    FIGURE 16. COMPARATIVE SHARE ANALYSIS OF FOOD TEXTURE MARKET FOR DEXTRINS, BY COUNTRY 2022 AND 2032(%)
    FIGURE 17. COMPARATIVE SHARE ANALYSIS OF FOOD TEXTURE MARKET FOR OTHERS, BY COUNTRY 2022 AND 2032(%)
    FIGURE 18. FOOD TEXTURE MARKET, BY APPLICATION, 2022(%)
    FIGURE 19. COMPARATIVE SHARE ANALYSIS OF FOOD TEXTURE MARKET FOR DAIRY PRODUCTS AND ICE CREAMS, BY COUNTRY 2022 AND 2032(%)
    FIGURE 20. COMPARATIVE SHARE ANALYSIS OF FOOD TEXTURE MARKET FOR CONFECTIONERY, BY COUNTRY 2022 AND 2032(%)
    FIGURE 21. COMPARATIVE SHARE ANALYSIS OF FOOD TEXTURE MARKET FOR JAMS, BY COUNTRY 2022 AND 2032(%)
    FIGURE 22. COMPARATIVE SHARE ANALYSIS OF FOOD TEXTURE MARKET FOR LAYERS, BY COUNTRY 2022 AND 2032(%)
    FIGURE 23. COMPARATIVE SHARE ANALYSIS OF FOOD TEXTURE MARKET FOR FILLINGS, BY COUNTRY 2022 AND 2032(%)
    FIGURE 24. COMPARATIVE SHARE ANALYSIS OF FOOD TEXTURE MARKET FOR BAKERY, BY COUNTRY 2022 AND 2032(%)
    FIGURE 25. COMPARATIVE SHARE ANALYSIS OF FOOD TEXTURE MARKET FOR MEAT PRODUCTS, BY COUNTRY 2022 AND 2032(%)
    FIGURE 26. COMPARATIVE SHARE ANALYSIS OF FOOD TEXTURE MARKET FOR READY MEALS, BY COUNTRY 2022 AND 2032(%)
    FIGURE 27. COMPARATIVE SHARE ANALYSIS OF FOOD TEXTURE MARKET FOR SAUCES, BY COUNTRY 2022 AND 2032(%)
    FIGURE 28. COMPARATIVE SHARE ANALYSIS OF FOOD TEXTURE MARKET FOR BEVERAGE, BY COUNTRY 2022 AND 2032(%)
    FIGURE 29. COMPARATIVE SHARE ANALYSIS OF FOOD TEXTURE MARKET FOR OTHERS, BY COUNTRY 2022 AND 2032(%)
    FIGURE 30. FOOD TEXTURE MARKET, BY PRODUCT, 2022(%)
    FIGURE 31. COMPARATIVE SHARE ANALYSIS OF FOOD TEXTURE MARKET FOR NATURAL, BY COUNTRY 2022 AND 2032(%)
    FIGURE 32. COMPARATIVE SHARE ANALYSIS OF FOOD TEXTURE MARKET FOR SYNTHETIC, BY COUNTRY 2022 AND 2032(%)
    FIGURE 33. FOOD TEXTURE MARKET BY REGION, 2022
    FIGURE 34. U.S. FOOD TEXTURE MARKET, 2022-2032 ($MILLION)
    FIGURE 35. CANADA FOOD TEXTURE MARKET, 2022-2032 ($MILLION)
    FIGURE 36. MEXICO FOOD TEXTURE MARKET, 2022-2032 ($MILLION)
    FIGURE 37. UK FOOD TEXTURE MARKET, 2022-2032 ($MILLION)
    FIGURE 38. GERMANY FOOD TEXTURE MARKET, 2022-2032 ($MILLION)
    FIGURE 39. FRANCE FOOD TEXTURE MARKET, 2022-2032 ($MILLION)
    FIGURE 40. NETHERLANDS FOOD TEXTURE MARKET, 2022-2032 ($MILLION)
    FIGURE 41. SPAIN FOOD TEXTURE MARKET, 2022-2032 ($MILLION)
    FIGURE 42. BELGIUM FOOD TEXTURE MARKET, 2022-2032 ($MILLION)
    FIGURE 43. RUSSIA FOOD TEXTURE MARKET, 2022-2032 ($MILLION)
    FIGURE 44. POLAND FOOD TEXTURE MARKET, 2022-2032 ($MILLION)
    FIGURE 45. REST OF EUROPE FOOD TEXTURE MARKET, 2022-2032 ($MILLION)
    FIGURE 46. CHINA FOOD TEXTURE MARKET, 2022-2032 ($MILLION)
    FIGURE 47. JAPAN FOOD TEXTURE MARKET, 2022-2032 ($MILLION)
    FIGURE 48. INDIA FOOD TEXTURE MARKET, 2022-2032 ($MILLION)
    FIGURE 49. SOUTH KOREA FOOD TEXTURE MARKET, 2022-2032 ($MILLION)
    FIGURE 50. AUSTRALIA FOOD TEXTURE MARKET, 2022-2032 ($MILLION)
    FIGURE 51. INDONESIA FOOD TEXTURE MARKET, 2022-2032 ($MILLION)
    FIGURE 52. THAILAND FOOD TEXTURE MARKET, 2022-2032 ($MILLION)
    FIGURE 53. MALAYSIA FOOD TEXTURE MARKET, 2022-2032 ($MILLION)
    FIGURE 54. REST OF ASIA-PACIFIC FOOD TEXTURE MARKET, 2022-2032 ($MILLION)
    FIGURE 55. BRAZIL FOOD TEXTURE MARKET, 2022-2032 ($MILLION)
    FIGURE 56. SOUTH AFRICA, FOOD TEXTURE MARKET, 2022-2032 ($MILLION)
    FIGURE 57. SAUDI ARABIA FOOD TEXTURE MARKET, 2022-2032 ($MILLION)
    FIGURE 58. REST OF LAMEA FOOD TEXTURE MARKET, 2022-2032 ($MILLION)
    FIGURE 59. TOP WINNING STRATEGIES, BY YEAR
    FIGURE 60. TOP WINNING STRATEGIES, BY DEVELOPMENT
    FIGURE 61. TOP WINNING STRATEGIES, BY COMPANY
    FIGURE 62. PRODUCT MAPPING OF TOP 10 PLAYERS
    FIGURE 63. COMPETITIVE DASHBOARD
    FIGURE 64. COMPETITIVE HEATMAP: FOOD TEXTURE MARKET
    FIGURE 65. TOP PLAYER POSITIONING, 2022
    FIGURE 66. INGREDION INCORPORATED.: NET REVENUE, 2020-2022 ($MILLION)
    FIGURE 67. INGREDION INCORPORATED.: RESEARCH & DEVELOPMENT EXPENDITURE, 2020-2022 ($MILLION)
    FIGURE 68. INGREDION INCORPORATED.: REVENUE SHARE BY SEGMENT, 2022 (%)
    FIGURE 69. KONINKLIJKE DSM N.V.: NET SALES, 2018-2020 ($MILLION)
    FIGURE 70. KONINKLIJKE DSM N.V.: REVENUE SHARE BY SEGMENT, 2020 (%)
    FIGURE 71. KONINKLIJKE DSM N.V.: REVENUE SHARE BY REGION, 2020 (%)
    FIGURE 72. ARCHER-DANIELS-MIDLAND COMPANY: NET REVENUE, 2020-2022 ($MILLION)
    FIGURE 73. ARCHER-DANIELS-MIDLAND COMPANY: RESEARCH & DEVELOPMENT EXPENDITURE, 2020-2022 ($MILLION)
    FIGURE 74. ARCHER-DANIELS-MIDLAND COMPANY: REVENUE SHARE BY SEGMENT, 2022 (%)
    FIGURE 75. ARCHER-DANIELS-MIDLAND COMPANY: REVENUE SHARE BY REGION, 2022 (%)
    FIGURE 76. KERRY GROUP P.L.C.: NET SALES, 2020-2022 ($MILLION)
    FIGURE 77. KERRY GROUP P.L.C.: RESEARCH & DEVELOPMENT EXPENDITURE, 2020-2022 ($MILLION)
    FIGURE 78. KERRY GROUP P.L.C.: REVENUE SHARE BY SEGMENT, 2022 (%)
    FIGURE 79. KERRY GROUP P.L.C.: REVENUE SHARE BY REGION, 2022 (%)
    FIGURE 80. DUPONT DE NEMOURS, INC.: RESEARCH & DEVELOPMENT EXPENDITURE, 2019-2021
    FIGURE 81. DUPONT DE NEMOURS, INC.: NET REVENUE, 2019-2021 ($MILLION)
    FIGURE 82. DUPONT DE NEMOURS, INC.: REVENUE SHARE BY SEGMENT, 2021 (%)
    FIGURE 83. DUPONT DE NEMOURS, INC.: REVENUE SHARE BY REGION, 2021 (%)


PURCHASE OPTIONS

Call or Email us

U.S.-Canada Toll-free: +1-800-792-5285
Int'l : +1-503-894-6022
Europe : +44-845-528-1300
Email : help@alliedmarketresearch.com
 
FREQUENTLY ASKED QUESTIONS?

A. The global Food texture market registered a CAGR of 5.7% from 2023 to 2032.

A. Raise the query and paste the link of the specific report and our sales executive will revert with the sample.

A. The forecast period in the Food texture market report is from 2023 to 2032.

A. The report offers a comprehensive analysis of the key players such as Cargill Incorporated, DuPont de Nemours, Inc.., Ingredion Inc., Koninklijke DSM N.V., CP Kelco, Kerry Group PLC, Jungbunzlauer Holding AG Deosen Biochemical (Ordos) Ltd., Euroduna Food Ingredients GmbH, and Archer Daniels Midland Company.

A. The global Food texture market registered a CAGR of 5.7% from 2023 to 2032.

Looking for Customization?

 Customization Request

Have a Question?

 Speak with Analyst

Any Confusion?

 Inquire Before Buying

Have a glance of the Report

  Request Sample
RELATED TAGS

Purchase Full Report of
Food Texture Market

Start reading instantly.
This Report and over 68,244+ more Reports, Available with Avenue Library. T&C*.

  • Online Only
  • $3,570
  • Online cloud access only
  • Restricted print, copy, paste & download
  • Read only
  • Free industry update
    (Within 180 days)
  • Free report update in next update cycle
    (Jul 2024 - Jul 2025)
  • Data Pack
  • $3,840
  • Restricted to one authorized user
  • One print only
  • Available in
    Excel
  • Free industry update
    (Within 180 days)
  •   Free report update in next update cycle
    (Jul 2024 - Jul 2025)
  • Single User
  • $5,730
  • Restricted to one authorized user
  • One print only
  • Available in
    PDF
  • Free industry update
    (Within 180 days)
  •   Free report update in next update cycle
    (Jul 2024 - Jul 2025)
  • Five Users
  • $6,450
  • Limited to five authorized users
  • Print upto five copies
  • Available in
    PDF
  • Free industry update
    (Within 180 days)
  •   Free report update in next update cycle
    (Jul 2024 - Jul 2025)
  • Enterprise
    License/PDF

  • $9,600
  • Unlimited
    within
    company/enterprise
  • Available in Excel & PDF
  • Free industry update
    (Within 180 days)
  •   Free report update in next update cycle
    (Jul 2024 - Jul 2025)
  • Library
    Membership

  • $999 $ 1,175
    Per User/ Per month/ Billed annually
  • Published Content
    E-access
  • Company Profiles
    E-access
  • Newly Added Content Access
  • 10 PDF
    Downloads
  • 5 Excel Data
    Pack Downloads
  • 250 Company Profiles PDF Downloads
  • Buy Now

*Taxes/Fees, if applicable will be added during checkout. All prices in USD

RELATED REPORTS
 

Why Allied Market Research?


Infallible Methodology

To ensure high-level data integrity, accurate analysis, and impeccable forecasts

Analyst Support

For complete satisfaction

Customization

On-demand customization of scope of the report to exactly meet your needs

TARGETED MARKET VIEW

Targeted market view to provide pertinent information and save time of readers

Get fresh content delivered

Get insights on topics that are crucial for your business. Stay abreast of your interest areas.

Get Industry Data Alerts

Why Allied Market Research?

Infallible Methodology

To ensure high-level data integrity, accurate analysis, and impeccable forecasts

Analyst Support

For complete satisfaction

Customization

On-demand customization of scope of the report to exactly meet your needs

TARGETED MARKET VIEW

Targeted market view to provide pertinent information and save time of readers