Report Code: A04885 | Apr 2019 | Pages: 233 | ||
Tables: 139 | Charts: 55 |
|
Pandemic disrupted the entire world and affected many industries.
Get detailed COVID-19 impact analysis on the Gluten-free Pasta Market
Request Now !The global gluten-free pasta market was valued at $909.8 million in 2017 and is projected to reach $1,289.2 million by 2025, growing at a CAGR of 4.5% from 2018 to 2025.As of 2017, about 40 million population was known to be gluten-sensitive or gluten intolerant in the U.S., whereas approximately 70 million of the population was known to suffer from wheat intolerance in Europe. Therefore, these consumers prefer food products with no gluten content. This eventually triggers the demand for various gluten-free products including gluten-free pasta. According to the World Health Organization (WHO), food intolerance and sensitivities affect approximately 1-2% of the global population. WHO also reveals growing prevalence of celiac disease. Over the past two decades, there has been a rise in the number of consumers having intolerance to various food products such as dairy, meat, soy, as well as gluten, which has provided immense opportunities for the manufacturers of various free-from foods to gain higher revenues and share in the global market. Consumers with food intolerance are very conscious about their food intake. Various key food manufacturers strategize on coming up with free-from food products that cater to the requirement of food intolerant consumers owing to the growth in concern of the consumers about the ingredients in the food. Gluten-free pasta is one of these which eventually triggers gluten-free pasta market growth in terms of value sales.
Similarly, rise in concerns over celiac disease has been another critical factor that drives the growth of the gluten-free pasta market. Celiac is an autoimmune disorder where the parts of small intestine are damaged or destroyed by the immune system due to reaction from gluten ingestion. According to Agriculture and Agri-Food Canada, around 3 million American consumers are reported to suffer from celiac disease; whereas, in Europe 11 million people are suffering from celiac disease. Moreover, the prevalence of celiac disease is said to have higher probability in major parts of Asia-Pacific including India, China, Australia, and New Zealand. Food manufacturers focus on the introduction of gluten-free formats for their existing products, which cater to different requirements of the target customers due to the rise in number of celiac disease consumers. Thus, the pasta market endures a similar kind of trend. Some of the key European and North American countries that include Italy, Switzerland, Germany, France, and the U.S. experience an increase in the rate of pasta consumption. Therefore, the gluten-free pasta market forecast predicts North America and Europe to remain dominant regions during the study period.
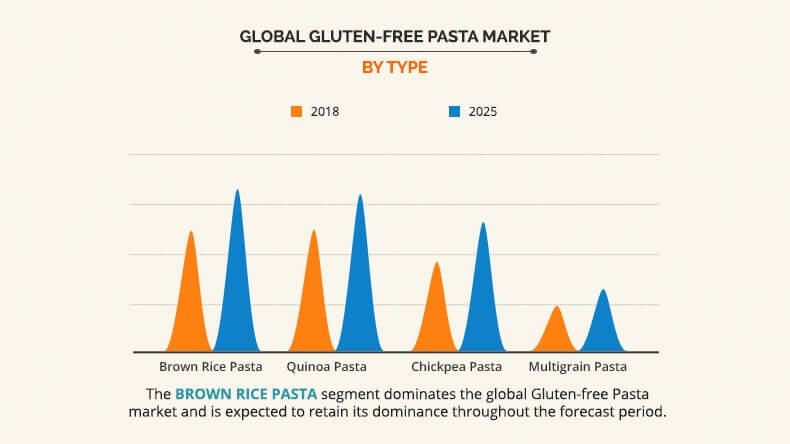
Based on product type, the gluten-free pasta market is segmented into brown rice pasta, quinoa pasta, chickpea pasta, and multigrain pasta. Among these, the brown rice pasta segment accounts for higher value gluten-free pasta market share. Brown rice pasta has mild flavor and chewy texture, which is considered as the potential substitute for traditional pasta dishes. It is one of the most popular gluten-free food products among consumers providing various types of health benefits altogether. Brown rice comprises of vitamins, minerals, and beneficial compounds, and thus, its consumption can help prevent or improve several health conditions, including diabetes and heart disease. This leads to an increase in demand from consumers suffering from celiac diseases as well as people adopting healthy lifestyle. Since the past couple of years, the global organic food and beverages market has been experiencing significant growth owing to rise in demand for various organic products. Therefore, some of the key manufacturers have strategized on coming up with organic formats of brown rice pastas. For instance, in 2013, a U.S. based food company, Lundberg Family Farms launched a new line of organic brown rice pasta for the North American market. Thus, emergence of organic food products is an influential gluten-free pasta market trend in the future.
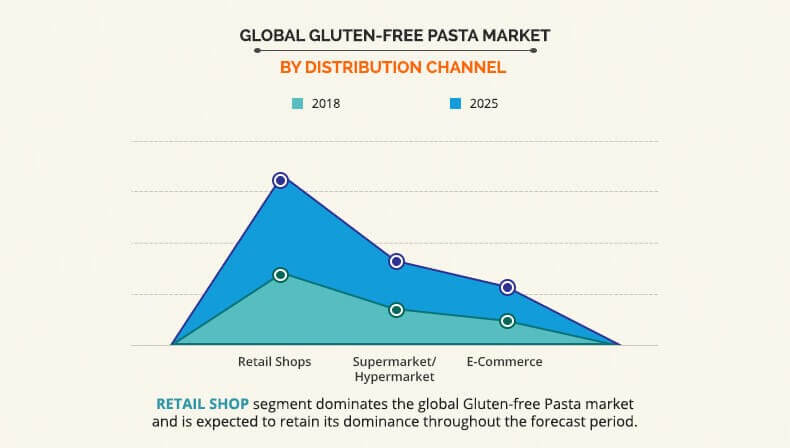
Based on the distribution channel, the gluten-free pasta market is segmented into retail shops, supermarket/hypermarket, and E-commerce. The retail shops sector comprises of various mortar-brick stores that range from specialty stores, independent stores to stand alone stores. Gluten-free pasta that is sold through various retail shops sectors has higher scope of gaining traction among the target customers. Specialty stores that specifically promote food products such as free-from products, organic products, and natural products provide a lot of opportunities for the growth of the gluten-free pasta market.
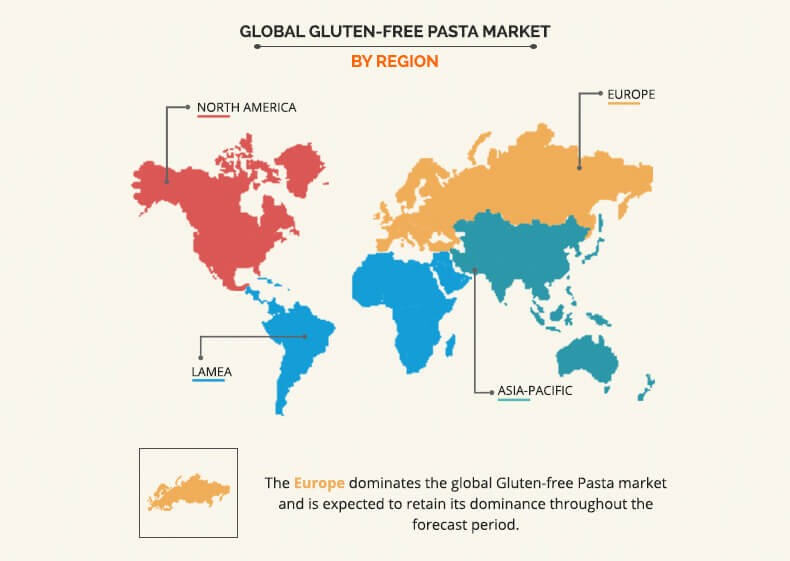
Based on region, the gluten-free pasta industry is analyzed across North America, Europe, Asia-Pacific, and LAMEA. The Europe gluten-free pasta market has experienced growth owing to various factors. Nearly 11 million people in Europe suffer from celiac disease and a further 70 million people suffer from wheat intolerance, which leads to more number of consumers switching to gluten-free diet. It is estimated that around 135 million Europeans avoid wheat or self-diagnose as intolerant, which makes gluten sensitivity a major concern in Europe. On the other hand, Europe has witnessed an increase in number of health-conscious consumers, which results in more than 60% of the consumers opting for gluten-free products. Therefore, gluten-free pasta market size is expected to grow at a faster rate during the forecast period in Europe.
Key players profiled for global gluten-free pasta market in the report include AMI Operating Inc., Quinoa Corporation, H.J. Heinz Company L.P., Barilla G.E R. F. LLI S.P.A., RPs Pasta Company, DR. SCHR AG/SPA, Bionaturae LLC, Jovial Foods Inc., Pastificio Lucio Garofalo S.p.A., and Doves Farm Foods Ltd.
Gluten-Free Pasta Market Report Highlights
Aspects | Details |
---|---|
By Product Type |
|
By DISTRIBUTION CHANNEL |
|
By Region |
|
Key Market Players | Ebro Foods, S.A. Group (Ebro), Barilla G. e R. F.lli S.p.A. P.I, Doves Farm Foods Ltd, The Hain Celestial Group, Inc. (Hain Celestial), Dr. Schär AG/SPA (Dr. Schär), Jovial Foods, Inc, Bionaturae, LLC, The Kraft Heinz Company (Heinz), Quinoa Corporation, RP's Pasta Company |
CHAPTER 1:Â Â Â INTRODUCTION
1.1.   Report description
1.2.   Key benefits for stakeholders
1.3.   Key market segments
1.4.   Research Methodology
1.4.1.   Primary Research
1.4.2.   Secondary Research
1.4.3.   Analyst Tools and Models
CHAPTER 2:Â Â Â EXECUTIVE SUMMARY
2.1.   Key findings of the study
2.2.   CXO perspective
CHAPTER 3:Â Â Â MARKET OVERVIEW
3.1.   Market definition and scope
3.2.   Key findings
3.2.1.   Top investment pocket
3.2.2.   Top winning strategies
3.3.   Porter's five forces analysis
3.3.1.   Bargaining power of suppliers
3.3.2.   Bargaining power of buyers
3.3.3.   Threat of substitution
3.3.4.   Threat of new entrants
3.3.5.   Intensity of competitive rivalry
3.4.   Top player positioning
3.5.   Market dynamics
3.5.1.   Drivers
3.5.1.1.   Rise in number of celiac disease patients in North America
3.5.1.2.   Surge in rate of pasta consumption
3.5.1.3.   Rise in demand for free-from products
3.5.1.4.   Rise in number of health-conscious as well as beauty conscious consumers
3.5.2.   Restraints
3.5.2.1.   High pricing of gluten-free products
3.5.2.2.   Unappealing taste and texture of the gluten-free products
3.5.3.   Opportunities
3.5.3.1.   Private Labelling of Gluten-free Products
3.5.3.2.   Lower pricing of Gluten-free products by Multinational and Small and Medium Enterprises (SMEs)
3.5.3.3.   Introduction of New Trends in the Asia-Pacific Market
3.6.   Global Pasta Production (Tons)
3.7.   Pasta Import – Export Scenario by Region (2014-2015)
3.8.   Gluten-Free Pasta Geographical concentration
3.9.   Gluten-Free Pasta: Pricing Analysis (2018 & 2025)
3.10.   Per Capita consumption of pasta in key countries
3.11.   Gluten-Free Pasta Consumer Buying Pattern
CHAPTER 4:Â Â Â GLUTEN-FREE PASTA MARKET, BY PRODUCT TYPE
4.1.   Overview
4.1.1.   Market size and forecast
4.2.   Brown Rice Pasta
4.2.1.   Key market trends, growth factors and opportunities
4.2.2.   Market size and forecast
4.2.3.   Market analysis by country
4.3.   Quinoa Pasta
4.3.1.   Key market trends, growth factors, and opportunities
4.3.2.   Market size and forecast
4.3.3.   Market analysis by country
4.4.   Chickpea Pasta
4.4.1.   Key market trends, growth factors, and opportunities
4.4.2.   Market size and forecast
4.4.3.   Market analysis by country
4.5.   Multigrain Pasta
4.5.1.   Key market trends, growth factors, and opportunities
4.5.2.   Market size and forecast
4.5.3.   Market analysis by country
CHAPTER 5:Â Â Â GLUTEN-FREE PASTA MARKET, BY DISTRIBUTION CHANNEL
5.1.   Overview
5.1.1.   Market size and forecast
5.2.   Retail Shops
5.2.1.   Key market trends, growth factors and opportunities
5.2.2.   Market size and forecast
5.2.3.   Market analysis by country
5.3.   Hypermarket/Supermarket
5.3.1.   Key market trends, growth factors, and opportunities
5.3.2.   Market size and forecast
5.3.3.   Market analysis by country
5.4.   E-Commerce
5.4.1.   Key market trends, growth factors, and opportunities
5.4.2.   Market size and forecast
5.4.3.   Market analysis by country
CHAPTER 6:Â Â Â GLUTEN-FREE PASTA MARKET, BY REGION
6.1.   Overview
6.1.1.   Market size and forecast
6.2.   North America
6.2.1.   Key market trends, growth factors and opportunities
6.2.2.   Market size and forecast by product type
6.2.3.   Market size and forecast by distribution channel
6.2.4.   Market size and forecast by country
6.2.5.   Pricing analysis by country
6.2.6.   U.S.
6.2.6.1.   Market size and forecast, by product type
6.2.6.2.   Market size and forecast, by distribution channel
6.2.7.   Canada
6.2.7.1.   Market size and forecast, by product type
6.2.7.2.   Market size and forecast, by distribution channel
6.2.8.   Mexico
6.2.8.1.   Market size and forecast, by product type
6.2.8.2.   Market size and forecast, by distribution channel
6.3.   Europe
6.3.1.   Key market trends, growth factors and opportunities
6.3.2.   Market size and forecast by product type
6.3.3.   Market size and forecast by distribution channel
6.3.4.   Market size and forecast by country
6.3.5.   Pricing analysis by country
6.3.6.   Germany
6.3.6.1.   Market size and forecast, by product type
6.3.6.2.   Market size and forecast, by distribution channel
6.3.7.   France
6.3.7.1.   Market size and forecast, by product type
6.3.7.2.   Market size and forecast, by distribution channel
6.3.8.   UK
6.3.8.1.   Market size and forecast, by product type
6.3.8.2.   Market size and forecast, by distribution channel
6.3.9.   Italy
6.3.9.1.   Market size and forecast, by product type
6.3.9.2.   Market size and forecast, by distribution channel
6.3.10.   Spain
6.3.10.1.   Market size and forecast, by product type
6.3.10.2.   Market size and forecast, by distribution channel
6.3.11.   Russia
6.3.11.1.   Market size and forecast, by product type
6.3.11.2.   Market size and forecast, by distribution channel
6.3.12.   Rest of Europe
6.3.12.1.   Market size and forecast, by product type
6.3.12.2.   Market size and forecast, by distribution channel
6.4.   Asia-Pacific
6.4.1.   Key market trends, growth factors and opportunities
6.4.2.   Market size and forecast by product type
6.4.3.   Market size and forecast by distribution channel
6.4.4.   Market size and forecast by country
6.4.5.   Pricing analysis by country
6.4.6.   China
6.4.6.1.   Market size and forecast, by product type
6.4.6.2.   Market size and forecast, by distribution channel
6.4.7.   India
6.4.7.1.   Market size and forecast, by product type
6.4.7.2.   Market size and forecast, by distribution channel
6.4.8.   Australia
6.4.8.1.   Market size and forecast, by product type
6.4.8.2.   Market size and forecast, by distribution channel
6.4.9.   ASEAN
6.4.9.1.   Market size and forecast, by product type
6.4.9.2.   Market size and forecast, by distribution channel
6.4.10.   South Korea
6.4.10.1.   Market size and forecast, by product type
6.4.10.2.   Market size and forecast, by distribution channel
6.4.11.   Rest of Asia-Pacific
6.4.11.1.   Market size and forecast, by product type
6.4.11.2.   Market size and forecast, by distribution channel
6.5.   LAMEA
6.5.1.   Key market trends, growth factors and opportunities
6.5.2.   Market size and forecast by product type
6.5.3.   Market size and forecast by distribution channel
6.5.4.   Market size and forecast by country
6.5.5.   Pricing analysis by country
6.5.6.   Brazil
6.5.6.1.   Market size and forecast, by product type
6.5.6.2.   Market size and forecast, by distribution channel
6.5.7.   Argentina
6.5.7.1.   Market size and forecast, by product type
6.5.7.2.   Market size and forecast, by distribution channel
6.5.8.   Chile
6.5.8.1.   Market size and forecast, by product type
6.5.8.2.   Market size and forecast, by distribution channel
6.5.9.   Columbia
6.5.9.1.   Market size and forecast, by product type
6.5.9.2.   Market size and forecast, by distribution channel
6.5.10.   Ecuador
6.5.10.1.   Market size and forecast, by product type
6.5.10.2.   Market size and forecast, by distribution channel
6.5.11.   Rest of LAMEA
6.5.11.1.   Market size and forecast, by product type
6.5.11.2.   Market size and forecast, by distribution channel
CHAPTER 7:Â Â Â COMPANY PROFILES
7.1.   Key Regional Players
7.2.   Barilla G. e R. F.lli S.p.A. P.I.
7.2.1.   Company overview
7.2.2.   Company snapshot
7.2.3.   Operating business segments
7.2.4.   Product portfolio
7.2.5.   Business performance
7.2.6.   Key strategic moves and developments
7.3.   Bionaturae, LLC
7.3.1.   Company overview
7.3.2.   Company snapshot
7.3.3.   Product portfolio
7.4.   Doves Farm Foods Ltd.
7.4.1.   Company overview
7.4.2.   Company snapshot
7.4.3.   Product portfolio
7.5.   Dr. Schär AG/SPA (Dr. Schär)
7.5.1.   Company overview
7.5.2.   Company snapshot
7.5.3.   Product portfolio
7.5.4.   Key strategic moves and developments
7.6.   The Hain Celestial Group, Inc. (Hain Celestial)
7.6.1.   Company overview
7.6.2.   Company snapshot
7.6.3.   Product Category
7.6.4.   Product portfolio
7.6.5.   Business performance
7.6.6.   Key strategic moves and developments
7.7.   Jovial Foods, Inc.
7.7.1.   Company overview
7.7.2.   Company snapshot
7.7.3.   Product portfolio
7.8.   Ebro Foods, S.A. Group (Ebro)
7.8.1.   Company overview
7.8.2.   Company snapshot
7.8.3.   Operating business segments
7.8.4.   Product portfolio
7.8.5.   Business performance
7.8.6.   Key strategic moves and developments
7.9.   Quinoa Corporation
7.9.1.   Company overview
7.9.2.   Company snapshot
7.9.3.   Product portfolio
7.9.4.   Key strategic moves and developments
7.10.   RP's Pasta Company
7.10.1.   Company overview
7.10.2.   Company snapshot
7.10.3.   Product portfolio
7.10.4.   Key strategic moves and developments
7.11.   The Kraft Heinz Company (Heinz)
7.11.1.   Company overview
7.11.2.   Company snapshot
7.11.3.   Operating business segments
7.11.4.   Product portfolio
7.11.5.   Business performance
7.11.6.   Key strategic moves and developments
LIST OF TABLES
TABLE 01.   GLOBAL GLUTEN-FREE PASTA MARKET, BY PRODUCT TYPE, 2017–2025 ($MILLION)
TABLE 02.   BROWN RICE PASTA IN GLUTEN-FREE PASTA MARKET, BY REGION, 2017–2025 ($MILLION)
TABLE 03.   QUINOA PASTA IN GLUTEN-FREE PASTA MARKET, BY REGION, 2017–2025 ($MILLION)
TABLE 04.   CHICKPEA PASTA IN GLUTEN-FREE PASTA MARKET, BY REGION, 2017–2025 ($MILLION)
TABLE 05.   MULTIGRAIN PASTA IN GLUTEN-FREE PASTA MARKET, BY REGION, 2017–2025 ($MILLION)
TABLE 06.   GLOBAL GLUTEN-FREE PASTA MARKET, BY PRODUCT TYPE, 2017–2025 ($MILLION)
TABLE 07.   GLUTEN-FREE PASTA MARKET FOR RETAIL SHOPS, BY REGION, 2017–2025 ($MILLION)
TABLE 08.   GLUTEN-FREE PASTA MARKET FOR HYPERMARKET/SUPERMARKET, BY REGION, 2017–2025 ($MILLION)
TABLE 09.   GLUTEN-FREE PASTA MARKET FOR E-COMMERCE, BY REGION, 2017–2025 ($MILLION)
TABLE 10.   GLUTEN-FREE PASTA MARKET, BY REGION, 2017–2025 ($MILLION)
TABLE 11.   GLUTEN-FREE PASTA MARKET, BY REGION, 2017–2025 (TONS)
TABLE 12.   NORTH AMERICA GLUTEN-FREE PASTA MARKET, BY PRODUCT TYPE, 2017–2025 ($MILLION)
TABLE 13.   NORTH AMERICA GLUTEN-FREE PASTA MARKET, BY DISTRIBUTION CHANNEL, 2017–2025 ($MILLION)
TABLE 14.   NORTH AMERICA GLUTEN-FREE PASTA MARKET, BY COUNTRY, 2017–2025 ($MILLION)
TABLE 15.   NORTH AMERICA GLUTEN-FREE PASTA MARKET, BY COUNTRY, 2017–2025 (TONS)
TABLE 16.   U.S. GLUTEN-FREE PASTA MARKET PRICING ANALYSIS, BY PRODUCT TYPE, 2018 & 2025 ($/TON)
TABLE 17.   CANADA GLUTEN-FREE PASTA MARKET PRICING ANALYSIS, BY PRODUCT TYPE, 2018 & 2025 ($/TON)
TABLE 18.   MEXICO GLUTEN-FREE PASTA MARKET PRICING ANALYSIS, BY PRODUCT TYPE, 2018 & 2025 ($/TON)
TABLE 19.   U.S. GLUTEN-FREE PASTA MARKET, BY PRODUCT TYPE, 2017–2025 ($MILLION)
TABLE 20.   U.S. GLUTEN-FREE PASTA MARKET, BY PRODUCT TYPE, 2017–2025 (TONS)
TABLE 21.   U.S. GLUTEN-FREE PASTA MARKET, BY DISTRIBUTION CHANNEL, 2017–2025 ($MILLION)
TABLE 22.   CANADA GLUTEN-FREE PASTA MARKET, BY PRODUCT TYPE, 2017–2025 ($MILLION)
TABLE 23.   CANADA GLUTEN-FREE PASTA MARKET, BY PRODUCT TYPE, 2017–2025 (TONS)
TABLE 24.   CANADA GLUTEN-FREE PASTA MARKET, BY DISTRIBUTION CHANNEL, 2017–2025 ($MILLION)
TABLE 25.   MEXICO GLUTEN-FREE PASTA MARKET, BY PRODUCT TYPE, 2017–2025 ($MILLION)
TABLE 26.   MEXICO GLUTEN-FREE PASTA MARKET, BY PRODUCT TYPE, 2017–2025 (TONS)
TABLE 27.   MEXICO GLUTEN-FREE PASTA MARKET, BY DISTRIBUTION CHANNEL, 2017–2025 ($MILLION)
TABLE 28.   EUROPE GLUTEN-FREE PASTA MARKET, BY PRODUCT TYPE, 2017–2025 ($MILLION)
TABLE 29.   EUROPE GLUTEN-FREE PASTA MARKET, BY DISTRIBUTION CHANNEL, 2017–2025 ($MILLION)
TABLE 30.   EUROPE GLUTEN-FREE PASTA MARKET, BY COUNTRY, 2017–2025 ($MILLION)
TABLE 31.   EUROPE GLUTEN-FREE PASTA MARKET, BY COUNTRY, 2017–2025 (TONS)
TABLE 32.   GERMANY GLUTEN-FREE PASTA MARKET PRICING ANALYSIS, BY PRODUCT TYPE, 2018 & 2025 ($/TON)
TABLE 33.   FRANCE GLUTEN-FREE PASTA MARKET PRICING ANALYSIS, BY PRODUCT TYPE, 2018 & 2025 ($/TON)
TABLE 34.   UK GLUTEN-FREE PASTA MARKET PRICING ANALYSIS, BY PRODUCT TYPE, 2018 & 2025 ($/TON)
TABLE 35.   ITALY GLUTEN-FREE PASTA MARKET PRICING ANALYSIS, BY PRODUCT TYPE, 2018 & 2025 ($/TON)
TABLE 36.   SPAIN GLUTEN-FREE PASTA MARKET PRICING ANALYSIS, BY PRODUCT TYPE, 2018 & 2025 ($/TON)
TABLE 37.   RUSSIA GLUTEN-FREE PASTA MARKET PRICING ANALYSIS, BY PRODUCT TYPE, 2018 & 2025 ($/TON)
TABLE 38.   REST OF EUROPE GLUTEN-FREE PASTA MARKET PRICING ANALYSIS, BY PRODUCT TYPE, 2018 & 2025 ($/TON)
TABLE 39.   GERMANY GLUTEN-FREE PASTA MARKET, BY PRODUCT TYPE, 2017–2025 ($MILLION)
TABLE 40.   GERMANY GLUTEN-FREE PASTA MARKET, BY PRODUCT TYPE, 2017–2025 (TONS)
TABLE 41.   GERMANY GLUTEN-FREE PASTA MARKET, BY DISTRIBUTION CHANNEL, 2017–2025 ($MILLION)
TABLE 42.   FRANCE GLUTEN-FREE PASTA MARKET, BY PRODUCT TYPE, 2017–2025 ($MILLION)
TABLE 43.   FRANCE GLUTEN-FREE PASTA MARKET, BY PRODUCT TYPE, 2017–2025 (TONS)
TABLE 44.   FRANCE GLUTEN-FREE PASTA MARKET, BY DISTRIBUTION CHANNEL, 2017–2025 ($MILLION)
TABLE 45.   UK GLUTEN-FREE PASTA MARKET, BY PRODUCT TYPE, 2017–2025 ($MILLION)
TABLE 46.   UK GLUTEN-FREE PASTA MARKET, BY PRODUCT TYPE, 2017–2025 (TONS)
TABLE 47.   UK GLUTEN-FREE PASTA MARKET, BY DISTRIBUTION CHANNEL, 2017–2025 ($MILLION)
TABLE 48.   ITALY GLUTEN-FREE PASTA MARKET, BY PRODUCT TYPE, 2017–2025 ($MILLION)
TABLE 49.   ITALY GLUTEN-FREE PASTA MARKET, BY PRODUCT TYPE, 2017–2025 (TONS)
TABLE 50.   ITALY GLUTEN-FREE PASTA MARKET, BY DISTRIBUTION CHANNEL, 2017–2025 ($MILLION)
TABLE 51.   SPAIN GLUTEN-FREE PASTA MARKET, BY PRODUCT TYPE, 2017–2025 ($MILLION)
TABLE 52.   SPAIN GLUTEN-FREE PASTA MARKET, BY PRODUCT TYPE, 2017–2025 (TONS)
TABLE 53.   SPAIN GLUTEN-FREE PASTA MARKET, BY DISTRIBUTION CHANNEL, 2017–2025 ($MILLION)
TABLE 54.   RUSSIA GLUTEN-FREE PASTA MARKET, BY PRODUCT TYPE, 2017–2025 ($MILLION)
TABLE 55.   RUSSIA GLUTEN-FREE PASTA MARKET, BY PRODUCT TYPE, 2017–2025 (TONS)
TABLE 56.   RUSSIA GLUTEN-FREE PASTA MARKET, BY DISTRIBUTION CHANNEL, 2017–2025 ($MILLION)
TABLE 57.   REST OF EUROPE GLUTEN-FREE PASTA MARKET, BY PRODUCT TYPE, 2017–2025 ($MILLION)
TABLE 58.   REST OF EUROPE GLUTEN-FREE PASTA MARKET, BY PRODUCT TYPE, 2017–2025 (TONS)
TABLE 59.   REST OF EUROPE GLUTEN-FREE PASTA MARKET, BY DISRTIBUTION CHANNEL, 2017–2025 ($MILLION)
TABLE 60.   ASIA-PACIFIC GLUTEN-FREE PASTA MARKET, BY PRODUCT TYPE, 2017–2025 ($MILLION)
TABLE 61.   ASIA-PACIFIC GLUTEN-FREE PASTA MARKET, BY DISTRIBUTION CHANNEL, 2017–2025 ($MILLION)
TABLE 62.   ASIA-PACIFIC GLUTEN-FREE PASTA MARKET, BY COUNTRY, 2017–2025 ($MILLION)
TABLE 63.   ASIA-PACIFIC GLUTEN-FREE PASTA MARKET, BY COUNTRY, 2017–2025 (TONS)
TABLE 64.   CHINA GLUTEN-FREE PASTA MARKET PRICING ANALYSIS, BY PRODUCT TYPE, 2018 & 2025 ($/TON)
TABLE 65.   INDIA GLUTEN-FREE PASTA MARKET PRICING ANALYSIS, BY PRODUCT TYPE, 2018 & 2025 ($/TON)
TABLE 66.   AUSTRALIA GLUTEN-FREE PASTA MARKET PRICING ANALYSIS, BY PRODUCT TYPE, 2018 & 2025 ($/TON)
TABLE 67.   ASEAN GLUTEN-FREE PASTA MARKET PRICING ANALYSIS, BY PRODUCT TYPE, 2018 & 2025 ($/TON)
TABLE 68.   SOUTH KOREA GLUTEN-FREE PASTA MARKET PRICING ANALYSIS, BY PRODUCT TYPE, 2018 & 2025 ($/TON)
TABLE 69.   REST OF ASIA-PACIFIC GLUTEN-FREE PASTA MARKET PRICING ANALYSIS, BY PRODUCT TYPE, 2018 & 2025 ($/TON)
TABLE 70.   CHINA GLUTEN-FREE PASTA MARKET, BY PRODUCT TYPE, 2017–2025 ($MILLION)
TABLE 71.   CHINA GLUTEN-FREE PASTA MARKET, BY PRODUCT TYPE, 2017–2025 (TONS)
TABLE 72.   CHINA GLUTEN-FREE PASTA MARKET, BY DISTRIBUTION CHANNEL, 2017–2025 ($MILLION)
TABLE 73.   INDIA GLUTEN-FREE PASTA MARKET, BY PRODUCT TYPE, 2017–2025 ($MILLION)
TABLE 74.   INDIA GLUTEN-FREE PASTA MARKET, BY PRODUCT TYPE, 2017–2025 (TONS)
TABLE 75.   INDIA GLUTEN-FREE PASTA MARKET, BY DISTRIBUTION CHANNEL, 2017–2025 ($MILLION)
TABLE 76.   AUSTRALIA GLUTEN-FREE PASTA MARKET, BY PRODUCT TYPE, 2017–2025 ($MILLION)
TABLE 77.   AUSTRALIA GLUTEN-FREE PASTA MARKET, BY PRODUCT TYPE, 2017–2025 (TONS)
TABLE 78.   AUSTRALIA GLUTEN-FREE PASTA MARKET, BY DISTRIBUTION CHANNEL, 2017–2025 ($MILLION)
TABLE 79.   ASEAN GLUTEN-FREE PASTA MARKET, BY PRODUCT TYPE, 2017–2025 ($MILLION)
TABLE 80.   ASEAN GLUTEN-FREE PASTA MARKET, BY PRODUCT TYPE, 2017–2025 (TONS)
TABLE 81.   ASEAN GLUTEN-FREE PASTA MARKET, BY DISTRIBUTION CHANNEL, 2017–2025 ($MILLION)
TABLE 82.   SOUTH KOREA GLUTEN-FREE PASTA MARKET, BY PRODUCT TYPE, 2017–2025 ($MILLION)
TABLE 83.   SOUTH KOREA GLUTEN-FREE PASTA MARKET, BY PRODUCT TYPE, 2017–2025 (TONS)
TABLE 84.   SOUTH KOREA GLUTEN-FREE PASTA MARKET, BY DISTRIBUTION CHANNEL, 2017–2025 ($MILLION)
TABLE 85.   REST OF ASIA-PACIFIC GLUTEN-FREE PASTA MARKET, BY PRODUCT TYPE, 2017–2025 ($MILLION)
TABLE 86.   REST OF ASIA-PACIFIC GLUTEN-FREE PASTA MARKET, BY PRODUCT TYPE, 2017–2025 (TONS)
TABLE 87.   REST OF ASIA-PACIFIC GLUTEN-FREE PASTA MARKET, BY DISTRIBUTION CHANNEL, 2017–2025 ($MILLION)
TABLE 88.   LAMEA GLUTEN-FREE PASTA MARKET, BY PRODUCT TYPE, 2017–2025 ($MILLION)
TABLE 89.   LAMEA GLUTEN-FREE PASTA MARKET, BY DITRIBUTION CHANNEL, 2017–2025 ($MILLION)
TABLE 90.   LAMEA GLUTEN-FREE PASTA MARKET, BY COUNTRY, 2017–2025 ($MILLION)
TABLE 91.   LAMEA GLUTEN-FREE PASTA MARKET, BY COUNTRY, 2017–2025 (TONS)
TABLE 92.   BRAZIL GLUTEN-FREE PASTA MARKET PRICING ANALYSIS, BY PRODUCT TYPE, 2018 & 2025 ($/TON)
TABLE 93.   ARGENTINA GLUTEN-FREE PASTA MARKET PRICING ANALYSIS, BY PRODUCT TYPE, 2018 & 2025 ($/TON)
TABLE 94.   CHILE GLUTEN-FREE PASTA MARKET PRICING ANALYSIS, BY PRODUCT TYPE, 2018 & 2025 ($/TON)
TABLE 95.   COLOMBIA GLUTEN-FREE PASTA MARKET PRICING ANALYSIS, BY PRODUCT TYPE, 2018 & 2025 ($/TON)
TABLE 96.   ECUADOR GLUTEN-FREE PASTA MARKET PRICING ANALYSIS, BY PRODUCT TYPE, 2018 & 2025 ($/TON)
TABLE 97.   REST OF LAMEA GLUTEN-FREE PASTA MARKET PRICING ANALYSIS, BY PRODUCT TYPE, 2018 & 2025 ($/TON)
TABLE 98.   BRAZIL GLUTEN-FREE PASTA MARKET, BY PRODUCT TYPE, 2017–2025 ($MILLION)
TABLE 99.   BRAZIL GLUTEN-FREE PASTA MARKET, BY PRODUCT TYPE, 2017–2025 (TONS)
TABLE 100.   BRAZIL GLUTEN-FREE PASTA MARKET, BY DISTRIBUTION CHANNEL, 2017–2025 ($MILLION)
TABLE 101.   ARGENTINA GLUTEN-FREE PASTA MARKET, BY PRODUCT TYPE, 2017–2025 ($MILLION)
TABLE 102.   ARGENTINA GLUTEN-FREE PASTA MARKET, BY PRODUCT TYPE, 2017–2025 (TONS)
TABLE 103.   ARGENTINA GLUTEN-FREE PASTA MARKET, BY DISTRIBUTION CHANNEL, 2017–2025 ($MILLION)
TABLE 104.   CHILE GLUTEN-FREE PASTA MARKET, BY PRODUCT TYPE, 2017–2025 ($MILLION)
TABLE 105.   CHILE GLUTEN-FREE PASTA MARKET, BY PRODUCT TYPE, 2017–2025 (TONS)
TABLE 106.   CHILE GLUTEN-FREE PASTA MARKET, BY DISTRIBUTION CHANNEL, 2017–2025 ($MILLION)
TABLE 107.   COLUMBIA GLUTEN-FREE PASTA MARKET, BY PRODUCT TYPE, 2017–2025 ($MILLION)
TABLE 108.   COLUMBIA GLUTEN-FREE PASTA MARKET, BY PRODUCT TYPE, 2017–2025 (TONS)
TABLE 109.   COLUMBIA GLUTEN-FREE PASTA MARKET, BY DISTRIBUTION CHANNEL, 2017–2025 ($MILLION)
TABLE 110.   ECUADOR GLUTEN-FREE PASTA MARKET, BY PRODUCT TYPE, 2017–2025 ($MILLION)
TABLE 111.   ECUADOR GLUTEN-FREE PASTA MARKET, BY PRODUCT TYPE, 2017–2025 (TONS)
TABLE 112.   ECUADOR GLUTEN-FREE PASTA MARKET, BY DISTRIBUTION CHANNEL, 2017–2025 ($MILLION)
TABLE 113.   REST OF LAMEA GLUTEN-FREE PASTA MARKET, BY PRODUCT TYPE, 2017–2025 ($MILLION)
TABLE 114.   REST OF LAMEA GLUTEN-FREE PASTA MARKET, BY PRODUCT TYPE, 2017–2025 (TONS)
TABLE 115.   REST OF LAMEA GLUTEN-FREE PASTA MARKET, BY DISTRIBUTION CHANNEL, 2017–2025 ($MILLION)
TABLE 116.   BARILLA G. E R. F.LLI S.P.A. P.I.: COMPANY SNAPSHOT
TABLE 117.   BARILLA G. E R. F.LLI S.P.A. P.I.: OPERATING SEGMENTS
TABLE 118.   BARILLA G. E R. F.LLI S.P.A. P.I.: PRODUCT PORTFOLIO
TABLE 119.   BIONATURAE, LLC: COMPANY SNAPSHOT
TABLE 120.   BIONATURAE, LLC: PRODUCT PORTFOLIO
TABLE 121.   DOVES FARM FOODS LTD.: COMPANY SNAPSHOT
TABLE 122.   DOVES FARM FOODS LTD.: PRODUCT PORTFOLIO
TABLE 123.   DR. SCHÄR: COMPANY SNAPSHOT
TABLE 124.   DR. SCHÄR: PRODUCT PORTFOLIO
TABLE 125.   HAIN CELESTIAL: COMPANY SNAPSHOT
TABLE 126.   HAIN CELESTIAL: PRODUCT CATOGERY
TABLE 127.   HAIN CELESTIAL: PRODUCT PORTFOLIO
TABLE 128.   JOVIAL FOODS, INC.: COMPANY SNAPSHOT
TABLE 129.   JOVIAL FOODS, INC.: PRODUCT PORTFOLIO
TABLE 130.   EBRO: COMPANY SNAPSHOT
TABLE 131.   EBRO: OPERATING SEGMENTS
TABLE 132.   EBRO: PRODUCT PORTFOLIO
TABLE 133.   QUINOA CORPORATION: COMPANY SNAPSHOT
TABLE 134.   QUINOA CORPORATION: PRODUCT PORTFOLIO
TABLE 135.   RP'S PASTA COMPANY: COMPANY SNAPSHOT
TABLE 136.   RP'S PASTA COMPANY: PRODUCT PORTFOLIO
TABLE 137.   HEINZ: COMPANY SNAPSHOT
TABLE 138.   HEINZ: OPERATING SEGMENTS
TABLE 139.   HEINZ: PRODUCT PORTFOLIO
LIST OF FIGURES
FIGURE 01.   GLUTEN-FREE PASTA MARKET SNAPSHOT
FIGURE 02.   TOP INVESTMENT POCKETS
FIGURE 03.   TOP WINNING STRATEGIES, BY YEAR, 2016-2018
FIGURE 04.   TOP WINNING STRATEGIES, BY DEVELOPMENT, 2016-2018 (%)
FIGURE 05.   TOP WINNING STRATEGIES, BY COMPANY, 2016-2018
FIGURE 06.   MODERATE BARGAINING POWER OF SUPPLIERS
FIGURE 07.   MODERATE BARGAINING POWER OF BUYERS
FIGURE 08.   HIGH THREAT OF SUBSTITUTION
FIGURE 09.   MODERATE THREAT OF NEW ENTRANTS
FIGURE 10.   MODERATE INTENSITY OF COMPETITIVE RIVALRY
FIGURE 11.   TOP PLAYER POSITIONING
FIGURE 12.   GLOBAL GLUTEN-FREE PASTA MARKET SHARE, BY PRODUCT TYPE, 2017(%)
FIGURE 13.   COMPARATIVE SHARE ANALYSIS OF BROWN RICE PASTA IN GLUTEN-FREE PASTA MARKET, BY COUNTRY, 2017 & 2025 (%)
FIGURE 14.   COMPARATIVE SHARE ANALYSIS OF QUINOA PASTA IN GLUTEN-FREE PASTA MARKET, BY COUNTRY, 2017 & 2025 (%)
FIGURE 15.   COMPARATIVE SHARE ANALYSIS OF CHICKPEA PASTA IN GLUTEN-FREE PASTA MARKET, BY COUNTRY, 2017 & 2025 (%)
FIGURE 16.   COMPARATIVE SHARE ANALYSIS OF MULTIGRAIN PASTA IN GLUTEN-FREE PASTA MARKET, BY COUNTRY, 2017 & 2025 (%)
FIGURE 17.   GLOBAL GLUTEN-FREE PASTA MARKET SHARE, BY DISTRIBUTION CHANNEL, 2017(%)
FIGURE 18.   COMPARATIVE SHARE ANALYSIS OF GLUTEN-FREE PASTA MARKET FOR RETAIL SHOPS, BY COUNTRY, 2017 & 2025 (%)
FIGURE 19.   COMPARATIVE SHARE ANALYSIS OF GLUTEN-FREE PASTA MARKET FOR HYPERMARKET/SUPERMARKET, BY COUNTRY, 2017 & 2025 (%)
FIGURE 20.   COMPARATIVE SHARE ANALYSIS OF GLUTEN-FREE PASTA MARKET FOR E-COMMERCE, BY COUNTRY, 2017 & 2025 (%)
FIGURE 21.   GLUTEN-FREE PASTA MARKET SHARE BY REGION, 2017(%)
FIGURE 22.   U.S. GLUTEN-FREE PASTA MARKET, 2017–2025 ($MILLION)
FIGURE 23.   CANADA GLUTEN-FREE PASTA MARKET, 2017–2025 ($MILLION)
FIGURE 24.   MEXICO GLUTEN-FREE PASTA MARKET, 2017–2025 ($MILLION)
FIGURE 25.   GERMANY GLUTEN-FREE PASTA MARKET, 2017–2025 ($MILLION)
FIGURE 26.   FRANCE GLUTEN-FREE PASTA MARKET, 2017–2025 ($MILLION)
FIGURE 27.   UK GLUTEN-FREE PASTA MARKET, 2017–2025 ($MILLION)
FIGURE 28.   ITALY GLUTEN-FREE PASTA MARKET, 2017–2025 ($MILLION)
FIGURE 29.   SPAIN GLUTEN-FREE PASTA MARKET, 2017–2025 ($MILLION)
FIGURE 30.   RUSSIA GLUTEN-FREE PASTA MARKET, 2017–2025 ($MILLION)
FIGURE 31.   REST OF EUROPE GLUTEN-FREE PASTA MARKET, 2017–2025 ($MILLION)
FIGURE 32.   CHINA GLUTEN-FREE PASTA MARKET, 2017–2025 ($MILLION)
FIGURE 33.   INDIA GLUTEN-FREE PASTA MARKET, 2017–2025 ($MILLION)
FIGURE 34.   AUSTRALIA GLUTEN-FREE PASTA MARKET, 2017–2025 ($MILLION)
FIGURE 35.   ASEAN GLUTEN-FREE PASTA MARKET, 2017–2025 ($MILLION)
FIGURE 36.   SOUTH KOREA GLUTEN-FREE PASTA MARKET, 2017–2025 ($MILLION)
FIGURE 37.   REST OF ASIA-PACIFIC GLUTEN-FREE PASTA MARKET, 2017–2025 ($MILLION)
FIGURE 38.   BRAZIL GLUTEN-FREE PASTA MARKET, 2017–2025 ($MILLION)
FIGURE 39.   ARGENTINA GLUTEN-FREE PASTA MARKET, 2017–2025 ($MILLION)
FIGURE 40.   CHILE GLUTEN-FREE PASTA MARKET, 2017–2025 ($MILLION)
FIGURE 41.   COLUMBIA GLUTEN-FREE PASTA MARKET, 2017–2025 ($MILLION)
FIGURE 42.   ECUADOR GLUTEN-FREE PASTA MARKET, 2017–2025 ($MILLION)
FIGURE 43.   REST OF LAMEA GLUTEN-FREE PASTA MARKET, 2017–2025 ($MILLION)
FIGURE 44.   BARILLA G. E R. F.LLI S.P.A. P.I.: NET SALES, 2016–2017 ($MILLION)
FIGURE 45.   BARILLA G. E R. F.LLI S.P.A. P.I.: REVENUE SHARE BY SEGMENT, 2018 (%)
FIGURE 46.   BARILLA G. E R. F.LLI S.P.A. P.I.: REVENUE SHARE BY REGION, 2018 (%)
FIGURE 47.   HAIN CELESTIAL: NET SALES, 2016–2017 ($MILLION)
FIGURE 48.   HAIN CELESTIAL: REVENUE SHARE BY PRODUCT CATEGORY, 2018 (%)
FIGURE 49.   HAIN CELESTIAL: REVENUE SHARE BY REGION, 2018 (%)
FIGURE 50.   EBRO: NET SALES, 2015–2017 ($MILLION)
FIGURE 51.   EBRO: REVENUE SHARE BY SEGMENT, 2017 (%)
FIGURE 52.   EBRO: REVENUE SHARE BY REGION, 2017 (%)
FIGURE 53.   HEINZ: NET SALES, 2015–2017 ($MILLION)
FIGURE 54.   HEINZ: REVENUE SHARE BY SEGMENT, 2017 (%)
FIGURE 55.   HEINZ: REVENUE SHARE BY REGION, 2017 (%)
According to some of the leading gluten-free pasta manufacturers, the rise in number of celiac diseases patients and gluten-intolerant consumers drive the growth of the gluten-free pasta market especially in North America and Europe. In the recent past, companies strategize on evolving its product offering in terms of taste and texture. For some of the key regional players in the gluten-free pasta market, the emergence of private label manufacturers has been sighted as a major threat since they avail their gluten-free products at a comparatively lower price. The Asia-Pacific region paves opportunity for investment for some of the tier-I companies owing to rise in millennial population and surge in number of health-conscious customers.
Over the past couple of years, there has been rise in number of health-conscious consumers due to the increase in awareness about the various benefits associated with the adoption of a healthy lifestyle. These consumers seek food products, which are natural, and have minimal amount of sugar or fat, cutting down of carb, as well as gluten. This sustaining trend and preference for healthy food products among the target customers foster the demand for various free-from products such as dairy free products, vegan products, meat alternatives, as well as gluten-free products.
Â
Start reading instantly.
This Report and over 66,804+ more Reports, Available with Avenue Library. T&C*.
Enterprise
License/PDF
Library
Membership
*Taxes/Fees, if applicable will be added during checkout. All prices in USD
To ensure high-level data integrity, accurate analysis, and impeccable forecasts
For complete satisfaction
On-demand customization of scope of the report to exactly meet your needs
Targeted market view to provide pertinent information and save time of readers
Get insights on topics that are crucial for your business. Stay abreast of your interest areas.
Get Industry Data AlertsTo ensure high-level data integrity, accurate analysis, and impeccable forecasts
For complete satisfaction
On-demand customization of scope of the report to exactly meet your needs
Targeted market view to provide pertinent information and save time of readers