0
New
New
2023
Human Identification Market

Human Identification Market

by Product (Instruments, Assay Kits and Reagents, Software), by Technology (Polymerase Chain Reaction, Next-Generation Sequencing, Capillary Electrophoresis, Others), by Application (Forensic Applications, Paternity Identification, Others), by End User (Forensic Laboratories, Research Centers and Academic and Government Institutes): Global Opportunity Analysis and Industry Forecast, 2023-2032

Report Code: A12954
Aug 2023 | Pages: 350
Tables: 192
Charts: 67
  • Formats*:

  • pdf

    Single User License, Five User
    License & Enterprise User License

  • xls

    Data Pack Excel License

  • ppt

    It comes with the additional cost
    of $2500.00 contact sales.


Human Identification Market Research, 2032

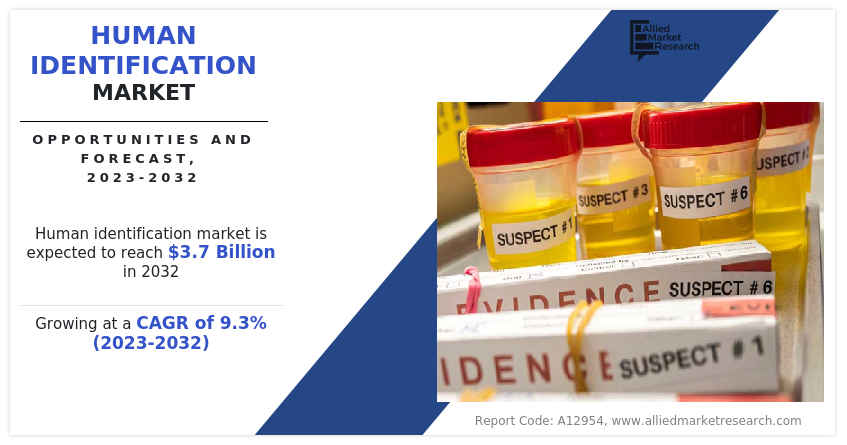
The global human identification market size was valued at $1.5 billion in 2022 and is projected to reach $3.7 billion by 2032, growing at a CAGR of 9.3% from 2023 to 2032. Human identification is defined as the branch of science, which is involved in the identification and authentication of individuals using various biometric technologies and systems. This technique is based on the distinguishing of ridges found on the fingers of the suspect because every human possesses unique formations and categorization of ridges. Human identification technology is mostly used in forensic laboratories for the analysis of blood, hair, DNA, skin, and teeth. 
The COVID-19 pandemic had a significant impact on the human identification market. The pandemic disrupted R&D activities in the human identification market. Restrictions on travel, social distancing measures, and disruptions in supply chains affected the ability of companies and research institutions to conduct experiments, collaborate, and develop new technologies. This resulted in delays in the introduction of innovative solutions and slowed down the pace of technological advancements.

Human Identification Market

Market Dynamics 

The human identification market size is expected to grow significantly, owing to technological advancement in human identification systems, a rise in funding from private and government organizations for forensic programs, and a surge in the number of crime cases. 

Technological advancements play a crucial role in shaping the field of human identification systems, thus driving the human identification market growth. These advancements have revolutionized the way individuals are identified, enhancing security measures, and streamlining various processes. Every year, advancements in DNA profiling techniques and technologies continue to emerge. For instance, in May 2022, Promega launched a new Spectrum CE System, a new capillary electrophoresis instrument that supports future 8-color technology while maintaining compatibility with existing 5- and 6-color kits. This instrument offers forensic analysts unparalleled flexibility in processing samples through short tandem repeat (STR) analysis. It eliminates scheduling difficulties and accommodates chemistry from major vendors, introducing a new choice for capillary electrophoresis (CE) instruments to support the workflow of human identification in criminal casework and database cases. 

Furthermore, the human identification market has experienced a significant rise in funding from both, private and government organizations, serving as a major driving force behind its growth. Governments across the globe have also recognized the critical importance of human identification systems in ensuring national security, public safety, and efficient service delivery. As a result, governments are actively investing in the development and implementation of advanced identification technologies. For instance, in 2022, the Department of Justice’s Office of Justice Programs (OJP) announced almost $160 million in grant awards to support crime laboratories, fund forensics research, decrease DNA backlogs, and help investigators locate missing persons and identify human remains. Furthermore, in 2021, the Department of Justice's Office of Justice Programs (OJP) granted awards totaling more than $210 million to fund crime laboratories, support research and help law enforcement identify missing persons. 

Furthermore, in recent years, there has been a noticeable increase in criminal activities globally. With the rising number of crime cases, there is an urgent demand for reliable and rapid human identification techniques. Law enforcement agencies rely heavily on these technologies to solve crimes, identify suspects, and link individuals to criminal activities. As law enforcement agencies and security forces strive to combat these threats, the need for accurate and efficient methods of human identification has become paramount. For instance, As of July 2022, the Mexican government registered more than 101,300 cases of missing or disappeared persons. To tackle this situation the government of Mexico approved the proposal for the National Center for Human Identification, which is meant to search for those who have disappeared and help authorities properly handle and identify human remains.  

However, the high cost of genomic instruments and the lack of skilled professionals and trained personnel are expected to act as significant restraints during the human identification market forecast. Genomic instruments such as DNA sequencers and other specialized equipment are crucial for human identification processes, including DNA profiling and analysis. These instruments are often expensive to acquire, maintain, and operate. The cost of genomic instruments can be a barrier for many laboratories and organizations involved in human identification, particularly smaller or resource-limited institutions. Human identification techniques involve complex procedures, including DNA extraction, amplification, sequencing, and data analysis. Skilled professionals are required to perform these tasks accurately and efficiently. Without skilled and trained personnel, the instruments may not be utilized to their full potential, leading to suboptimal performance and results. The lack of trained personnel can restrict the scalability of human identification operations and hinder the adoption of new technologies or methodologies. 

The COVID-19 pandemic had negative impacts on the human identification industry, particularly concerning DNA analysis techniques. One significant challenge has been the disruption of forensic DNA analysis processes and casework. The pandemic caused delays and backlogs in forensic laboratories, as social distancing measures and reduced staffing have affected their operational capacity. This resulted in a slowdown in DNA analysis, leading to prolonged waiting times for results and affecting the timely resolution of criminal cases. In addition, the pandemic impacted the use of DNA analysis in other areas, such as paternity testing and genealogy services. Social distancing measures and limited availability of testing facilities led to delays and disruptions in conducting these tests. Families seeking paternity verification or individuals interested in tracing their ancestry experienced setbacks and prolonged waiting times for results. In the post-pandemic phase, the market has recovered significantly, owing to the rise in demand for DNA analysis and rise in the crime rates. 

Segmental Overview 

The human identification market is segmented on the basis of product, technology, application, end users, and region. On the basis of the product, the market is categorized into instruments, assay kits and reagents, and software. The instruments segment is further classified into polymerase chain reaction instruments, capillary electrophoresis instruments, next-generation sequencing instruments, and others. The others include microarray, rapid DNA analysis, automated liquid handling, and nucleic acid isolation and purification instruments. By applications, the market is categorized into forensic applications, paternity identification, and others. The other applications include population genetics, anthropology application, identification of crime related to human trafficking, and disaster victim identification. On the basis of end users, the market is categorized into forensic laboratories and research centers and academic and government institutes. On the basis of region, the market is analyzed across North America, Europe, Asia-Pacific, and LAMEA. 

By Product:  

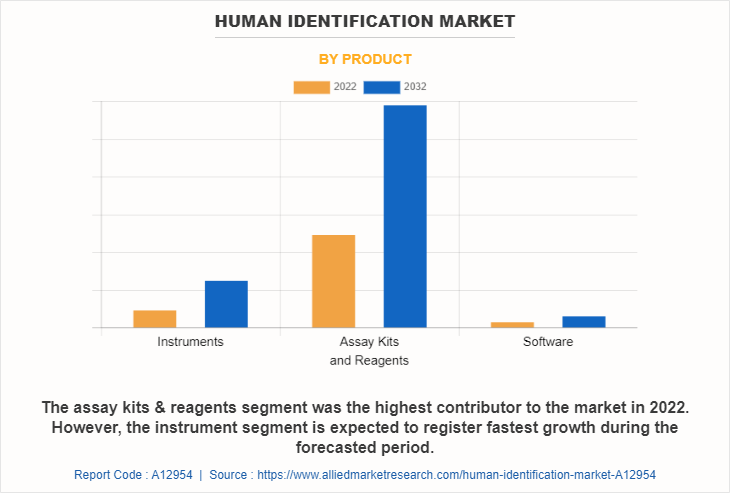
The human identification industry is categorized into instruments, assay kits and reagents, and software. The instrument segment is further classified into polymerase chain reaction instruments, capillary electrophoresis instruments, next-generation sequencing instruments, and others. The others include microarray, rapid DNA analysis, automated liquid handling, and nucleic acid isolation and purification instruments. The assay kits and reagents segment was the largest revenue contributor to the market in 2022 and is expected to remain dominant during the forecasted period, owing to wide applications of assay kits and reagents in forensic investigation and forensic research. 
Human Identification Market

By Technology: 

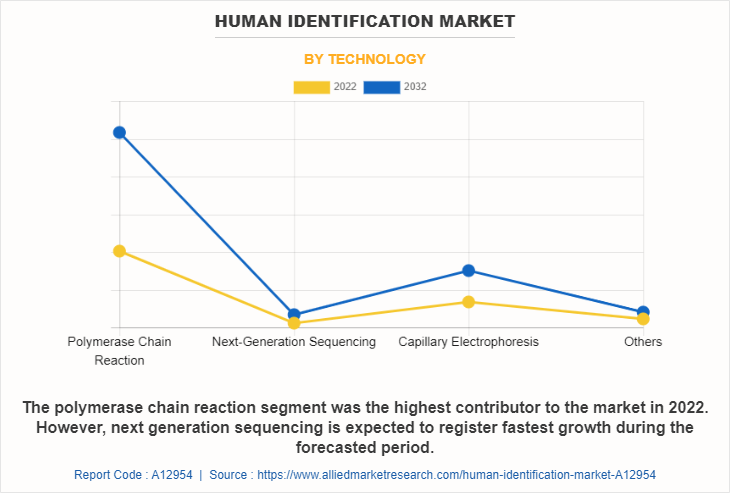
On the basis of technology, the market is categorized into polymerase chain reaction, next-generation sequencing, capillary electrophoresis, and others. The polymerase chain reaction segment dominated the market in 2022 and is expected to continue this trend during the forecast period. This is attributed to high sensitivity of PCR technology facilitating accurate analysis even with small fraction of DNA sample. 
Human Identification Market

By Application: 

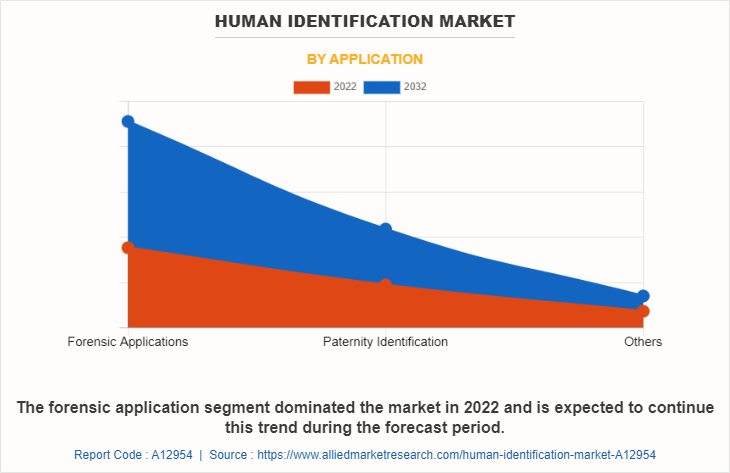
On the basis of applications, the market is categorized into forensic applications, paternity identification, and others. The other applications include population genetic, anthropology application, identification of crime related to human trafficking, and disaster victim identification the forensic applications segment dominated the market in 2022 and is expected to remain dominant during the forecasted period. This is attributed to rise in forensic investigation due to high crime rate.  
Human Identification Market

By End User: 

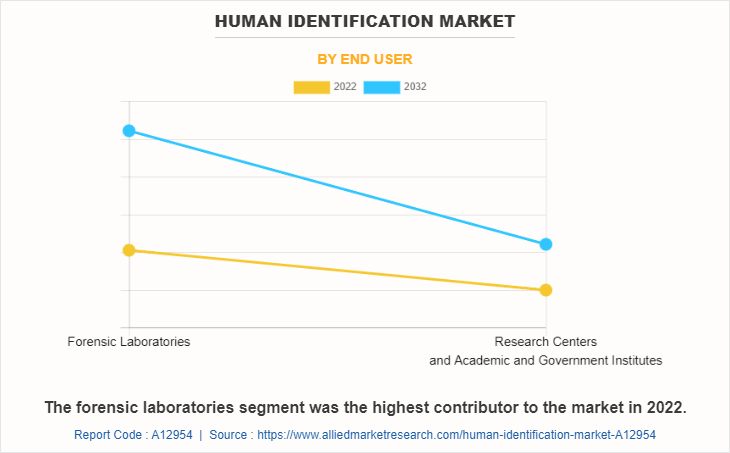
On the basis of end user, the market is categorized into forensic laboratories and research centers and academic and government institutes. The forensic laboratory segment has largest human identification market share in 2022 and is expected to remain dominant throughout the forecast period, owing to rise in the number of forensic laboratories and government funding’s to establish forensic laboratories. 
Human Identification Market

By Region:  

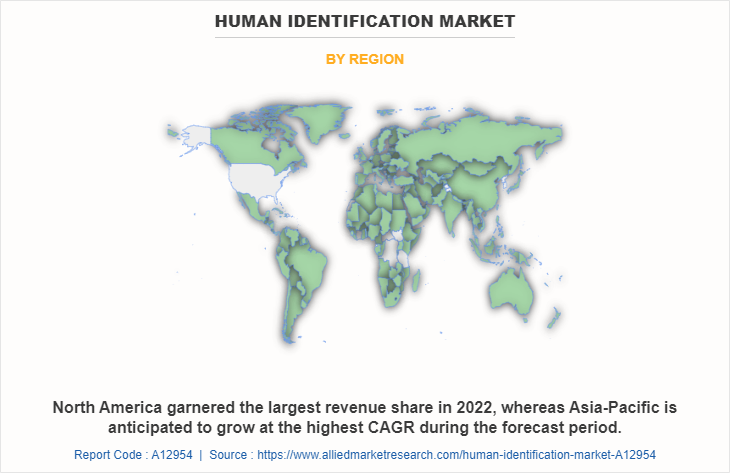
On the basis of region, the human identification market is analyzed across North America, Europe, Asia-Pacific, and LAMEA. On the basis of region, North America has the highest human identification market share in 2022, and is expected to maintain its lead during the forecast period, presence of major key players, rise of funds from government and private organization, growing support for the development of forensics, and advancements in technology for forensic science in the region. However, Asia-Pacific is expected to exhibit fastest growth during the forecast period, owing to increase in number of crime cases, rise in awareness about forensic technology, and increase in demand for DNA analysis. 
Human Identification Market

Competition Analysis 

Competitive analysis and profiles of the major players in the human identification market, such as Bio-Rad Laboratories, Inc., Hamilton Company, Promega Corporation, Qiagen N.V., Thermo Fisher Scientific Inc, Carolina Biological Supply Company, Genetek Biopharma GmbH, SecuriGene Technologies Inc, AutoGen INC, InnoGenomics Technologies. Major players have adopted agreement, partnership, and acquisition, and product approval as key developmental strategies to improve the product portfolio and gain strong foothold in the human identification market. 

Recent Agreement in the Human Identification Market  

  • In April 2021, AutoGen Inc. and Isohelix entered into a supply agreement. The new agreement sees Isohelix GeneFix Saliva DNA and RNA Collection Devices integrated into AutoGen FlexSTAR DNA extraction workflows. 

Recent Partnership in the Human Identification Market  

  • In June 2021, Qiagen N.V. announced a commercialization partnership with Verogen that is expected to provide customers of both companies with superior tools and comprehensive support for the human identification (HID) workflows in their laboratories. 

Recent Acquisition in the Human Identification Market  

  • In June 2023, Qiagen N.V. announced it has completed the acquisition of Verogen, a leader in the use of next-generation sequencing (NGS) technologies to drive the future of human identification (HID) and forensic investigation. 
  • In April 2022, Bio-Rad Laboratories, Inc. announced that it has reached an agreement to acquire all of the outstanding shares of Curiosity Diagnostics. Curiosity Diagnostics, a late-stage, pre-commercial platform company, is in the process of developing a sample-to-answer, rapid diagnostics PCR system for the molecular diagnostics market. 

Recent Product Approval in the Human Identification Market 

  • In June 2023, Qiagen announced that the U.S. Federal Bureau of Investigation (FBI) approved its ForenSeq MainstAY workflow. 

Key Benefits For Stakeholders

  • This report provides a quantitative analysis of the market segments, current trends, estimations, and dynamics of the human identification market analysis from 2022 to 2032 to identify the prevailing human identification market opportunity.
  • The market research is offered along with information related to key drivers, restraints, and opportunities.
  • Porter's five forces analysis highlights the potency of buyers and suppliers to enable stakeholders make profit-oriented business decisions and strengthen their supplier-buyer network.
  • In-depth analysis of the human identification market segmentation assists to determine the prevailing market opportunities.
  • Major countries in each region are mapped according to their revenue contribution to the global market.
  • Market player positioning facilitates benchmarking and provides a clear understanding of the present position of the market players.
  • The report includes the analysis of the regional as well as global human identification market trends, key players, market segments, application areas, and market growth strategies.

Human Identification Market Report Highlights

Aspects Details
Market Size By 2032 USD 3.7 billion
Growth Rate CAGR of 9.3%
Forecast period 2022 - 2032
Report Pages 350
By Product
  • Instruments
  • Assay Kits and Reagents
  • Software
By Technology
  • Polymerase Chain Reaction
  • Next-Generation Sequencing
  • Capillary Electrophoresis
  • Others
By Application
  • Forensic Applications
  • Paternity Identification
  • Others
By End User
  • Forensic Laboratories
  • Research Centers and Academic and Government Institutes
By Region
  • North America 
  • Europe 
  • Asia-Pacific 
  • LAMEA 
Key Market Players Qiagen N.V, Hamilton Company, AutoGen Inc., SecuriGene Technologies Inc., InnoGenomics Technologies, Carolina Biological Supply Company, Genetek Biopharma GmbH, Promega Corporation, Thermo Fisher Scientific Inc., Bio-Rad Laboratories, Inc. 

Analyst Review

Growth of the human identification market is attributed to factors such as rise in the number of criminal cases and human trafficking, increase in funds from private and government organizations for forensic research activities, and surge in demand for the advanced analytical system.
The human identification market gains interest from forensic laboratories and research centers, owing to surge in demand for polymerase chain reaction, next-generation sequencing, capillary electrophoresis, and DNA analysis for forensic investigation as well as research. This leads to increase in adoption of advanced technology by researchers to save time and cost for analysis of DNA. Moreover, the market has gained high traction due to the rise in government funds for research activities and initiative taken by government for forensic program. However, high costs associated with genomic instruments and lack of skilled professionals are anticipated to restrain the market growth during the forecast period.
Furthermore, North America witnessed highest growth in 2022, in terms of revenue, owing to presence of major key players, rise of funds from government and private organization, growing support for the development of forensics, and advancements in technology for forensic science in the region. 
However, Asia-Pacific is expected to exhibit the fastest growth during the forecast period, owing to increase in the number of crime cases, rise in awareness about forensic technology, surge in number of conferences and workshops, growth in demand for DNA analysis, and rise in the number of research centers.


  • CHAPTER 1: INTRODUCTION

    • 1.1. Report description

    • 1.2. Key market segments

    • 1.3. Key benefits to the stakeholders

    • 1.4. Research Methodology

      • 1.4.1. Primary research

      • 1.4.2. Secondary research

      • 1.4.3. Analyst tools and models

  • CHAPTER 2: EXECUTIVE SUMMARY

    • 2.1. CXO Perspective

  • CHAPTER 3: MARKET OVERVIEW

    • 3.1. Market definition and scope

    • 3.2. Key findings

      • 3.2.1. Top impacting factors

      • 3.2.2. Top investment pockets

    • 3.3. Porter’s five forces analysis

      • 3.3.1. Low bargaining power of suppliers

      • 3.3.2. Low threat of new entrants

      • 3.3.3. Low threat of substitutes

      • 3.3.4. Low intensity of rivalry

      • 3.3.5. Low bargaining power of buyers

    • 3.4. Market dynamics

      • 3.4.1. Drivers

        • 3.4.1.1. Advancement in technology in human identification systems.
        • 3.4.1.2. Favorable government initiatives and rise in funds for forensic program.
        • 3.4.1.3. Increase in demand for Next-generation sequencing (NGS)

      • 3.4.2. Restraints

        • 3.4.2.1. High cost of genomic instruments.
        • 3.4.2.2. Lack of skilled professional and trained personnel

      • 3.4.3. Opportunities

        • 3.4.3.1. Adoption of development strategies by key players.

    • 3.5. COVID-19 Impact Analysis on the market

  • CHAPTER 4: HUMAN IDENTIFICATION MARKET, BY PRODUCT

    • 4.1. Overview

      • 4.1.1. Market size and forecast

    • 4.2. Instruments

      • 4.2.1. Key market trends, growth factors and opportunities

      • 4.2.2. Market size and forecast, by region

      • 4.2.3. Market share analysis by country

      • 4.2.4. Instruments Human Identification Market by Type

        • 4.2.4.1. Polymerase Chain Reaction Instruments Market size and forecast, by region
        • 4.2.4.2. Capillary Electrophoresis Instruments Market size and forecast, by region
        • 4.2.4.3. Next-Generation Sequencing Instruments Market size and forecast, by region
        • 4.2.4.4. Others Market size and forecast, by region
    • 4.3. Assay Kits and Reagents

      • 4.3.1. Key market trends, growth factors and opportunities

      • 4.3.2. Market size and forecast, by region

      • 4.3.3. Market share analysis by country

    • 4.4. Software

      • 4.4.1. Key market trends, growth factors and opportunities

      • 4.4.2. Market size and forecast, by region

      • 4.4.3. Market share analysis by country

  • CHAPTER 5: HUMAN IDENTIFICATION MARKET, BY TECHNOLOGY

    • 5.1. Overview

      • 5.1.1. Market size and forecast

    • 5.2. Polymerase Chain Reaction

      • 5.2.1. Key market trends, growth factors and opportunities

      • 5.2.2. Market size and forecast, by region

      • 5.2.3. Market share analysis by country

    • 5.3. Next-Generation Sequencing

      • 5.3.1. Key market trends, growth factors and opportunities

      • 5.3.2. Market size and forecast, by region

      • 5.3.3. Market share analysis by country

    • 5.4. Capillary Electrophoresis

      • 5.4.1. Key market trends, growth factors and opportunities

      • 5.4.2. Market size and forecast, by region

      • 5.4.3. Market share analysis by country

    • 5.5. Others

      • 5.5.1. Key market trends, growth factors and opportunities

      • 5.5.2. Market size and forecast, by region

      • 5.5.3. Market share analysis by country

  • CHAPTER 6: HUMAN IDENTIFICATION MARKET, BY APPLICATION

    • 6.1. Overview

      • 6.1.1. Market size and forecast

    • 6.2. Forensic Applications

      • 6.2.1. Key market trends, growth factors and opportunities

      • 6.2.2. Market size and forecast, by region

      • 6.2.3. Market share analysis by country

    • 6.3. Paternity Identification

      • 6.3.1. Key market trends, growth factors and opportunities

      • 6.3.2. Market size and forecast, by region

      • 6.3.3. Market share analysis by country

    • 6.4. Others

      • 6.4.1. Key market trends, growth factors and opportunities

      • 6.4.2. Market size and forecast, by region

      • 6.4.3. Market share analysis by country

  • CHAPTER 7: HUMAN IDENTIFICATION MARKET, BY END USER

    • 7.1. Overview

      • 7.1.1. Market size and forecast

    • 7.2. Forensic Laboratories

      • 7.2.1. Key market trends, growth factors and opportunities

      • 7.2.2. Market size and forecast, by region

      • 7.2.3. Market share analysis by country

    • 7.3. Research Centers and Academic and Government Institutes

      • 7.3.1. Key market trends, growth factors and opportunities

      • 7.3.2. Market size and forecast, by region

      • 7.3.3. Market share analysis by country

  • CHAPTER 8: HUMAN IDENTIFICATION MARKET, BY REGION

    • 8.1. Overview

      • 8.1.1. Market size and forecast By Region

    • 8.2. North America

      • 8.2.1. Key trends and opportunities

      • 8.2.2. Market size and forecast, by Product

        • 8.2.2.1. North America Instruments Human Identification Market by Type
      • 8.2.3. Market size and forecast, by Technology

      • 8.2.4. Market size and forecast, by Application

      • 8.2.5. Market size and forecast, by End User

      • 8.2.6. Market size and forecast, by country

        • 8.2.6.1. U.S.
          • 8.2.6.1.1. Key market trends, growth factors and opportunities
          • 8.2.6.1.2. Market size and forecast, by Product
          • 8.2.6.1.3. Market size and forecast, by Technology
          • 8.2.6.1.4. Market size and forecast, by Application
          • 8.2.6.1.5. Market size and forecast, by End User
        • 8.2.6.2. Canada
          • 8.2.6.2.1. Key market trends, growth factors and opportunities
          • 8.2.6.2.2. Market size and forecast, by Product
          • 8.2.6.2.3. Market size and forecast, by Technology
          • 8.2.6.2.4. Market size and forecast, by Application
          • 8.2.6.2.5. Market size and forecast, by End User
        • 8.2.6.3. Mexico
          • 8.2.6.3.1. Key market trends, growth factors and opportunities
          • 8.2.6.3.2. Market size and forecast, by Product
          • 8.2.6.3.3. Market size and forecast, by Technology
          • 8.2.6.3.4. Market size and forecast, by Application
          • 8.2.6.3.5. Market size and forecast, by End User
    • 8.3. Europe

      • 8.3.1. Key trends and opportunities

      • 8.3.2. Market size and forecast, by Product

        • 8.3.2.1. Europe Instruments Human Identification Market by Type
      • 8.3.3. Market size and forecast, by Technology

      • 8.3.4. Market size and forecast, by Application

      • 8.3.5. Market size and forecast, by End User

      • 8.3.6. Market size and forecast, by country

        • 8.3.6.1. Germany
          • 8.3.6.1.1. Key market trends, growth factors and opportunities
          • 8.3.6.1.2. Market size and forecast, by Product
          • 8.3.6.1.3. Market size and forecast, by Technology
          • 8.3.6.1.4. Market size and forecast, by Application
          • 8.3.6.1.5. Market size and forecast, by End User
        • 8.3.6.2. France
          • 8.3.6.2.1. Key market trends, growth factors and opportunities
          • 8.3.6.2.2. Market size and forecast, by Product
          • 8.3.6.2.3. Market size and forecast, by Technology
          • 8.3.6.2.4. Market size and forecast, by Application
          • 8.3.6.2.5. Market size and forecast, by End User
        • 8.3.6.3. UK
          • 8.3.6.3.1. Key market trends, growth factors and opportunities
          • 8.3.6.3.2. Market size and forecast, by Product
          • 8.3.6.3.3. Market size and forecast, by Technology
          • 8.3.6.3.4. Market size and forecast, by Application
          • 8.3.6.3.5. Market size and forecast, by End User
        • 8.3.6.4. Italy
          • 8.3.6.4.1. Key market trends, growth factors and opportunities
          • 8.3.6.4.2. Market size and forecast, by Product
          • 8.3.6.4.3. Market size and forecast, by Technology
          • 8.3.6.4.4. Market size and forecast, by Application
          • 8.3.6.4.5. Market size and forecast, by End User
        • 8.3.6.5. Spain
          • 8.3.6.5.1. Key market trends, growth factors and opportunities
          • 8.3.6.5.2. Market size and forecast, by Product
          • 8.3.6.5.3. Market size and forecast, by Technology
          • 8.3.6.5.4. Market size and forecast, by Application
          • 8.3.6.5.5. Market size and forecast, by End User
        • 8.3.6.6. Russia
          • 8.3.6.6.1. Key market trends, growth factors and opportunities
          • 8.3.6.6.2. Market size and forecast, by Product
          • 8.3.6.6.3. Market size and forecast, by Technology
          • 8.3.6.6.4. Market size and forecast, by Application
          • 8.3.6.6.5. Market size and forecast, by End User
        • 8.3.6.7. Rest of Europe
          • 8.3.6.7.1. Key market trends, growth factors and opportunities
          • 8.3.6.7.2. Market size and forecast, by Product
          • 8.3.6.7.3. Market size and forecast, by Technology
          • 8.3.6.7.4. Market size and forecast, by Application
          • 8.3.6.7.5. Market size and forecast, by End User
    • 8.4. Asia-Pacific

      • 8.4.1. Key trends and opportunities

      • 8.4.2. Market size and forecast, by Product

        • 8.4.2.1. Asia-Pacific Instruments Human Identification Market by Type
      • 8.4.3. Market size and forecast, by Technology

      • 8.4.4. Market size and forecast, by Application

      • 8.4.5. Market size and forecast, by End User

      • 8.4.6. Market size and forecast, by country

        • 8.4.6.1. Japan
          • 8.4.6.1.1. Key market trends, growth factors and opportunities
          • 8.4.6.1.2. Market size and forecast, by Product
          • 8.4.6.1.3. Market size and forecast, by Technology
          • 8.4.6.1.4. Market size and forecast, by Application
          • 8.4.6.1.5. Market size and forecast, by End User
        • 8.4.6.2. China
          • 8.4.6.2.1. Key market trends, growth factors and opportunities
          • 8.4.6.2.2. Market size and forecast, by Product
          • 8.4.6.2.3. Market size and forecast, by Technology
          • 8.4.6.2.4. Market size and forecast, by Application
          • 8.4.6.2.5. Market size and forecast, by End User
        • 8.4.6.3. Australia
          • 8.4.6.3.1. Key market trends, growth factors and opportunities
          • 8.4.6.3.2. Market size and forecast, by Product
          • 8.4.6.3.3. Market size and forecast, by Technology
          • 8.4.6.3.4. Market size and forecast, by Application
          • 8.4.6.3.5. Market size and forecast, by End User
        • 8.4.6.4. India
          • 8.4.6.4.1. Key market trends, growth factors and opportunities
          • 8.4.6.4.2. Market size and forecast, by Product
          • 8.4.6.4.3. Market size and forecast, by Technology
          • 8.4.6.4.4. Market size and forecast, by Application
          • 8.4.6.4.5. Market size and forecast, by End User
        • 8.4.6.5. South Korea
          • 8.4.6.5.1. Key market trends, growth factors and opportunities
          • 8.4.6.5.2. Market size and forecast, by Product
          • 8.4.6.5.3. Market size and forecast, by Technology
          • 8.4.6.5.4. Market size and forecast, by Application
          • 8.4.6.5.5. Market size and forecast, by End User
        • 8.4.6.6. Thailand
          • 8.4.6.6.1. Key market trends, growth factors and opportunities
          • 8.4.6.6.2. Market size and forecast, by Product
          • 8.4.6.6.3. Market size and forecast, by Technology
          • 8.4.6.6.4. Market size and forecast, by Application
          • 8.4.6.6.5. Market size and forecast, by End User
        • 8.4.6.7. Malaysia
          • 8.4.6.7.1. Key market trends, growth factors and opportunities
          • 8.4.6.7.2. Market size and forecast, by Product
          • 8.4.6.7.3. Market size and forecast, by Technology
          • 8.4.6.7.4. Market size and forecast, by Application
          • 8.4.6.7.5. Market size and forecast, by End User
        • 8.4.6.8. Indonesia
          • 8.4.6.8.1. Key market trends, growth factors and opportunities
          • 8.4.6.8.2. Market size and forecast, by Product
          • 8.4.6.8.3. Market size and forecast, by Technology
          • 8.4.6.8.4. Market size and forecast, by Application
          • 8.4.6.8.5. Market size and forecast, by End User
        • 8.4.6.9. Rest of Asia-Pacific
          • 8.4.6.9.1. Key market trends, growth factors and opportunities
          • 8.4.6.9.2. Market size and forecast, by Product
          • 8.4.6.9.3. Market size and forecast, by Technology
          • 8.4.6.9.4. Market size and forecast, by Application
          • 8.4.6.9.5. Market size and forecast, by End User
    • 8.5. LAMEA

      • 8.5.1. Key trends and opportunities

      • 8.5.2. Market size and forecast, by Product

        • 8.5.2.1. LAMEA Instruments Human Identification Market by Type
      • 8.5.3. Market size and forecast, by Technology

      • 8.5.4. Market size and forecast, by Application

      • 8.5.5. Market size and forecast, by End User

      • 8.5.6. Market size and forecast, by country

        • 8.5.6.1. Brazil
          • 8.5.6.1.1. Key market trends, growth factors and opportunities
          • 8.5.6.1.2. Market size and forecast, by Product
          • 8.5.6.1.3. Market size and forecast, by Technology
          • 8.5.6.1.4. Market size and forecast, by Application
          • 8.5.6.1.5. Market size and forecast, by End User
        • 8.5.6.2. Saudi Arabia
          • 8.5.6.2.1. Key market trends, growth factors and opportunities
          • 8.5.6.2.2. Market size and forecast, by Product
          • 8.5.6.2.3. Market size and forecast, by Technology
          • 8.5.6.2.4. Market size and forecast, by Application
          • 8.5.6.2.5. Market size and forecast, by End User
        • 8.5.6.3. South Africa
          • 8.5.6.3.1. Key market trends, growth factors and opportunities
          • 8.5.6.3.2. Market size and forecast, by Product
          • 8.5.6.3.3. Market size and forecast, by Technology
          • 8.5.6.3.4. Market size and forecast, by Application
          • 8.5.6.3.5. Market size and forecast, by End User
        • 8.5.6.4. UAE
          • 8.5.6.4.1. Key market trends, growth factors and opportunities
          • 8.5.6.4.2. Market size and forecast, by Product
          • 8.5.6.4.3. Market size and forecast, by Technology
          • 8.5.6.4.4. Market size and forecast, by Application
          • 8.5.6.4.5. Market size and forecast, by End User
        • 8.5.6.5. Argentina
          • 8.5.6.5.1. Key market trends, growth factors and opportunities
          • 8.5.6.5.2. Market size and forecast, by Product
          • 8.5.6.5.3. Market size and forecast, by Technology
          • 8.5.6.5.4. Market size and forecast, by Application
          • 8.5.6.5.5. Market size and forecast, by End User
        • 8.5.6.6. Rest of LAMEA
          • 8.5.6.6.1. Key market trends, growth factors and opportunities
          • 8.5.6.6.2. Market size and forecast, by Product
          • 8.5.6.6.3. Market size and forecast, by Technology
          • 8.5.6.6.4. Market size and forecast, by Application
          • 8.5.6.6.5. Market size and forecast, by End User
  • CHAPTER 9: COMPETITIVE LANDSCAPE

    • 9.1. Introduction

    • 9.2. Top winning strategies

    • 9.3. Product Mapping of Top 10 Player

    • 9.4. Competitive Dashboard

    • 9.5. Competitive Heatmap

    • 9.6. Top player positioning, 2022

  • CHAPTER 10: COMPANY PROFILES

    • 10.1. AutoGen Inc.

      • 10.1.1. Company overview

      • 10.1.2. Key Executives

      • 10.1.3. Company snapshot

      • 10.1.4. Operating business segments

      • 10.1.5. Product portfolio

      • 10.1.6. Key strategic moves and developments

    • 10.2. Bio-Rad Laboratories, Inc. 

      • 10.2.1. Company overview

      • 10.2.2. Key Executives

      • 10.2.3. Company snapshot

      • 10.2.4. Operating business segments

      • 10.2.5. Product portfolio

      • 10.2.6. Business performance

      • 10.2.7. Key strategic moves and developments

    • 10.3. Carolina Biological Supply Company

      • 10.3.1. Company overview

      • 10.3.2. Key Executives

      • 10.3.3. Company snapshot

      • 10.3.4. Operating business segments

      • 10.3.5. Product portfolio

    • 10.4. Genetek Biopharma GmbH

      • 10.4.1. Company overview

      • 10.4.2. Key Executives

      • 10.4.3. Company snapshot

      • 10.4.4. Operating business segments

      • 10.4.5. Product portfolio

    • 10.5. Hamilton Company

      • 10.5.1. Company overview

      • 10.5.2. Key Executives

      • 10.5.3. Company snapshot

      • 10.5.4. Operating business segments

      • 10.5.5. Product portfolio

    • 10.6. Promega Corporation

      • 10.6.1. Company overview

      • 10.6.2. Key Executives

      • 10.6.3. Company snapshot

      • 10.6.4. Operating business segments

      • 10.6.5. Product portfolio

    • 10.7. Qiagen N.V

      • 10.7.1. Company overview

      • 10.7.2. Key Executives

      • 10.7.3. Company snapshot

      • 10.7.4. Operating business segments

      • 10.7.5. Product portfolio

      • 10.7.6. Business performance

      • 10.7.7. Key strategic moves and developments

    • 10.8. SecuriGene Technologies Inc.

      • 10.8.1. Company overview

      • 10.8.2. Key Executives

      • 10.8.3. Company snapshot

      • 10.8.4. Operating business segments

      • 10.8.5. Product portfolio

    • 10.9. Thermo Fisher Scientific Inc.

      • 10.9.1. Company overview

      • 10.9.2. Key Executives

      • 10.9.3. Company snapshot

      • 10.9.4. Operating business segments

      • 10.9.5. Product portfolio

      • 10.9.6. Business performance

    • 10.10. InnoGenomics Technologies

      • 10.10.1. Company overview

      • 10.10.2. Key Executives

      • 10.10.3. Company snapshot

      • 10.10.4. Operating business segments

      • 10.10.5. Product portfolio

      • 10.10.6. Key strategic moves and developments

  • LIST OF TABLES

  • TABLE 01. GLOBAL HUMAN IDENTIFICATION MARKET, BY PRODUCT, 2022-2032 ($MILLION)
    TABLE 02. HUMAN IDENTIFICATION MARKET FOR INSTRUMENTS, BY REGION, 2022-2032 ($MILLION)
    TABLE 03. GLOBAL INSTRUMENTS HUMAN IDENTIFICATION MARKET, BY TYPE, 2022-2032 ($MILLION)
    TABLE 04. HUMAN IDENTIFICATION MARKET FOR POLYMERASE CHAIN REACTION INSTRUMENTS, BY REGION, 2022-2032 ($MILLION)
    TABLE 05. HUMAN IDENTIFICATION MARKET FOR CAPILLARY ELECTROPHORESIS INSTRUMENTS, BY REGION, 2022-2032 ($MILLION)
    TABLE 06. HUMAN IDENTIFICATION MARKET FOR NEXT-GENERATION SEQUENCING INSTRUMENTS, BY REGION, 2022-2032 ($MILLION)
    TABLE 07. HUMAN IDENTIFICATION MARKET FOR OTHERS, BY REGION, 2022-2032 ($MILLION)
    TABLE 08. HUMAN IDENTIFICATION MARKET FOR ASSAY KITS AND REAGENTS, BY REGION, 2022-2032 ($MILLION)
    TABLE 09. HUMAN IDENTIFICATION MARKET FOR SOFTWARE, BY REGION, 2022-2032 ($MILLION)
    TABLE 10. GLOBAL HUMAN IDENTIFICATION MARKET, BY TECHNOLOGY, 2022-2032 ($MILLION)
    TABLE 11. HUMAN IDENTIFICATION MARKET FOR POLYMERASE CHAIN REACTION, BY REGION, 2022-2032 ($MILLION)
    TABLE 12. HUMAN IDENTIFICATION MARKET FOR NEXT-GENERATION SEQUENCING, BY REGION, 2022-2032 ($MILLION)
    TABLE 13. HUMAN IDENTIFICATION MARKET FOR CAPILLARY ELECTROPHORESIS, BY REGION, 2022-2032 ($MILLION)
    TABLE 14. HUMAN IDENTIFICATION MARKET FOR OTHERS, BY REGION, 2022-2032 ($MILLION)
    TABLE 15. GLOBAL HUMAN IDENTIFICATION MARKET, BY APPLICATION, 2022-2032 ($MILLION)
    TABLE 16. HUMAN IDENTIFICATION MARKET FOR FORENSIC APPLICATIONS, BY REGION, 2022-2032 ($MILLION)
    TABLE 17. HUMAN IDENTIFICATION MARKET FOR PATERNITY IDENTIFICATION, BY REGION, 2022-2032 ($MILLION)
    TABLE 18. HUMAN IDENTIFICATION MARKET FOR OTHERS, BY REGION, 2022-2032 ($MILLION)
    TABLE 19. GLOBAL HUMAN IDENTIFICATION MARKET, BY END USER, 2022-2032 ($MILLION)
    TABLE 20. HUMAN IDENTIFICATION MARKET FOR FORENSIC LABORATORIES, BY REGION, 2022-2032 ($MILLION)
    TABLE 21. HUMAN IDENTIFICATION MARKET FOR RESEARCH CENTERS AND ACADEMIC AND GOVERNMENT INSTITUTES, BY REGION, 2022-2032 ($MILLION)
    TABLE 22. HUMAN IDENTIFICATION MARKET, BY REGION, 2022-2032 ($MILLION)
    TABLE 23. NORTH AMERICA HUMAN IDENTIFICATION MARKET, BY PRODUCT, 2022-2032 ($MILLION)
    TABLE 24. NORTH AMERICA INSTRUMENTS HUMAN IDENTIFICATION MARKET, BY TYPE, 2022-2032 ($MILLION)
    TABLE 25. NORTH AMERICA HUMAN IDENTIFICATION MARKET, BY TECHNOLOGY, 2022-2032 ($MILLION)
    TABLE 26. NORTH AMERICA HUMAN IDENTIFICATION MARKET, BY APPLICATION, 2022-2032 ($MILLION)
    TABLE 27. NORTH AMERICA HUMAN IDENTIFICATION MARKET, BY END USER, 2022-2032 ($MILLION)
    TABLE 28. NORTH AMERICA HUMAN IDENTIFICATION MARKET, BY COUNTRY, 2022-2032 ($MILLION)
    TABLE 29. U.S. HUMAN IDENTIFICATION MARKET, BY PRODUCT, 2022-2032 ($MILLION)
    TABLE 30. U.S. HUMAN IDENTIFICATION MARKET, BY TECHNOLOGY, 2022-2032 ($MILLION)
    TABLE 31. U.S. HUMAN IDENTIFICATION MARKET, BY APPLICATION, 2022-2032 ($MILLION)
    TABLE 32. U.S. HUMAN IDENTIFICATION MARKET, BY END USER, 2022-2032 ($MILLION)
    TABLE 33. CANADA HUMAN IDENTIFICATION MARKET, BY PRODUCT, 2022-2032 ($MILLION)
    TABLE 34. CANADA HUMAN IDENTIFICATION MARKET, BY TECHNOLOGY, 2022-2032 ($MILLION)
    TABLE 35. CANADA HUMAN IDENTIFICATION MARKET, BY APPLICATION, 2022-2032 ($MILLION)
    TABLE 36. CANADA HUMAN IDENTIFICATION MARKET, BY END USER, 2022-2032 ($MILLION)
    TABLE 37. MEXICO HUMAN IDENTIFICATION MARKET, BY PRODUCT, 2022-2032 ($MILLION)
    TABLE 38. MEXICO HUMAN IDENTIFICATION MARKET, BY TECHNOLOGY, 2022-2032 ($MILLION)
    TABLE 39. MEXICO HUMAN IDENTIFICATION MARKET, BY APPLICATION, 2022-2032 ($MILLION)
    TABLE 40. MEXICO HUMAN IDENTIFICATION MARKET, BY END USER, 2022-2032 ($MILLION)
    TABLE 41. EUROPE HUMAN IDENTIFICATION MARKET, BY PRODUCT, 2022-2032 ($MILLION)
    TABLE 42. EUROPE INSTRUMENTS HUMAN IDENTIFICATION MARKET, BY TYPE, 2022-2032 ($MILLION)
    TABLE 43. EUROPE HUMAN IDENTIFICATION MARKET, BY TECHNOLOGY, 2022-2032 ($MILLION)
    TABLE 44. EUROPE HUMAN IDENTIFICATION MARKET, BY APPLICATION, 2022-2032 ($MILLION)
    TABLE 45. EUROPE HUMAN IDENTIFICATION MARKET, BY END USER, 2022-2032 ($MILLION)
    TABLE 46. EUROPE HUMAN IDENTIFICATION MARKET, BY COUNTRY, 2022-2032 ($MILLION)
    TABLE 47. GERMANY HUMAN IDENTIFICATION MARKET, BY PRODUCT, 2022-2032 ($MILLION)
    TABLE 48. GERMANY HUMAN IDENTIFICATION MARKET, BY TECHNOLOGY, 2022-2032 ($MILLION)
    TABLE 49. GERMANY HUMAN IDENTIFICATION MARKET, BY APPLICATION, 2022-2032 ($MILLION)
    TABLE 50. GERMANY HUMAN IDENTIFICATION MARKET, BY END USER, 2022-2032 ($MILLION)
    TABLE 51. FRANCE HUMAN IDENTIFICATION MARKET, BY PRODUCT, 2022-2032 ($MILLION)
    TABLE 52. FRANCE HUMAN IDENTIFICATION MARKET, BY TECHNOLOGY, 2022-2032 ($MILLION)
    TABLE 53. FRANCE HUMAN IDENTIFICATION MARKET, BY APPLICATION, 2022-2032 ($MILLION)
    TABLE 54. FRANCE HUMAN IDENTIFICATION MARKET, BY END USER, 2022-2032 ($MILLION)
    TABLE 55. UK HUMAN IDENTIFICATION MARKET, BY PRODUCT, 2022-2032 ($MILLION)
    TABLE 56. UK HUMAN IDENTIFICATION MARKET, BY TECHNOLOGY, 2022-2032 ($MILLION)
    TABLE 57. UK HUMAN IDENTIFICATION MARKET, BY APPLICATION, 2022-2032 ($MILLION)
    TABLE 58. UK HUMAN IDENTIFICATION MARKET, BY END USER, 2022-2032 ($MILLION)
    TABLE 59. ITALY HUMAN IDENTIFICATION MARKET, BY PRODUCT, 2022-2032 ($MILLION)
    TABLE 60. ITALY HUMAN IDENTIFICATION MARKET, BY TECHNOLOGY, 2022-2032 ($MILLION)
    TABLE 61. ITALY HUMAN IDENTIFICATION MARKET, BY APPLICATION, 2022-2032 ($MILLION)
    TABLE 62. ITALY HUMAN IDENTIFICATION MARKET, BY END USER, 2022-2032 ($MILLION)
    TABLE 63. SPAIN HUMAN IDENTIFICATION MARKET, BY PRODUCT, 2022-2032 ($MILLION)
    TABLE 64. SPAIN HUMAN IDENTIFICATION MARKET, BY TECHNOLOGY, 2022-2032 ($MILLION)
    TABLE 65. SPAIN HUMAN IDENTIFICATION MARKET, BY APPLICATION, 2022-2032 ($MILLION)
    TABLE 66. SPAIN HUMAN IDENTIFICATION MARKET, BY END USER, 2022-2032 ($MILLION)
    TABLE 67. RUSSIA HUMAN IDENTIFICATION MARKET, BY PRODUCT, 2022-2032 ($MILLION)
    TABLE 68. RUSSIA HUMAN IDENTIFICATION MARKET, BY TECHNOLOGY, 2022-2032 ($MILLION)
    TABLE 69. RUSSIA HUMAN IDENTIFICATION MARKET, BY APPLICATION, 2022-2032 ($MILLION)
    TABLE 70. RUSSIA HUMAN IDENTIFICATION MARKET, BY END USER, 2022-2032 ($MILLION)
    TABLE 71. REST OF EUROPE HUMAN IDENTIFICATION MARKET, BY PRODUCT, 2022-2032 ($MILLION)
    TABLE 72. REST OF EUROPE HUMAN IDENTIFICATION MARKET, BY TECHNOLOGY, 2022-2032 ($MILLION)
    TABLE 73. REST OF EUROPE HUMAN IDENTIFICATION MARKET, BY APPLICATION, 2022-2032 ($MILLION)
    TABLE 74. REST OF EUROPE HUMAN IDENTIFICATION MARKET, BY END USER, 2022-2032 ($MILLION)
    TABLE 75. ASIA-PACIFIC HUMAN IDENTIFICATION MARKET, BY PRODUCT, 2022-2032 ($MILLION)
    TABLE 76. ASIA-PACIFIC INSTRUMENTS HUMAN IDENTIFICATION MARKET, BY TYPE, 2022-2032 ($MILLION)
    TABLE 77. ASIA-PACIFIC HUMAN IDENTIFICATION MARKET, BY TECHNOLOGY, 2022-2032 ($MILLION)
    TABLE 78. ASIA-PACIFIC HUMAN IDENTIFICATION MARKET, BY APPLICATION, 2022-2032 ($MILLION)
    TABLE 79. ASIA-PACIFIC HUMAN IDENTIFICATION MARKET, BY END USER, 2022-2032 ($MILLION)
    TABLE 80. ASIA-PACIFIC HUMAN IDENTIFICATION MARKET, BY COUNTRY, 2022-2032 ($MILLION)
    TABLE 81. JAPAN HUMAN IDENTIFICATION MARKET, BY PRODUCT, 2022-2032 ($MILLION)
    TABLE 82. JAPAN HUMAN IDENTIFICATION MARKET, BY TECHNOLOGY, 2022-2032 ($MILLION)
    TABLE 83. JAPAN HUMAN IDENTIFICATION MARKET, BY APPLICATION, 2022-2032 ($MILLION)
    TABLE 84. JAPAN HUMAN IDENTIFICATION MARKET, BY END USER, 2022-2032 ($MILLION)
    TABLE 85. CHINA HUMAN IDENTIFICATION MARKET, BY PRODUCT, 2022-2032 ($MILLION)
    TABLE 86. CHINA HUMAN IDENTIFICATION MARKET, BY TECHNOLOGY, 2022-2032 ($MILLION)
    TABLE 87. CHINA HUMAN IDENTIFICATION MARKET, BY APPLICATION, 2022-2032 ($MILLION)
    TABLE 88. CHINA HUMAN IDENTIFICATION MARKET, BY END USER, 2022-2032 ($MILLION)
    TABLE 89. AUSTRALIA HUMAN IDENTIFICATION MARKET, BY PRODUCT, 2022-2032 ($MILLION)
    TABLE 90. AUSTRALIA HUMAN IDENTIFICATION MARKET, BY TECHNOLOGY, 2022-2032 ($MILLION)
    TABLE 91. AUSTRALIA HUMAN IDENTIFICATION MARKET, BY APPLICATION, 2022-2032 ($MILLION)
    TABLE 92. AUSTRALIA HUMAN IDENTIFICATION MARKET, BY END USER, 2022-2032 ($MILLION)
    TABLE 93. INDIA HUMAN IDENTIFICATION MARKET, BY PRODUCT, 2022-2032 ($MILLION)
    TABLE 94. INDIA HUMAN IDENTIFICATION MARKET, BY TECHNOLOGY, 2022-2032 ($MILLION)
    TABLE 95. INDIA HUMAN IDENTIFICATION MARKET, BY APPLICATION, 2022-2032 ($MILLION)
    TABLE 96. INDIA HUMAN IDENTIFICATION MARKET, BY END USER, 2022-2032 ($MILLION)
    TABLE 97. SOUTH KOREA HUMAN IDENTIFICATION MARKET, BY PRODUCT, 2022-2032 ($MILLION)
    TABLE 98. SOUTH KOREA HUMAN IDENTIFICATION MARKET, BY TECHNOLOGY, 2022-2032 ($MILLION)
    TABLE 99. SOUTH KOREA HUMAN IDENTIFICATION MARKET, BY APPLICATION, 2022-2032 ($MILLION)
    TABLE 100. SOUTH KOREA HUMAN IDENTIFICATION MARKET, BY END USER, 2022-2032 ($MILLION)
    TABLE 101. THAILAND HUMAN IDENTIFICATION MARKET, BY PRODUCT, 2022-2032 ($MILLION)
    TABLE 102. THAILAND HUMAN IDENTIFICATION MARKET, BY TECHNOLOGY, 2022-2032 ($MILLION)
    TABLE 103. THAILAND HUMAN IDENTIFICATION MARKET, BY APPLICATION, 2022-2032 ($MILLION)
    TABLE 104. THAILAND HUMAN IDENTIFICATION MARKET, BY END USER, 2022-2032 ($MILLION)
    TABLE 105. MALAYSIA HUMAN IDENTIFICATION MARKET, BY PRODUCT, 2022-2032 ($MILLION)
    TABLE 106. MALAYSIA HUMAN IDENTIFICATION MARKET, BY TECHNOLOGY, 2022-2032 ($MILLION)
    TABLE 107. MALAYSIA HUMAN IDENTIFICATION MARKET, BY APPLICATION, 2022-2032 ($MILLION)
    TABLE 108. MALAYSIA HUMAN IDENTIFICATION MARKET, BY END USER, 2022-2032 ($MILLION)
    TABLE 109. INDONESIA HUMAN IDENTIFICATION MARKET, BY PRODUCT, 2022-2032 ($MILLION)
    TABLE 110. INDONESIA HUMAN IDENTIFICATION MARKET, BY TECHNOLOGY, 2022-2032 ($MILLION)
    TABLE 111. INDONESIA HUMAN IDENTIFICATION MARKET, BY APPLICATION, 2022-2032 ($MILLION)
    TABLE 112. INDONESIA HUMAN IDENTIFICATION MARKET, BY END USER, 2022-2032 ($MILLION)
    TABLE 113. REST OF ASIA-PACIFIC HUMAN IDENTIFICATION MARKET, BY PRODUCT, 2022-2032 ($MILLION)
    TABLE 114. REST OF ASIA-PACIFIC HUMAN IDENTIFICATION MARKET, BY TECHNOLOGY, 2022-2032 ($MILLION)
    TABLE 115. REST OF ASIA-PACIFIC HUMAN IDENTIFICATION MARKET, BY APPLICATION, 2022-2032 ($MILLION)
    TABLE 116. REST OF ASIA-PACIFIC HUMAN IDENTIFICATION MARKET, BY END USER, 2022-2032 ($MILLION)
    TABLE 117. LAMEA HUMAN IDENTIFICATION MARKET, BY PRODUCT, 2022-2032 ($MILLION)
    TABLE 118. LAMEA INSTRUMENTS HUMAN IDENTIFICATION MARKET, BY TYPE, 2022-2032 ($MILLION)
    TABLE 119. LAMEA HUMAN IDENTIFICATION MARKET, BY TECHNOLOGY, 2022-2032 ($MILLION)
    TABLE 120. LAMEA HUMAN IDENTIFICATION MARKET, BY APPLICATION, 2022-2032 ($MILLION)
    TABLE 121. LAMEA HUMAN IDENTIFICATION MARKET, BY END USER, 2022-2032 ($MILLION)
    TABLE 122. LAMEA HUMAN IDENTIFICATION MARKET, BY COUNTRY, 2022-2032 ($MILLION)
    TABLE 123. BRAZIL HUMAN IDENTIFICATION MARKET, BY PRODUCT, 2022-2032 ($MILLION)
    TABLE 124. BRAZIL HUMAN IDENTIFICATION MARKET, BY TECHNOLOGY, 2022-2032 ($MILLION)
    TABLE 125. BRAZIL HUMAN IDENTIFICATION MARKET, BY APPLICATION, 2022-2032 ($MILLION)
    TABLE 126. BRAZIL HUMAN IDENTIFICATION MARKET, BY END USER, 2022-2032 ($MILLION)
    TABLE 127. SAUDI ARABIA HUMAN IDENTIFICATION MARKET, BY PRODUCT, 2022-2032 ($MILLION)
    TABLE 128. SAUDI ARABIA HUMAN IDENTIFICATION MARKET, BY TECHNOLOGY, 2022-2032 ($MILLION)
    TABLE 129. SAUDI ARABIA HUMAN IDENTIFICATION MARKET, BY APPLICATION, 2022-2032 ($MILLION)
    TABLE 130. SAUDI ARABIA HUMAN IDENTIFICATION MARKET, BY END USER, 2022-2032 ($MILLION)
    TABLE 131. SOUTH AFRICA HUMAN IDENTIFICATION MARKET, BY PRODUCT, 2022-2032 ($MILLION)
    TABLE 132. SOUTH AFRICA HUMAN IDENTIFICATION MARKET, BY TECHNOLOGY, 2022-2032 ($MILLION)
    TABLE 133. SOUTH AFRICA HUMAN IDENTIFICATION MARKET, BY APPLICATION, 2022-2032 ($MILLION)
    TABLE 134. SOUTH AFRICA HUMAN IDENTIFICATION MARKET, BY END USER, 2022-2032 ($MILLION)
    TABLE 135. UAE HUMAN IDENTIFICATION MARKET, BY PRODUCT, 2022-2032 ($MILLION)
    TABLE 136. UAE HUMAN IDENTIFICATION MARKET, BY TECHNOLOGY, 2022-2032 ($MILLION)
    TABLE 137. UAE HUMAN IDENTIFICATION MARKET, BY APPLICATION, 2022-2032 ($MILLION)
    TABLE 138. UAE HUMAN IDENTIFICATION MARKET, BY END USER, 2022-2032 ($MILLION)
    TABLE 139. ARGENTINA HUMAN IDENTIFICATION MARKET, BY PRODUCT, 2022-2032 ($MILLION)
    TABLE 140. ARGENTINA HUMAN IDENTIFICATION MARKET, BY TECHNOLOGY, 2022-2032 ($MILLION)
    TABLE 141. ARGENTINA HUMAN IDENTIFICATION MARKET, BY APPLICATION, 2022-2032 ($MILLION)
    TABLE 142. ARGENTINA HUMAN IDENTIFICATION MARKET, BY END USER, 2022-2032 ($MILLION)
    TABLE 143. REST OF LAMEA HUMAN IDENTIFICATION MARKET, BY PRODUCT, 2022-2032 ($MILLION)
    TABLE 144. REST OF LAMEA HUMAN IDENTIFICATION MARKET, BY TECHNOLOGY, 2022-2032 ($MILLION)
    TABLE 145. REST OF LAMEA HUMAN IDENTIFICATION MARKET, BY APPLICATION, 2022-2032 ($MILLION)
    TABLE 146. REST OF LAMEA HUMAN IDENTIFICATION MARKET, BY END USER, 2022-2032 ($MILLION)
    TABLE 147. AUTOGEN INC.: KEY EXECUTIVES
    TABLE 148. AUTOGEN INC.: COMPANY SNAPSHOT
    TABLE 149. AUTOGEN INC.: PRODUCT SEGMENTS
    TABLE 150. AUTOGEN INC.: SERVICE SEGMENTS
    TABLE 151. AUTOGEN INC.: PRODUCT PORTFOLIO
    TABLE 152. AUTOGEN INC.: KEY STRATERGIES
    TABLE 153. BIO-RAD LABORATORIES, INC. : KEY EXECUTIVES
    TABLE 154. BIO-RAD LABORATORIES, INC. : COMPANY SNAPSHOT
    TABLE 155. BIO-RAD LABORATORIES, INC. : PRODUCT SEGMENTS
    TABLE 156. BIO-RAD LABORATORIES, INC. : PRODUCT PORTFOLIO
    TABLE 157. BIO-RAD LABORATORIES, INC. : KEY STRATERGIES
    TABLE 158. CAROLINA BIOLOGICAL SUPPLY COMPANY: KEY EXECUTIVES
    TABLE 159. CAROLINA BIOLOGICAL SUPPLY COMPANY: COMPANY SNAPSHOT
    TABLE 160. CAROLINA BIOLOGICAL SUPPLY COMPANY: PRODUCT SEGMENTS
    TABLE 161. CAROLINA BIOLOGICAL SUPPLY COMPANY: PRODUCT PORTFOLIO
    TABLE 162. GENETEK BIOPHARMA GMBH: KEY EXECUTIVES
    TABLE 163. GENETEK BIOPHARMA GMBH: COMPANY SNAPSHOT
    TABLE 164. GENETEK BIOPHARMA GMBH: PRODUCT SEGMENTS
    TABLE 165. GENETEK BIOPHARMA GMBH: PRODUCT PORTFOLIO
    TABLE 166. HAMILTON COMPANY: KEY EXECUTIVES
    TABLE 167. HAMILTON COMPANY: COMPANY SNAPSHOT
    TABLE 168. HAMILTON COMPANY: PRODUCT SEGMENTS
    TABLE 169. HAMILTON COMPANY: PRODUCT PORTFOLIO
    TABLE 170. PROMEGA CORPORATION: KEY EXECUTIVES
    TABLE 171. PROMEGA CORPORATION: COMPANY SNAPSHOT
    TABLE 172. PROMEGA CORPORATION: PRODUCT SEGMENTS
    TABLE 173. PROMEGA CORPORATION: PRODUCT PORTFOLIO
    TABLE 174. QIAGEN N.V: KEY EXECUTIVES
    TABLE 175. QIAGEN N.V: COMPANY SNAPSHOT
    TABLE 176. QIAGEN N.V: PRODUCT SEGMENTS
    TABLE 177. QIAGEN N.V: PRODUCT PORTFOLIO
    TABLE 178. QIAGEN N.V: KEY STRATERGIES
    TABLE 179. SECURIGENE TECHNOLOGIES INC.: KEY EXECUTIVES
    TABLE 180. SECURIGENE TECHNOLOGIES INC.: COMPANY SNAPSHOT
    TABLE 181. SECURIGENE TECHNOLOGIES INC.: PRODUCT SEGMENTS
    TABLE 182. SECURIGENE TECHNOLOGIES INC.: PRODUCT PORTFOLIO
    TABLE 183. THERMO FISHER SCIENTIFIC INC.: KEY EXECUTIVES
    TABLE 184. THERMO FISHER SCIENTIFIC INC.: COMPANY SNAPSHOT
    TABLE 185. THERMO FISHER SCIENTIFIC INC.: PRODUCT SEGMENTS
    TABLE 186. THERMO FISHER SCIENTIFIC INC.: PRODUCT PORTFOLIO
    TABLE 187. INNOGENOMICS TECHNOLOGIES: KEY EXECUTIVES
    TABLE 188. INNOGENOMICS TECHNOLOGIES: COMPANY SNAPSHOT
    TABLE 189. INNOGENOMICS TECHNOLOGIES: PRODUCT SEGMENTS
    TABLE 190. INNOGENOMICS TECHNOLOGIES: SERVICE SEGMENTS
    TABLE 191. INNOGENOMICS TECHNOLOGIES: PRODUCT PORTFOLIO
    TABLE 192. INNOGENOMICS TECHNOLOGIES: KEY STRATERGIES
  • LIST OF FIGURES

  • FIGURE 01. HUMAN IDENTIFICATION MARKET, 2022-2032
    FIGURE 02. SEGMENTATION OF HUMAN IDENTIFICATION MARKET, 2022-2032
    FIGURE 03. HUMAN IDENTIFICATION MARKET,2022-2032
    FIGURE 04. TOP INVESTMENT POCKETS IN HUMAN IDENTIFICATION MARKET (2023-2032)
    FIGURE 05. LOW BARGAINING POWER OF SUPPLIERS
    FIGURE 06. LOW THREAT OF NEW ENTRANTS
    FIGURE 07. LOW THREAT OF SUBSTITUTES
    FIGURE 08. LOW INTENSITY OF RIVALRY
    FIGURE 09. LOW BARGAINING POWER OF BUYERS
    FIGURE 10. GLOBAL HUMAN IDENTIFICATION MARKET:DRIVERS, RESTRAINTS AND OPPORTUNITIES
    FIGURE 11. HUMAN IDENTIFICATION MARKET, BY PRODUCT, 2022(%)
    FIGURE 12. COMPARATIVE SHARE ANALYSIS OF HUMAN IDENTIFICATION MARKET FOR INSTRUMENTS, BY COUNTRY 2022-2032(%)
    FIGURE 13. COMPARATIVE SHARE ANALYSIS OF HUMAN IDENTIFICATION MARKET FOR ASSAY KITS AND REAGENTS, BY COUNTRY 2022-2032(%)
    FIGURE 14. COMPARATIVE SHARE ANALYSIS OF HUMAN IDENTIFICATION MARKET FOR SOFTWARE, BY COUNTRY 2022-2032(%)
    FIGURE 15. HUMAN IDENTIFICATION MARKET, BY TECHNOLOGY, 2022(%)
    FIGURE 16. COMPARATIVE SHARE ANALYSIS OF HUMAN IDENTIFICATION MARKET FOR POLYMERASE CHAIN REACTION, BY COUNTRY 2022-2032(%)
    FIGURE 17. COMPARATIVE SHARE ANALYSIS OF HUMAN IDENTIFICATION MARKET FOR NEXT-GENERATION SEQUENCING, BY COUNTRY 2022-2032(%)
    FIGURE 18. COMPARATIVE SHARE ANALYSIS OF HUMAN IDENTIFICATION MARKET FOR CAPILLARY ELECTROPHORESIS, BY COUNTRY 2022-2032(%)
    FIGURE 19. COMPARATIVE SHARE ANALYSIS OF HUMAN IDENTIFICATION MARKET FOR OTHERS, BY COUNTRY 2022-2032(%)
    FIGURE 20. HUMAN IDENTIFICATION MARKET, BY APPLICATION, 2022(%)
    FIGURE 21. COMPARATIVE SHARE ANALYSIS OF HUMAN IDENTIFICATION MARKET FOR FORENSIC APPLICATIONS, BY COUNTRY 2022-2032(%)
    FIGURE 22. COMPARATIVE SHARE ANALYSIS OF HUMAN IDENTIFICATION MARKET FOR PATERNITY IDENTIFICATION, BY COUNTRY 2022-2032(%)
    FIGURE 23. COMPARATIVE SHARE ANALYSIS OF HUMAN IDENTIFICATION MARKET FOR OTHERS, BY COUNTRY 2022-2032(%)
    FIGURE 24. HUMAN IDENTIFICATION MARKET, BY END USER, 2022(%)
    FIGURE 25. COMPARATIVE SHARE ANALYSIS OF HUMAN IDENTIFICATION MARKET FOR FORENSIC LABORATORIES, BY COUNTRY 2022-2032(%)
    FIGURE 26. COMPARATIVE SHARE ANALYSIS OF HUMAN IDENTIFICATION MARKET FOR RESEARCH CENTERS AND ACADEMIC AND GOVERNMENT INSTITUTES, BY COUNTRY 2022-2032(%)
    FIGURE 27. HUMAN IDENTIFICATION MARKET BY REGION, 2022
    FIGURE 28. U.S. HUMAN IDENTIFICATION MARKET, 2022-2032 ($MILLION)
    FIGURE 29. CANADA HUMAN IDENTIFICATION MARKET, 2022-2032 ($MILLION)
    FIGURE 30. MEXICO HUMAN IDENTIFICATION MARKET, 2022-2032 ($MILLION)
    FIGURE 31. GERMANY HUMAN IDENTIFICATION MARKET, 2022-2032 ($MILLION)
    FIGURE 32. FRANCE HUMAN IDENTIFICATION MARKET, 2022-2032 ($MILLION)
    FIGURE 33. UK HUMAN IDENTIFICATION MARKET, 2022-2032 ($MILLION)
    FIGURE 34. ITALY HUMAN IDENTIFICATION MARKET, 2022-2032 ($MILLION)
    FIGURE 35. SPAIN HUMAN IDENTIFICATION MARKET, 2022-2032 ($MILLION)
    FIGURE 36. RUSSIA HUMAN IDENTIFICATION MARKET, 2022-2032 ($MILLION)
    FIGURE 37. REST OF EUROPE HUMAN IDENTIFICATION MARKET, 2022-2032 ($MILLION)
    FIGURE 38. JAPAN HUMAN IDENTIFICATION MARKET, 2022-2032 ($MILLION)
    FIGURE 39. CHINA HUMAN IDENTIFICATION MARKET, 2022-2032 ($MILLION)
    FIGURE 40. AUSTRALIA HUMAN IDENTIFICATION MARKET, 2022-2032 ($MILLION)
    FIGURE 41. INDIA HUMAN IDENTIFICATION MARKET, 2022-2032 ($MILLION)
    FIGURE 42. SOUTH KOREA HUMAN IDENTIFICATION MARKET, 2022-2032 ($MILLION)
    FIGURE 43. THAILAND HUMAN IDENTIFICATION MARKET, 2022-2032 ($MILLION)
    FIGURE 44. MALAYSIA HUMAN IDENTIFICATION MARKET, 2022-2032 ($MILLION)
    FIGURE 45. INDONESIA HUMAN IDENTIFICATION MARKET, 2022-2032 ($MILLION)
    FIGURE 46. REST OF ASIA-PACIFIC HUMAN IDENTIFICATION MARKET, 2022-2032 ($MILLION)
    FIGURE 47. BRAZIL HUMAN IDENTIFICATION MARKET, 2022-2032 ($MILLION)
    FIGURE 48. SAUDI ARABIA HUMAN IDENTIFICATION MARKET, 2022-2032 ($MILLION)
    FIGURE 49. SOUTH AFRICA HUMAN IDENTIFICATION MARKET, 2022-2032 ($MILLION)
    FIGURE 50. UAE HUMAN IDENTIFICATION MARKET, 2022-2032 ($MILLION)
    FIGURE 51. ARGENTINA HUMAN IDENTIFICATION MARKET, 2022-2032 ($MILLION)
    FIGURE 52. REST OF LAMEA HUMAN IDENTIFICATION MARKET, 2022-2032 ($MILLION)
    FIGURE 53. TOP WINNING STRATEGIES, BY YEAR
    FIGURE 54. TOP WINNING STRATEGIES, BY DEVELOPMENT
    FIGURE 55. TOP WINNING STRATEGIES, BY COMPANY
    FIGURE 56. PRODUCT MAPPING OF TOP 10 PLAYERS
    FIGURE 57. COMPETITIVE DASHBOARD
    FIGURE 58. COMPETITIVE HEATMAP: HUMAN IDENTIFICATION MARKET
    FIGURE 59. TOP PLAYER POSITIONING, 2022
    FIGURE 60. BIO-RAD LABORATORIES, INC. : NET SALES, 2020-2022 ($MILLION)
    FIGURE 61. BIO-RAD LABORATORIES, INC. : REVENUE SHARE BY SEGMENT, 2022 (%)
    FIGURE 62. BIO-RAD LABORATORIES, INC. : REVENUE SHARE BY REGION, 2022 (%)
    FIGURE 63. QIAGEN N.V: NET REVENUE, 2020-2022 ($MILLION)
    FIGURE 64. QIAGEN N.V: REVENUE SHARE BY REGION, 2022 (%)
    FIGURE 65. THERMO FISHER SCIENTIFIC INC.: NET REVENUE, 2020-2022 ($MILLION)
    FIGURE 66. THERMO FISHER SCIENTIFIC INC.: REVENUE SHARE BY SEGMENT, 2022 (%)
    FIGURE 67. THERMO FISHER SCIENTIFIC INC.: REVENUE SHARE BY REGION, 2021 (%)


PURCHASE OPTIONS

Call or Email us

U.S.-Canada Toll-free: +1-800-792-5285
Int'l : +1-503-894-6022
Europe : +44-845-528-1300
Email : help@alliedmarketresearch.com
 
FREQUENTLY ASKED QUESTIONS?

A. North America is the largest regional market for human identification owing to rise in number of crime and strong presence of key players.

A. The forcast period for human identification market is 2023 to 2032

A. The base year is 2022 in human identification market.

A. The estimated industry size of human identification in 2032 is $3,705.38 million.

A. Top companies such as QIAGEN, Thermo Fisher Scientific, Promega Corporation, and Bio-Rad Laboratories held high market share in 2022.

A. Rise in use of human identification techniques for criminal identification, rise in government initiative and funds for forensic laboratories, rise in the number of instances of identity theft and fraud are the factors responsible for the market growth.

A. The polymerase chain reaction segment is the most influencing segment owing to high accuracy offered by PCR segment and large number of PCR-based products offered by key players.

A. Asia-Pacific is expected to experience the growth rate of 11.1% during the forecast period, owing to rise in government funding’s to establish forensic centers and increased interest of youth towards forensic education.

Looking for Customization?

 Customization Request

Have a Question?

 Speak with Analyst

Any Confusion?

 Inquire Before Buying

Have a glance of the Report

  Request Sample
RELATED TAGS

Purchase Full Report of
Human Identification Market

Start reading instantly.
This Report and over 66,782+ more Reports, Available with Avenue Library. T&C*.

  • Online Only
  • $3,570
  • Online cloud access only
  • Restricted print, copy, paste & download
  • Read only
  • Free industry update
    (Within 180 days)
  • Free report update in next update cycle
    (Aug 2024 - Aug 2025)
  • Data Pack
  • $3,840
  • Restricted to one authorized user
  • One print only
  • Available in
    Excel
  • Free industry update
    (Within 180 days)
  •   Free report update in next update cycle
    (Aug 2024 - Aug 2025)
  • Single User
  • $5,730
  • Restricted to one authorized user
  • One print only
  • Available in
    PDF
  • Free industry update
    (Within 180 days)
  •   Free report update in next update cycle
    (Aug 2024 - Aug 2025)
  • Five Users
  • $6,450
  • Limited to five authorized users
  • Print upto five copies
  • Available in
    PDF
  • Free industry update
    (Within 180 days)
  •   Free report update in next update cycle
    (Aug 2024 - Aug 2025)
  • Enterprise
    License/PDF

  • $9,600
  • Unlimited
    within
    company/enterprise
  • Available in Excel & PDF
  • Free industry update
    (Within 180 days)
  •   Free report update in next update cycle
    (Aug 2024 - Aug 2025)
  • Library
    Membership

  • $999 $ 1,175
    Per User/ Per month/ Billed annually
  • Published Content
    E-access
  • Company Profiles
    E-access
  • Newly Added Content Access
  • 10 PDF
    Downloads
  • 5 Excel Data
    Pack Downloads
  • 250 Company Profiles PDF Downloads
  • Buy Now

*Taxes/Fees, if applicable will be added during checkout. All prices in USD

RELATED REPORTS
 

Why Allied Market Research?


Infallible Methodology

To ensure high-level data integrity, accurate analysis, and impeccable forecasts

Analyst Support

For complete satisfaction

Customization

On-demand customization of scope of the report to exactly meet your needs

TARGETED MARKET VIEW

Targeted market view to provide pertinent information and save time of readers

Get fresh content delivered

Get insights on topics that are crucial for your business. Stay abreast of your interest areas.

Get Industry Data Alerts

Why Allied Market Research?

Infallible Methodology

To ensure high-level data integrity, accurate analysis, and impeccable forecasts

Analyst Support

For complete satisfaction

Customization

On-demand customization of scope of the report to exactly meet your needs

TARGETED MARKET VIEW

Targeted market view to provide pertinent information and save time of readers