Report Code: A12027 | Jul 2021 | Pages: 259 | ||
Tables: 130 | Charts: 64 |
|
Pandemic disrupted the entire world and affected many industries.
Get detailed COVID-19 impact analysis on the Human Milk Oligosaccharides (hmo) Market
Request Now !
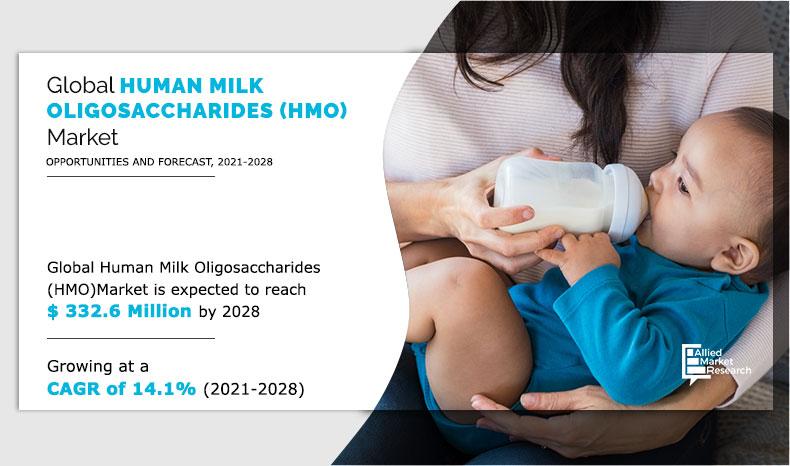
The global human milk oligosaccharides (HMO) marketsize was valued at $125.9 million in 2020, and is estimated to reach $332.6 million by 2028, registering a CAGR of 14.1% from 2021 to 2028.
Human milk oligosaccharide (HMO) is a class of structurally complex, unconjugated glycans found in high concentrations in human milk. HMOs are minimally digested in the gastrointestinal system and reach the colon intact, where they shape the micro biota.
As HMOs are beneficial for immunity, several new techniques are being developed by key players in the Human Milk Oligosaccharides (HMO) market, such as isolating HMO from cow milk, employing costly techniques (chemically or enzymatically synthesizing), or utilizing microbes to produce them. Human Milk Oligosaccharides (HMO) market products are expensive, as a large amount of human milk is synthesized to produce a small amount of HMO. As a result, techniques for synthesis and extraction are improving with continuous research and development activities.
The functional benefits of these products have created a huge demand for biosynthetic production of HMOs for use as additives in infant formulas and other dietary products. HMO molecules can be produced chemically, through fermentation, or through enzymatic synthesis.
Moreover, surge in demand for HMOs has increased the utilization of various nutritional products used as food or dietary supplements. One of the major factors and Human Milk Oligosaccharides (HMO) market trends that boosts the Human Milk Oligosaccharides (HMO) market growth is the availability of new technologies such as enzymatic trans-glycosylation, which is used for artificially synthesizing the HMOs.
The Human Milk Oligosaccharides(HMO) market is expected to witness significant revenue generation during the forecast period, owing to increase in application scope in functional food & beverages and infant formula, rapid technological advancement in the product line, rise in health awareness, and rapid development of the dairy industry.
HMOs are important components of human milk that are available in a variety of concentrations and compositions. They are novel ingredients that require regulatory approval. In the U.S., HMOs are intended for use in food, as compared to dietary supplements, which are governed by Generally Recognized as Safe (GRAS). DuPont's CARE4U was GRAS-approved for use in infant formula and toddler foods in the U.S. With upsurge in demand for HMOs, two HMOs have undergone the novel food safety assessment in Europe, resulting in a positive evaluation outcome and approval by the European Commission.
HMOs have been used in infant formula and human milk for a prolonged period. The compositions, however, differ, and HMOs are not found in other foods. The path to Human Milk Oligosaccharides (HMO) market for new and novel HMOs as a dietary supplement is to have GRAS self-affirmed for use in food and sub sequently use it in the same form as a dietary supplement. 2'-O-fucosyllactose, 2'-fucosyllactose, and lacto-N-neotetraose have all received such notices.
Other major factors driving the demand for HMOs around the world include improvement in lifestyleand rise in concerns about health & wellness. Furthermore, HMOs in food supplements and functional food and beverage products can aid in the treatment of specific disorders and high-risk health conditions, which is acts as a key driving force of the global Human Milk Oligosaccharides (HMO) market. This has created Human Milk Oligosaccharides (HMO) market opportunity. However, high costs associated with the product is expected to pose a challenge for the growth of the market during Human Milk Oligosaccharides (HMO) market forecast.
HMOs are intrinsic components that can be used to manipulate the gut microbiota by providing an energy source for beneficial intestinal microbiota and potentially acting as decoy molecules to inactivate pathogens on mucosal surfaces, resulting in improved host health. Health-promoting oligosaccharides are in high demand, as the importance of the gut microbiota in human health has been revealed. The rules governing the implementation of HMOs differ depending on where a person lives. Different countries have different regulations governing novel foods and foods with health claims. The major regulatory requirements in the EU and the U.S. are similar, but the approval processes differ.
The COVID-19 pandemic had a significant impact on the Human Milk Oligosaccharides (HMO) market. The demand for HMO increased during the lockdown due to panic buying for at-home consumption during the initial phase of the pandemic. As a result, the sales of HMOs escalated during the pandemic, due to the fact that it serves as an immunity booster.
The global Human Milk Oligosaccharides (HMO) market segmentation is done on the basis of type, application, distribution channel, and region. Depending on type, the market is categorized into 2’FL, 3’FL, 3’SL, and 6’SL.The applications covered in the market include infant formula, functional food & beverage, and food supplements. According to distribution channel, the market is fragmented into hypermarkets & supermarkets, drug store or pharmacy, mass merchandiser, departmental stores, mono-brand stores, specialty stores, and online sales channel. Region wise, it is analyzed across North America, Europe, Asia-Pacific, and LAMEA. In this way, Human Milk Oligosaccharides (HMO) market analysis is done.
By type, the 2’FLsegment garnered the highest market share in 2020, as 2'-fucosyllactose (2’FL) is well-known for its ability to protect against infectious diseases by preventing toxins and pathogens from adhering to epithelial cells. On the basis of application, the infant formula segment is anticipated to dominate the Human Milk Oligosaccharides (HMO) market share during the forecast period. This is attributed to beneficial properties offered by HMOs such as brain development and memory enhancement of infants.
Depending on distribution channel, the drug store or pharmacy segment led the Human Milk Oligosaccharides (HMO) market in 2020. This is attributed to the fact that to attract and retain customers during the growing competition from mail-order retailers and supercenters, drug store operators have emphasized convenience factors such as extended store hours and drive-through locations. Region wise, Europe is expected to dominate the Human Milk Oligosaccharides (HMO) market, owing to increase in customer awareness in Europe about the health benefits of HMO in infant nutrition.
The prominent players operating in the Human Milk Oligosaccharides (HMO ) industry include Abbott Laboratories, BASF S.E., Biosynth Carbosynth, Chr. Hansen Holding A/S, Dextra Laboratories Ltd., Dupont Nutrition & Biosciences, Elicityl S.A., Glycom A/S, Glycosyn, Inbiose NV, Medolac Laboratories, Neolacta Lifesciences Pvt. Ltd, Nestle Health Science, Royal DSM, and ZuChem.
Key Benefits For Stakeholders
Key Market Segments
By Type
By Application
By Distribution Channel
By Region
Human Milk Oligosaccharides (HMO) Market Report Highlights
Aspects | Details |
---|---|
By Type |
|
By Application |
|
By Distribution Channel |
|
By Region |
|
Key Market Players | Biosynth Carbosynth, Inbiose NV, ROYAL DSM, Chr. Hansen Holding A/S, Medolac Laboratories, Elicityl S.A., DuPont Nutrition & Biosciences, Nestle Health Science, Glycosyn, Dextra Laboratories Ltd |
CHAPTER 1:INTRODUCTION
1.1.Report description
1.2.Key benefits for stakeholders
1.3.Key market segments
1.4.Research methodology
1.4.1.Secondary research
1.4.2.Primary research
1.4.3.Analyst tools and models
CHAPTER 2:EXECUTIVE SUMMARY
2.1.Snapshot
2.2.Key findings
2.2.1.Top investment pocket
2.3.CXO perspective
CHAPTER 3:MARKET OVERVIEW
3.1.Market definition and scope
3.2.Key forces shaping global human milk oligosaccharides industry/market
3.2.1.Bargaining power of suppliers
3.2.2.Bargaining power of buyers
3.2.3.Threat of new entrants
3.2.4.Threat of substitutes
3.2.5.Intensity of competitive rivalry
3.3.Market dynamics
3.3.1.Drivers
3.3.1.1.Growing acceptance of HMO
3.3.1.2.Increase in demand of HMOs as functional food products
3.3.1.3.Shift towards healthy dietary habits
3.3.2.Restraints
3.3.2.1.High cost of production
3.3.2.2.Health related problems
3.3.3.Opportunities
3.3.3.1.Surge in demand for infant nutrition products
3.3.3.2.Rise in Research & Development (R&D) activities
3.3.4.Impact of COVID-19
3.3.5.Key regulations
CHAPTER 4:GLOBAL HUMAN MILK OLIGOSACCHARIDES MARKET, BY TYPE
4.1.Overview
4.1.1.Market size and forecast
4.2.2’FL
4.2.1.Key market trends, growth factors, and opportunities
4.2.2.Market size and forecast
4.2.3.Market analysis, by country
4.3.3’FL
4.3.1.Key market trends, growth factors, and opportunities
4.3.2.Market size and forecast
4.3.3.Market analysis, by country
4.4.3’SL
4.4.1.Key market trends, growth factors, and opportunities
4.4.2.Market size and forecast
4.4.3.Market analysis, by country
4.5.6’SL
4.5.1.Key market trends, growth factors, and opportunities
4.5.2.Market size and forecast
4.5.3.Market analysis, by country
CHAPTER 5:GLOBAL HUMAN MILK OLIGOSACCHARIDES MARKET, BY APPLICATION
5.1.Overview
5.1.1.Market size and forecast
5.2.Infant formula
5.2.1.Key market trends, growth factors, and opportunities
5.2.2.Market size and forecast
5.2.3.Market analysis, by country
5.3.Functional food & beverage
5.3.1.Key market trends, growth factors, and opportunities
5.3.2.Market size and forecast
5.3.3.Market analysis, by country
5.4.Food supplements
5.4.1.Key market trends, growth factors, and opportunities
5.4.2.Market size and forecast
5.4.3.Market analysis, by country
CHAPTER 6:GLOBAL HUMAN MILK OLIGOSACCHARIDES MARKET, BY DISTRIBUTION CHANNEL
6.1.Overview
6.1.1.Market size and forecast
6.2.Hypermarkets & Supermarkets
6.2.1.Key market trends, growth factors, and opportunities
6.2.2.Market size and forecast
6.2.3.Market analysis, by country
6.3.Drug store or pharmacy
6.3.1.Key market trends, growth factors, and opportunities
6.3.2.Market size and forecast
6.3.3.Market analysis, by country
6.4.Mass merchandiser
6.4.1.Key market trends, growth factors, and opportunities
6.4.2.Market size and forecast
6.4.3.Market analysis, by country
6.5.Departmental stores
6.5.1.Key market trends, growth factors, and opportunities
6.5.2.Market size and forecast
6.5.3.Market analysis, by country
6.6.Mono-brand store
6.6.1.Key market trends, growth factors, and opportunities
6.6.2.Market size and forecast
6.6.3.Market analysis, by country
6.7.Specialty stores
6.7.1.Key market trends, growth factors, and opportunities
6.7.2.Market size and forecast
6.7.3.Market analysis, by country
6.8.Online Sales Channel
6.8.1.Key market trends, growth factors, and opportunities
6.8.2.Market size and forecast
6.8.3.Market analysis, by country
CHAPTER 7:HUMAN MILK OLIGOSACCHARIDES MARKET, BY REGION
7.1.Overview
7.1.1.Market size and forecast
7.2.North America
7.2.1.Key market trends, growth factors, and opportunities
7.2.2.Market size and forecast, by Type
7.2.3.Market size and forecast, by Application
7.2.4.Market size and forecast, by distribution channel
7.2.5.Market size and forecast, by Country
7.2.6.U.S.
7.2.6.1.Market size and forecast, By type
7.2.6.2.Market size and forecast, by application
7.2.6.3.Market size and forecast, by distribution channel
7.2.7.CANADA
7.2.7.1.Market size and forecast, By type
7.2.7.2.Market size and forecast, by application
7.2.7.3.Market size and forecast, by distribution channel
7.2.8.MEXICO
7.2.8.1.Market size and forecast, By type
7.2.8.2.Market size and forecast, by application
7.2.8.3.Market size and forecast, by distribution channel
7.3.Europe
7.3.1.Key market trends, growth factors, and opportunities
7.3.2.Market size and forecast, by Type
7.3.3.Market size and forecast, by Application
7.3.4.Market size and forecast, by distribution channel
7.3.5.Market size and forecast, by Country
7.3.6.UK
7.3.6.1.Market size and forecast, By type
7.3.6.2.Market size and forecast, by application
7.3.6.3.Market size and forecast, by distribution channel
7.3.7.FRANCE
7.3.7.1.Market size and forecast, By type
7.3.7.2.Market size and forecast, by application
7.3.7.3.Market size and forecast, by distribution channel
7.3.8.NETHERLANDS
7.3.8.1.Market size and forecast, By type
7.3.8.2.Market size and forecast, by application
7.3.8.3.Market size and forecast, by distribution channel
7.3.9.GERMANY
7.3.9.1.Market size and forecast, By type
7.3.9.2.Market size and forecast, by application
7.3.9.3.Market size and forecast, by distribution channel
7.3.10.TURKEY
7.3.10.1.Market size and forecast, By type
7.3.10.2.Market size and forecast, by application
7.3.10.3.Market size and forecast, by distribution channel
7.3.11.REST OF EUROPE
7.3.11.1.Market size and forecast, By type
7.3.11.2.Market size and forecast, by application
7.3.11.3.Market size and forecast, by distribution channel
7.4.Asia-Pacific
7.4.1.Key market trends, growth factors, and opportunities
7.4.2.Market size and forecast, by Type
7.4.3.Market size and forecast, by Application
7.4.4.Market size and forecast, by distribution channel
7.4.5.Market size and forecast, by Country
7.4.6.CHINA
7.4.6.1.Market size and forecast, By type
7.4.6.2.Market size and forecast, by application
7.4.6.3.Market size and forecast, by distribution channel
7.4.7.JAPAN
7.4.7.1.Market size and forecast, By type
7.4.7.2.Market size and forecast, by application
7.4.7.3.Market size and forecast, by distribution channel
7.4.8.INDIA
7.4.8.1.Market size and forecast, By type
7.4.8.2.Market size and forecast, by application
7.4.8.3.Market size and forecast, by distribution channel
7.4.9.SOUTH KOREA
7.4.9.1.Market size and forecast, By type
7.4.9.2.Market size and forecast, by application
7.4.9.3.Market size and forecast, by distribution channel
7.4.10.AUSTRALIA
7.4.10.1.Market size and forecast, By type
7.4.10.2.Market size and forecast, by application
7.4.10.3.Market size and forecast, by distribution channel
7.4.11.REST OF ASIA-PACIFIC
7.4.11.1.Market size and forecast, By type
7.4.11.2.Market size and forecast, by application
7.4.11.3.Market size and forecast, by distribution channel
7.5.LAMEA
7.5.1.Key market trends, growth factors, and opportunities
7.5.2.Market size and forecast, by Type
7.5.3.Market size and forecast, by Application
7.5.4.Market size and forecast, by distribution channel
7.5.5.Market size and forecast, by Country
7.5.6.BRAZIL
7.5.6.1.Market size and forecast, By type
7.5.6.2.Market size and forecast, by application
7.5.6.3.Market size and forecast, by distribution channel
7.5.7.SOUTH AFRICA
7.5.7.1.Market size and forecast, By type
7.5.7.2.Market size and forecast, by application
7.5.7.3.Market size and forecast, by distribution channel
7.5.8.UNITED ARAB EMIRATES
7.5.8.1.Market size and forecast, By type
7.5.8.2.Market size and forecast, by application
7.5.8.3.Market size and forecast, by distribution channel
7.5.9.REST OF LAMEA
7.5.9.1.Market size and forecast, By type
7.5.9.2.Market size and forecast, by application
7.5.9.3.Market size and forecast, by distribution channel
CHAPTER 8:COMPETITION LANDSCAPE
8.1.Top winning strategies
8.2.Product mapping
8.3.Competitive dashboard
8.4.Competitive heat map
8.5.Key developments
8.5.1.Acquisition
8.5.2.Business Expansion
8.5.3.Product Launch
CHAPTER 9:COMPANY PROFILES
9.1.Biosynth Carbosynth
9.1.1.Company overview
9.1.2.Key Executives
9.1.3.Company snapshot
9.1.4.Product portfolio
9.2.Chr. Hansen Holding A/S
9.2.1.Company overview
9.2.2.Key Executives
9.2.3.Company snapshot
9.2.4.Operating business segments
9.2.5.Product portfolio
9.2.6.R&D Expenditure
9.2.7.Business performance
9.2.8.Key strategic moves and developments
9.3.Dextra Laboratories Ltd
9.3.1.Company overview
9.3.2.Key Executives
9.3.3.Company snapshot
9.3.4.Product portfolio
9.4.DuPont Nutrition & Biosciences
9.4.1.Company overview
9.4.2.Key Executives
9.4.3.Company snapshot
9.4.4.Product portfolio
9.4.5.Key strategic moves and developments
9.5.Elicityl S.A.
9.5.1.Company overview
9.5.2.Key Executives
9.5.3.Company snapshot
9.5.4.Product portfolio
9.6.Glycosyn
9.6.1.Company overview
9.6.2.Key Executives
9.6.3.Company snapshot
9.6.4.Product portfolio
9.6.5.Key strategic moves and developments
9.7.Inbiose NV
9.7.1.Company overview
9.7.2.Key Executives
9.7.3.Company snapshot
9.7.4.Product portfolio
9.8.Medolac Laboratories
9.8.1.Company overview
9.8.2.Key Executives
9.8.3.Company snapshot
9.8.4.Product portfolio
9.9.Nestle Health Science
9.9.1.Company overview
9.9.2.Key Executives
9.9.3.Company snapshot
9.9.4.Operating business segments
9.9.5.Product portfolio
9.9.6.R&D Expenditure
9.9.7.Business performance
9.10.ROYAL DSM
9.10.1.Company overview
9.10.2.Key Executives
9.10.3.Company snapshot
9.10.4.Operating business segments
9.10.5.Product portfolio
9.10.6.R&D Expenditure
9.10.7.Business performance
9.10.8.Key strategic moves and developments
LIST OF TABLES
TABLE 01.GLOBAL HUMAN MILK OLIGOSACCHARIDES, MARKET BY TYPE, 2020–2028 ($MILLION)
TABLE 02.2’FL HUMAN MILK OLIGOSACCHARIDES MARKET, BY REGION, 2020–2028 ($MILLION)
TABLE 03.3’FL HUMAN MILK OLIGOSACCHARIDES MARKET, BY REGION, 2020–2028 ($MILLION)
TABLE 04.3’SL HUMAN MILK OLIGOSACCHARIDES MARKET, BY REGION, 2020–2028 ($MILLION)
TABLE 05.6’SL HUMAN MILK OLIGOSACCHARIDES MARKET, BY REGION, 2020–2028 ($MILLION)
TABLE 06.GLOBAL HUMAN MILK OLIGOSACCHARIDES MARKET, BY APPLICATION, 2020–2028 ($MILLION)
TABLE 07.HUMAN MILK OLIGOSACCHARIDES MARKET FOR INFANT FORMULA, BY REGION, 2020–2028 ($MILLION)
TABLE 08.HUMAN MILK OLIGOSACCHARIDES MARKET FOR FUNCTIONAL FOOD & BEVERAGE, BY REGION, 2020–2028 ($MILLION)
TABLE 09.HUMAN MILK OLIGOSACCHARIDES MARKET FOR FOOD SUPPLEMENTS, BY REGION, 2020–2028 ($MILLION)
TABLE 10.GLOBAL HUMAN MILK OLIGOSACCHARIDES MARKET, BY DISTRIBUTION CHANNEL, 2020–2028 ($MILLION)
TABLE 11.HUMAN MILK OLIGOSACCHARIDES MARKET FOR HYPERMARKETS & SUPERMARKETS, BY REGION, 2020–2028 ($MILLION)
TABLE 12.HUMAN MILK OLIGOSACCHARIDES MARKET FOR DRUG STORE OR PHARMACY, BY REGION, 2020–2028 ($MILLION)
TABLE 13.HUMAN MILK OLIGOSACCHARIDES MARKET FOR MASS MERCHANDISER, BY REGION, 2020–2028 ($MILLION)
TABLE 14.HUMAN MILK OLIGOSACCHARIDES MARKET FOR DEPARTMENTAL STORES, BY REGION, 2020–2028 ($MILLION)
TABLE 15.HUMAN MILK OLIGOSACCHARIDES MARKET FOR MONO-BRAND STORE, BY REGION, 2020–2028 ($MILLION)
TABLE 16.HUMAN MILK OLIGOSACCHARIDES MARKET FOR SPECIALTY STORES, BY REGION, 2020–2028 ($MILLION)
TABLE 17.HUMAN MILK OLIGOSACCHARIDES MARKET FOR ONLINE SALES CHANNEL, BY REGION, 2020–2028 ($MILLION)
TABLE 18.GLOBAL HUMAN MILK OLIGOSACCHARIDES MARKET, BY REGION, 2020–2028 ($MILLION)
TABLE 19.NORTH AMERICA HUMAN MILK OLIGOSACCHARIDES MARKET, BY TYPE, 2020–2028 ($MILLION)
TABLE 20.NORTH AMERICA HUMAN MILK OLIGOSACCHARIDES MARKET, BY APPLICATION, 2020–2028 ($MILLION)
TABLE 21.NORTH AMERICA HUMAN MILK OLIGOSACCHARIDES MARKET, BY DISTRIBUTION CHANNEL, 2020–2028 ($MILLION)
TABLE 22.NORTH AMERICA HUMAN MILK OLIGOSACCHARIDES MARKET, BY COUNTRY, 2020–2028 ($MILLION)
TABLE 23.U.S. HUMAN MILK OLIGOSACCHARIDES MARKET, BY TYPE, 2020–2028 ($MILLION)
TABLE 24.U.S. HUMAN MILK OLIGOSACCHARIDES MARKET, BY APPLICATION, 2020–2028 ($MILLION)
TABLE 25.U.S. HUMAN MILK OLIGOSACCHARIDES MARKET, BY DISTRIBUTION CHANNEL, 2020–2028 ($MILLION)
TABLE 26.CANADA HUMAN MILK OLIGOSACCHARIDES MARKET, BY TYPE, 2020–2028 ($MILLION)
TABLE 27.CANADA HUMAN MILK OLIGOSACCHARIDES MARKET, BY APPLICATION, 2020–2028 ($MILLION)
TABLE 28.CANADA HUMAN MILK OLIGOSACCHARIDES MARKET, BY DISTRIBUTION CHANNEL, 2020–2028 ($MILLION)
TABLE 29.MEXICO HUMAN MILK OLIGOSACCHARIDES MARKET, BY TYPE, 2020–2028 ($MILLION)
TABLE 30.MEXICO HUMAN MILK OLIGOSACCHARIDES MARKET, BY APPLICATION, 2020–2028 ($MILLION)
TABLE 31.MEXICO HUMAN MILK OLIGOSACCHARIDES MARKET, BY DISTRIBUTION CHANNEL, 2020–2028 ($MILLION)
TABLE 32.EUROPE HUMAN MILK OLIGOSACCHARIDES MARKET, BY TYPE, 2020–2028 ($MILLION)
TABLE 33.EUROPE HUMAN MILK OLIGOSACCHARIDES MARKET, BY APPLICATION, 2020–2028 ($MILLION)
TABLE 34.EUROPE HUMAN MILK OLIGOSACCHARIDES MARKET, BY DISTRIBUTION CHANNEL, 2020–2028 ($MILLION)
TABLE 35.EUROPE HUMAN MILK OLIGOSACCHARIDES MARKET, BY COUNTRY, 2020–2028 ($MILLION)
TABLE 36.UK HUMAN MILK OLIGOSACCHARIDES MARKET, BY TYPE, 2020–2028 ($MILLION)
TABLE 37.UK HUMAN MILK OLIGOSACCHARIDES MARKET, BY APPLICATION, 2020–2028 ($MILLION)
TABLE 38.UK HUMAN MILK OLIGOSACCHARIDES MARKET, BY DISTRIBUTION CHANNEL, 2020–2028 ($MILLION)
TABLE 39.FRANCE HUMAN MILK OLIGOSACCHARIDES MARKET, BY TYPE, 2020–2028 ($MILLION)
TABLE 40.FRANCE HUMAN MILK OLIGOSACCHARIDES MARKET, BY APPLICATION, 2020–2028 ($MILLION)
TABLE 41.FRANCE HUMAN MILK OLIGOSACCHARIDES MARKET, BY DISTRIBUTION CHANNEL, 2020–2028 ($MILLION)
TABLE 42.NETHERLANDS HUMAN MILK OLIGOSACCHARIDES MARKET, BY TYPE, 2020–2028 ($MILLION)
TABLE 43.NETHERLANDS HUMAN MILK OLIGOSACCHARIDES MARKET, BY APPLICATION, 2020–2028 ($MILLION)
TABLE 44.NETHERLANDS HUMAN MILK OLIGOSACCHARIDES MARKET, BY DISTRIBUTION CHANNEL, 2020–2028 ($MILLION)
TABLE 45.GERMANY HUMAN MILK OLIGOSACCHARIDES MARKET, BY TYPE, 2020–2028 ($MILLION)
TABLE 46.GERMANY HUMAN MILK OLIGOSACCHARIDES MARKET, BY APPLICATION, 2020–2028 ($MILLION)
TABLE 47.GERMANY HUMAN MILK OLIGOSACCHARIDES MARKET, BY DISTRIBUTION CHANNEL, 2020–2028 ($MILLION)
TABLE 48.TURKEY HUMAN MILK OLIGOSACCHARIDES MARKET, BY TYPE, 2020–2028 ($MILLION)
TABLE 49.TURKEY HUMAN MILK OLIGOSACCHARIDES MARKET, BY APPLICATION, 2020–2028 ($MILLION)
TABLE 50.TURKEY HUMAN MILK OLIGOSACCHARIDES MARKET, BY DISTRIBUTION CHANNEL, 2020–2028 ($MILLION)
TABLE 51.REST OF EUROPE HUMAN MILK OLIGOSACCHARIDES MARKET, BY TYPE, 2020–2028 ($MILLION)
TABLE 52.REST OF EUROPE HUMAN MILK OLIGOSACCHARIDES MARKET, BY APPLICATION, 2020–2028 ($MILLION)
TABLE 53.REST OF EUROPE HUMAN MILK OLIGOSACCHARIDES MARKET, BY DISTRIBUTION CHANNEL, 2020–2028 ($MILLION)
TABLE 54.ASIA-PACIFIC HUMAN MILK OLIGOSACCHARIDES MARKET, BY TYPE, 2020–2028 ($MILLION)
TABLE 55.ASIA-PACIFIC HUMAN MILK OLIGOSACCHARIDES MARKET, BY APPLICATION, 2020–2028 ($MILLION)
TABLE 56.ASIA-PACIFIC HUMAN MILK OLIGOSACCHARIDES MARKET, BY DISTRIBUTION CHANNEL, 2020–2028 ($MILLION)
TABLE 57.ASIA-PACIFIC HUMAN MILK OLIGOSACCHARIDES MARKET, BY COUNTRY, 2020–2028 ($MILLION)
TABLE 58.CHINA HUMAN MILK OLIGOSACCHARIDES MARKET, BY TYPE, 2020–2028 ($MILLION)
TABLE 59.CHINA HUMAN MILK OLIGOSACCHARIDES MARKET, BY APPLICATION, 2020–2028 ($MILLION)
TABLE 60.CHINA HUMAN MILK OLIGOSACCHARIDES MARKET, BY DISTRIBUTION CHANNEL, 2020–2028 ($MILLION)
TABLE 61.JAPAN HUMAN MILK OLIGOSACCHARIDES MARKET, BY TYPE, 2020–2028 ($MILLION)
TABLE 62.JAPAN HUMAN MILK OLIGOSACCHARIDES MARKET, BY APPLICATION, 2020–2028 ($MILLION)
TABLE 63.JAPAN HUMAN MILK OLIGOSACCHARIDES MARKET, BY DISTRIBUTION CHANNEL, 2020–2028 ($MILLION)
TABLE 64.INDIA HUMAN MILK OLIGOSACCHARIDES MARKET, BY TYPE, 2020–2028 ($MILLION)
TABLE 65.INDIA HUMAN MILK OLIGOSACCHARIDES MARKET, BY APPLICATION, 2020–2028 ($MILLION)
TABLE 66.INDIA HUMAN MILK OLIGOSACCHARIDES MARKET, BY DISTRIBUTION CHANNEL, 2020–2028 ($MILLION)
TABLE 67.SOUTH KOREA HUMAN MILK OLIGOSACCHARIDES MARKET, BY TYPE, 2020–2028 ($MILLION)
TABLE 68.SOUTH KOREA HUMAN MILK OLIGOSACCHARIDES MARKET, BY APPLICATION, 2020–2028 ($MILLION)
TABLE 69.SOUTH KOREA HUMAN MILK OLIGOSACCHARIDES MARKET, BY DISTRIBUTION CHANNEL, 2020–2028 ($MILLION)
TABLE 70.AUSTRALIA HUMAN MILK OLIGOSACCHARIDES MARKET, BY TYPE, 2020–2028 ($MILLION)
TABLE 71.AUSTRALIA HUMAN MILK OLIGOSACCHARIDES MARKET, BY APPLICATION, 2020–2028 ($MILLION)
TABLE 72.AUSTRALIA HUMAN MILK OLIGOSACCHARIDES MARKET, BY DISTRIBUTION CHANNEL, 2020–2028 ($MILLION)
TABLE 73.REST OF ASIA-PACIFIC HUMAN MILK OLIGOSACCHARIDES MARKET, BY TYPE, 2020–2028 ($MILLION)
TABLE 74.REST OF ASIA-PACIFIC HUMAN MILK OLIGOSACCHARIDES MARKET, BY APPLICATION, 2020–2028 ($MILLION)
TABLE 75.REST OF ASIA-PACIFIC HUMAN MILK OLIGOSACCHARIDES MARKET, BY DISTRIBUTION CHANNEL, 2020–2028 ($MILLION)
TABLE 76.LAMEA HUMAN MILK OLIGOSACCHARIDES MARKET, BY TYPE, 2020–2028 ($MILLION)
TABLE 77.LAMEA HUMAN MILK OLIGOSACCHARIDES MARKET, BY APPLICATION, 2020–2028 ($MILLION)
TABLE 78.LAMEA HUMAN MILK OLIGOSACCHARIDES MARKET, BY DISTRIBUTION CHANNEL, 2020–2028 ($MILLION)
TABLE 79.LAMEA HUMAN MILK OLIGOSACCHARIDES MARKET, BY COUNTRY, 2020–2028 ($MILLION)
TABLE 80.BRAZIL HUMAN MILK OLIGOSACCHARIDES MARKET, BY TYPE, 2020–2028 ($MILLION)
TABLE 81.BRAZIL HUMAN MILK OLIGOSACCHARIDES MARKET, BY APPLICATION, 2020–2028 ($MILLION)
TABLE 82.BRAZIL HUMAN MILK OLIGOSACCHARIDES MARKET, BY DISTRIBUTION CHANNEL, 2020–2028 ($MILLION)
TABLE 83.SOUTH AFRICA HUMAN MILK OLIGOSACCHARIDES MARKET, BY TYPE, 2020–2028 ($MILLION)
TABLE 84.SOUTH AFRICA HUMAN MILK OLIGOSACCHARIDES MARKET, BY APPLICATION, 2020–2028 ($MILLION)
TABLE 85.SOUTH AFRICA HUMAN MILK OLIGOSACCHARIDES MARKET, BY DISTRIBUTION CHANNEL, 2020–2028 ($MILLION)
TABLE 86.UNITED ARAB EMIRATES HUMAN MILK OLIGOSACCHARIDES MARKET, BY TYPE, 2020–2028 ($MILLION)
TABLE 87.UNITED ARAB EMIRATES HUMAN MILK OLIGOSACCHARIDES MARKET, BY APPLICATION, 2020–2028 ($MILLION)
TABLE 88.UNITED ARAB EMIRATES HUMAN MILK OLIGOSACCHARIDES MARKET, BY DISTRIBUTION CHANNEL, 2020–2028 ($MILLION)
TABLE 89.REST OF LAMEA HUMAN MILK OLIGOSACCHARIDES MARKET, BY TYPE, 2020–2028 ($MILLION)
TABLE 90.REST OF LAMEA HUMAN MILK OLIGOSACCHARIDES MARKET, BY APPLICATION, 2020–2028 ($MILLION)
TABLE 91.REST OF LAMEA HUMAN MILK OLIGOSACCHARIDES MARKET, BY DISTRIBUTION CHANNEL, 2020–2028 ($MILLION)
TABLE 92.BIOSYNTH CARBOSYNTH: KEY EXECUTIVES
TABLE 93.BIOSYNTH CARBOSYNTH: COMPANY SNAPSHOT
TABLE 94.BIOSYNTH CARBOSYNTH: PRODUCT PORTFOLIO
TABLE 95.CHR. HANSEN HOLDING A/S: KEY EXECUTIVES
TABLE 96.CHR. HANSEN HOLDING A/S: COMPANY SNAPSHOT
TABLE 97.CHR. HANSEN HOLDING A/S: OPERATING SEGMENTS
TABLE 98.CHR. HANSEN HOLDING A/S: PRODUCT PORTFOLIO
TABLE 99.CHR. HANSEN HOLDING A/S: R&D EXPENDITURE, 2018–2020 ($MILLION)
TABLE 100.CHR. HANSEN HOLDING A/S: NET SALES, 2018–2020 ($MILLION)
TABLE 101.DEXTRA LABORATORIES LTD: KEY EXECUTIVES
TABLE 102.DEXTRA LABORATORIES LTD: COMPANY SNAPSHOT
TABLE 103.DEXTRA LABORATORIES LTD: PRODUCT PORTFOLIO
TABLE 104.DUPONT NUTRITION BIOSCIENCES: KEY EXECUTIVES
TABLE 105.DUPONT NUTRITION BIOSCIENCES: COMPANY SNAPSHOT
TABLE 106.DUPONT NUTRITION BIOSCIENCES: PRODUCT PORTFOLIO
TABLE 107.ELICITYL S.A.: KEY EXECUTIVES
TABLE 108.ELICITYL S.A.: COMPANY SNAPSHOT
TABLE 109.ELICITYL S.A.: PRODUCT PORTFOLIO
TABLE 110.GLYCOSYN: KEY EXECUTIVES
TABLE 111.GLYCOSYN: COMPANY SNAPSHOT
TABLE 112.GLYCOSYN: PRODUCT PORTFOLIO
TABLE 113.INBIOSE NV: KEY EXECUTIVES
TABLE 114.INBIOSE NV: COMPANY SNAPSHOT
TABLE 115.INBIOSE NV: PRODUCT PORTFOLIO
TABLE 116.MEDOLAC LABORATORIES: KEY EXECUTIVES
TABLE 117.MEDOLAC LABORATORIES: COMPANY SNAPSHOT
TABLE 118.MEDOLAC LABORATORIES: PRODUCT PORTFOLIO
TABLE 119.NESTLE HEALTH SCIENCE: KEY EXECUTIVES
TABLE 120.NESTLE HEALTH SCIENCE: COMPANY SNAPSHOT
TABLE 121.NESTLE HEALTH SCIENCE: OPERATING SEGMENTS
TABLE 122.NESTLE HEALTH SCIENCE: PRODUCT PORTFOLIO
TABLE 123.NESTLE HEALTH SCIENCE: R&D EXPENDITURE, 2018–2020 ($MILLION)
TABLE 124.NESTLE HEALTH SCIENCE: NET SALES, 2018–2020 ($MILLION)
TABLE 125.ROYAL DSM: KEY EXECUTIVES
TABLE 126.ROYAL DSM: COMPANY SNAPSHOT
TABLE 127.ROYAL DSM: OPERATING SEGMENTS
TABLE 128.ROYAL DSM: PRODUCT PORTFOLIO
TABLE 129.ROYAL DSM: R&D EXPENDITURE, 2018–2020 ($MILLION)
TABLE 130.ROYAL DSM: NET SALES, 2018–2020 ($MILLION)
LIST OF FIGURES
FIGURE 01.KEY MARKET SEGMENTS
FIGURE 02.GLOBAL HUMAN MILK OLIGOSACCHARIDES MARKET
FIGURE 03.TOP INVESTMENT POCKETS
FIGURE 04.MODERATE BARGAINING POWER OF SUPPLIERS
FIGURE 05.MODERATE BARGAINING POWER OF BUYERS
FIGURE 06.MODERATE THREAT OF NEW ENTRANTS
FIGURE 07.LOW THREAT OF SUBSTITUTES
FIGURE 08.HIGH INTENSITY OF COMPETITIVE RIVALRY
FIGURE 09.GLOBAL HUMAN MILK OLIGOSACCHARIDES MARKET: DRIVERS, RESTRAINTS, AND OPPORTUNITIES, 2020–2028
FIGURE 10.GLOBAL HUMAN MILK OLIGOSACCHARIDES MARKET SHARE, BY TYPE, 2020–2028
FIGURE 11.COMPARATIVE SHARE ANALYSIS OF 2’FL HUMAN MILK OLIGOSACCHARIDES MARKET ($MILLION), BY COUNTRY, 2020 & 2028 (%)
FIGURE 12.COMPARATIVE SHARE ANALYSIS OF 3’FL HUMAN MILK OLIGOSACCHARIDES MARKET ($MILLION), BY COUNTRY, 2020 & 2028 (%)
FIGURE 13.COMPARATIVE SHARE ANALYSIS OF 3’SL HUMAN MILK OLIGOSACCHARIDES MARKET($MILLION), BY COUNTRY, 2020 & 2028 (%)
FIGURE 14.COMPARATIVE SHARE ANALYSIS OF 6’SL HUMAN MILK OLIGOSACCHARIDES MARKET ($MILLION), BY COUNTRY, 2020 & 2028 (%)
FIGURE 15.GLOBAL HUMAN MILK OLIGOSACCHARIDES MARKET SHARE, BY APPLICATION, 2020–2028
FIGURE 16.COMPARATIVE SHARE ANALYSIS OF HUMAN MILK OLIGOSACCHARIDES MARKET FOR INFANT FORMULA ($MILLION), BY COUNTRY, 2020 & 2028 (%)
FIGURE 17.COMPARATIVE SHARE ANALYSIS OF HUMAN MILK OLIGOSACCHARIDES MARKET FOR FUNCTIONAL FOOD & BEVERAGE ($MILLION), BY COUNTRY, 2020 & 2028 (%)
FIGURE 18.COMPARATIVE SHARE ANALYSIS OF HUMAN MILK OLIGOSACCHARIDES MARKET FOR FOOD SUPPLEMENTS ($MILLION), BY COUNTRY, 2020 & 2028 (%)
FIGURE 19.GLOBAL HUMAN MILK OLIGOSACCHARIDES MARKET SHARE, BY DISTRIBUTION CHANNEL, 2020–2028
FIGURE 20.COMPARATIVE SHARE ANALYSIS OF HUMAN MILK OLIGOSACCHARIDES MARKET FOR HYPERMARKETS & SUPERMARKETS ($MILLION), BY COUNTRY, 2020 & 2028 (%)
FIGURE 21.COMPARATIVE SHARE ANALYSIS OF HUMAN MILK OLIGOSACCHARIDES MARKET FOR DRUG STORE OR PHARMACY ($MILLION), BY COUNTRY, 2020 & 2028 (%)
FIGURE 22.COMPARATIVE SHARE ANALYSIS OF HUMAN MILK OLIGOSACCHARIDES MARKET FOR MASS MERCHANDISER ($MILLION), BY COUNTRY, 2020 & 2028 (%)
FIGURE 23.COMPARATIVE SHARE ANALYSIS OF HUMAN MILK OLIGOSACCHARIDES MARKET FOR DEPARTMENTAL STORES ($MILLION), BY COUNTRY, 2020 & 2028 (%)
FIGURE 24.COMPARATIVE SHARE ANALYSIS OF HUMAN MILK OLIGOSACCHARIDES MARKET FOR MONO-BRAND STORE ($MILLION), BY COUNTRY, 2020 & 2028 (%)
FIGURE 25.COMPARATIVE SHARE ANALYSIS OF HUMAN MILK OLIGOSACCHARIDES MARKET FOR SPECIALTY STORES ($MILLION), BY COUNTRY, 2020 & 2028 (%)
FIGURE 26.COMPARATIVE SHARE ANALYSIS OF HUMAN MILK OLIGOSACCHARIDES MARKET FOR ONLINE SALES CHANNEL ($MILLION), BY COUNTRY, 2020 & 2028 (%)
FIGURE 27.GLOBAL HUMAN MILK OLIGOSACCHARIDES MARKET SHARE, BY REGION, 2020–2028
FIGURE 28.U.S. HUMAN MILK OLIGOSACCHARIDES MARKET REVENUE, 2020–2028 ($MILLION)
FIGURE 29.CANADA HUMAN MILK OLIGOSACCHARIDES MARKET REVENUE, 2020–2028 ($MILLION)
FIGURE 30.MEXICO HUMAN MILK OLIGOSACCHARIDES MARKET REVENUE, 2020–2028 ($MILLION)
FIGURE 31.UK HUMAN MILK OLIGOSACCHARIDES MARKET REVENUE, 2020–2028 ($MILLION)
FIGURE 32.FRANCE HUMAN MILK OLIGOSACCHARIDES MARKET REVENUE, 2020–2028 ($MILLION)
FIGURE 33.NETHERLANDS HUMAN MILK OLIGOSACCHARIDES MARKET REVENUE, 2020–2028 ($MILLION)
FIGURE 34.GERMANY HUMAN MILK OLIGOSACCHARIDES MARKET REVENUE, 2020–2028 ($MILLION)
FIGURE 35.TURKEY HUMAN MILK OLIGOSACCHARIDES MARKET REVENUE, 2020–2028 ($MILLION)
FIGURE 36.REST OF EUROPE HUMAN MILK OLIGOSACCHARIDES MARKET REVENUE, 2020–2028 ($MILLION)
FIGURE 37.CHINA HUMAN MILK OLIGOSACCHARIDES MARKET REVENUE, 2020–2028 ($MILLION)
FIGURE 38.JAPAN HUMAN MILK OLIGOSACCHARIDES MARKET REVENUE, 2020–2028 ($MILLION)
FIGURE 39.INDIA HUMAN MILK OLIGOSACCHARIDES MARKET REVENUE, 2020–2028 ($MILLION)
FIGURE 40.SOUTH KOREA HUMAN MILK OLIGOSACCHARIDES MARKET REVENUE, 2020–2028 ($MILLION)
FIGURE 41.AUSTRALIA HUMAN MILK OLIGOSACCHARIDES MARKET REVENUE, 2020–2028 ($MILLION)
FIGURE 42.REST OF ASIA-PACIFIC HUMAN MILK OLIGOSACCHARIDES MARKET REVENUE, 2020–2028 ($MILLION)
FIGURE 43.BRAZIL HUMAN MILK OLIGOSACCHARIDES MARKET REVENUE, 2020–2028 ($MILLION)
FIGURE 44.SOUTH AFRICA HUMAN MILK OLIGOSACCHARIDES MARKET REVENUE, 2020–2028 ($MILLION)
FIGURE 45.UNITED ARAB EMIRATES HUMAN MILK OLIGOSACCHARIDES MARKET REVENUE, 2020–2028 ($MILLION)
FIGURE 46.REST OF LAMEA HUMAN MILK OLIGOSACCHARIDES MARKET REVENUE, 2020–2028 ($MILLION)
FIGURE 47.TOP WINNING STRATEGIES, BY YEAR, 2018–2021*
FIGURE 48.TOP WINNING STRATEGIES, BY DEVELOPMENT, 2018–2021* (%)
FIGURE 49.TOP WINNING STRATEGIES, BY COMPANY, 2018–2021*
FIGURE 50.PRODUCT MAPPING OF TOP 10 KEY PLAYERS
FIGURE 51.COMPETITIVE DASHBOARD OF TOP 10 KEY PLAYERS
FIGURE 52.COMPETITIVE HEATMAP OF TOP 10 KEY PLAYERS
FIGURE 53.CHR. HANSEN HOLDING A/S: R&D EXPENDITURE, 2018–2020 ($MILLION)
FIGURE 54.CHR. HANSEN HOLDING A/S: NET SALES, 2018–2020 ($MILLION)
FIGURE 55.CHR. HANSEN HOLDING A/S: REVENUE SHARE BY SEGMENT, 2020 (%)
FIGURE 56.CHR. HANSEN HOLDING A/S: REVENUE SHARE BY REGION, 2020 (%)
FIGURE 57.NESTLE HEALTH SCIENCE: R&D EXPENDITURE, 2018–2020 ($MILLION)
FIGURE 58.NESTLE HEALTH SCIENCE: NET SALES, 2018–2020 ($MILLION)
FIGURE 59.NESTLE HEALTH SCIENCE: REVENUE SHARE BY SEGMENT, 2020 (%)
FIGURE 60.NESTLE HEALTH SCIENCE: REVENUE SHARE BY REGION, 2020(%)
FIGURE 61.ROYAL DSM: R&D EXPENDITURE, 2018–2020 ($MILLION)
FIGURE 62.ROYAL DSM: NET SALES, 2018–2020 ($MILLION)
FIGURE 63.ROYAL DSM: REVENUE SHARE BY SEGMENT, 2020 (%)
FIGURE 64.ROYAL DSM: REVENUE SHARE BY REGION, 2020 (%)
Human milk oligosaccharide (HMO) is a sugar found in human breast milk that is the third most abundant solid component after lactose and fats. It promotes vital health benefits related to immunity, digestion, and cognitive health. A number of factors are accelerating the growth of the HMO industry. The dairy industry's promising growth, surge in demand for food supplements, rise in demand for infant formula, and surge in health consciousness are the primary factors driving market growth.
HMOs have recently been recognized as an important component of food supplements and infant formulas. The FDA has studied infant formula supplemented with HMOs such as 2'fucosyllactose, lacto-N-neotetraose, and 2 oligosaccharides and recommended it as safe, well-tolerated, and supportive of age-appropriate growth in infants. Working mothers and mothers whose breast milk is deficient in HMOs can supplement their children's holistic development and nutritional needs by using infant formulas containing these unique oligosaccharides.
Abbott Healthcare's Similac infant nutrition formula contains 2'FL as one of its key ingredients. Many other applications of HMOs for adults have been identified. Glycom S/A, a Danish biotechnology company, for example, manufactures Holigos IBS to treat irritable bowel syndrome symptoms such as abdominal pain, constipation, diarrhea, and bloating. Many companies have taken advantage of the growing popularity of probiotics and their benefits for gut health to market dietary supplements containing HMO.
A. The global Human Milk Oligosaccharides (HMO) market size was valued at $125.9 million in 2020, and is estimated to reach $332.6 million by 2028, registering a CAGR of 14.1% from 2021 to 2028.
A. The CAGR of Human Milk Oligosaccharides (HMO) Market is 14.1% from 2021 to 2028.
A. The sample report of global Human Milk Oligosaccharides (HMO) market is available on Allied Market Research website on request.
A. The base year calculated in the Human Milk Oligosaccharides (HMO) market report is 2020.
A. The top companies in the global Human Milk Oligosaccharides (HMO) market are Abbott Laboratories, BASF S.E., Biosynth Carbosynth, Chr. Hansen Holding A/S, Dextra Laboratories Ltd., Dupont Nutrition & Biosciences, Elicityl S.A., Glycom A/S, Glycosyn, Inbiose NV, Medolac Laboratories, Neolacta Lifesciences Pvt. Ltd, Nestle Health Science, Royal DSM and ZuChem.
A. The global Human Milk Oligosaccharides (HMO) market is segmented on the basis of type, application, distribution channel, and region. On the basis of type, the market is categorized into 2’FL, 3’FL, 3’SL, and 6’SL. As per application, it is divided into infant formula, functional food & beverage, and food supplements. According to distribution channel, the Human Milk Oligosaccharides (HMO) market is fragmented into hypermarkets & supermarkets, drug store or pharmacy, mass merchandiser, departmental stores, mono-brand stores, specialty stores, and online sales channel. Region-wise, the market is analyzed across North America (the U.S., Canada, and Mexico), Europe (the UK, France, the Netherlands, Germany, Turkey, and the rest of Europe), Asia-Pacific (China, Japan, India, South Korea, Australia, and the rest of Asia-Pacific), and LAMEA (Brazil, South Africa, the UAE, and the rest of LAMEA).
A. The key trends such as increased health consciousness among the consumers and surge in growth of food supplements will drive the Human Milk Oligosaccharides (HMO) market growth during the forecast period.
A. 2’FL market holds the maximum market share of the Human Milk Oligosaccharides (HMO) market.
A. Due to COVID-19 pandemic, several brands have shifted their focus to e-commerce platforms to generate revenue and increase sales. Offline sales are increasing right now as government lockdown restrictions are gradually being lifted in a number of countries. This will have positive impact on Human Milk Oligosaccharides (HMO) Market in 2021.
Start reading instantly.
This Report and over 66,783+ more Reports, Available with Avenue Library. T&C*.
Enterprise
License/PDF
Library
Membership
*Taxes/Fees, if applicable will be added during checkout. All prices in USD
To ensure high-level data integrity, accurate analysis, and impeccable forecasts
For complete satisfaction
On-demand customization of scope of the report to exactly meet your needs
Targeted market view to provide pertinent information and save time of readers
Get insights on topics that are crucial for your business. Stay abreast of your interest areas.
Get Industry Data AlertsTo ensure high-level data integrity, accurate analysis, and impeccable forecasts
For complete satisfaction
On-demand customization of scope of the report to exactly meet your needs
Targeted market view to provide pertinent information and save time of readers