0
2022
Hydrogen Powered Tractor Market

Hydrogen Powered Tractor Market

by Installation (OEM, Retrofit), by Product (Proton Exchange Membrane Fuel Cell, Phosphoric Acid Fuel Cell, Solid Oxide Fuel Cell, Others), by Application (Agriculture, Industries, Mining, Others), by Capacity (Less Than 25 tonnes, More Than 25 tonnes): Global Opportunity Analysis and Industry Forecast, 2025-2035

Report Code: A07808
Jul 2022 | Pages: 380
Tables: 223
Charts: 73
  • Formats*:

  • pdf

    Single User License, Five User
    License & Enterprise User License

  • xls

    Data Pack Excel License

  • ppt

    It comes with the additional cost
    of $2500.00 contact sales.


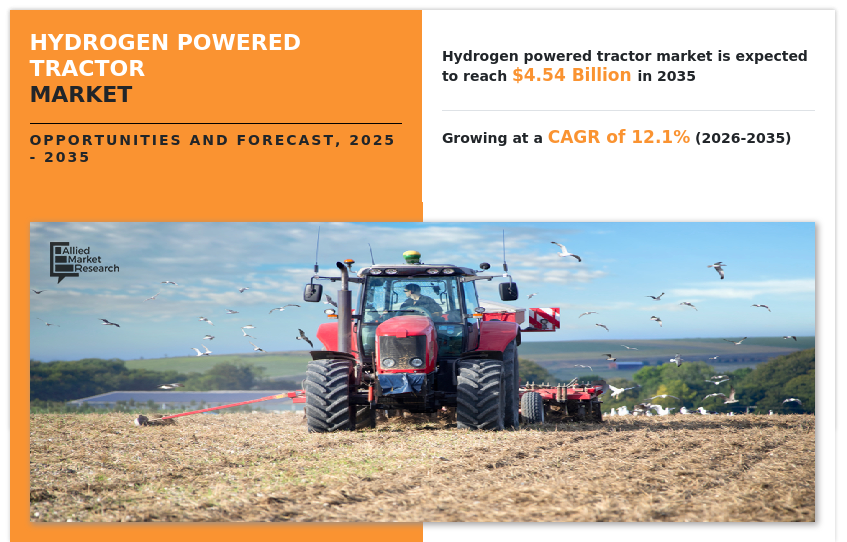
The global hydrogen powered tractor market was valued at $1.57 billion in 2025, and is projected to reach $4.54 billion by 2035, growing at a CAGR of 12.1% from 2026 to 2035.
The COVID-19 impact on the agriculture and automotive industry is unpredictable, and is expected to remain in force for a few years. The COVID-19 outbreak forced governments across the globe to implement stringent lockdown and ban import–export of essential raw material items for most of 2020, and few months in 2021. This led to sudden decline in availability of important raw materials for vehicle components. The COVID-19 pandemic not only affected operations of the automotive and agriculture industry, but the economic crisis also led to reduction in expenditure on next-generation technologies, for instance, hydrogen-powered tractors. Many governments trimmed their spending on other sectors and poured a hefty amount of investment in improving healthcare facilities to lessen dangers pertaining to the pandemic. Before COVID-19, the agriculture industry witnessed continuous growth. Governments all around the globe were focusing on investing huge amount for hydrogen-based vehicles and related technologies. However, adverse impacts of the COVID-19 pandemic have resulted in interruption in activities and initiatives regarding development of hydrogen powered tractors

Hydrogen Powered Tractor Market, Hydrogen Powered Tractor Industry

The hydrogen powered tractor market is segmented into Installation, Product, Application and Capacity.

Tractors are utilized as agricultural vehicles to provide power for several agricultural activities such as harrowing, tilling, plowing, and planting. They are available in various power ranges, including less than 20 HP to more than 60 HP. It is used in applications such as row crop, orchard, and gardening. A hydrogen tractor is a vehicle that makes use of hydrogen as a power source. Research on hydrogen as a potential fuel to power zero-emission tractors has been on rise in recent years. The agriculture equipment sector is working to develop technologies to tackle challenges associated with hydrogen storage infrastructure.

Factors such as growth in mechanization in agriculture activities, high suitability of hydrogen as fuel, and reduced greenhouse gas emissions are anticipated to boost growth of the global hydrogen powered tractor market during the forecast period. However, high costs associated with production and handling of hydrogen and lack of awareness regarding efficient agriculture tractors among farmers are expected to hinder growth of the global hydrogen fuel cell tractor market during the forecast period. Moreover, technological advancements, future potential in the hydrogen fuel cell vehicle market, and government support for the development of agricultural activities is expected to create opportunities for the hydrogen powered tractor industry in the future.
Hydrogen Powered Tractor Market

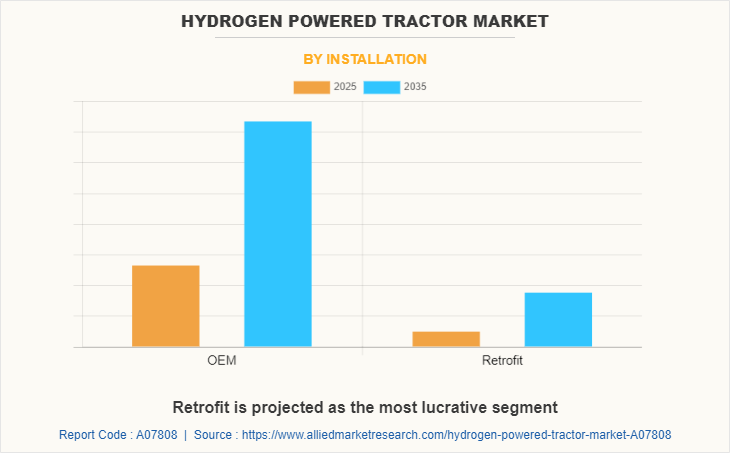
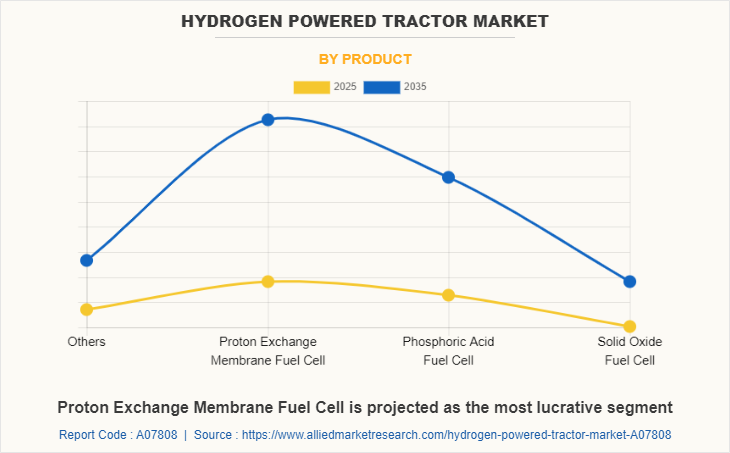
The hydrogen powered tractor market is segmented on the basis of installation, product, application, capacity, and region. By installation, it is divided into OEM and retrofit. By product, it is segmented into proton exchange, membrane fuel cell, phosphoric acid fuel cell, solid oxide fuel cell, and others. By application, it is divided into agriculture, industries, mining, and others. By capacity, the market is divided into less than 25 tons and more than 25 tons. By region, the market is analyzed across North America, Europe, Asia-Pacific and LAMEA.

Key players that operate in this hydrogen powered tractor market include Allis-Chalmers, Amogy, Inc., Ballard Power Systems, Blue Fuel Solutions (CMB. TECH), BMW, CNH Industrial N.V., Cummins Inc., Deere & Company, Fendt, H2Trac B.V., Honda Motor Co., Ltd., Hyster-Yale Group Inc., Hyundai Motor Company, Kubota Corporation, SDF Group, Terberg Special Vehicles, and Toyota Motor Corporation.
Hydrogen Powered Tractor Market

Growth in mechanization in agriculture activities

Increase in mechanization of agricultural activities allows reduction of drudgery contributed by labor-intensive farming techniques. Thus, involvement of sustainable mechanization can increase land productivity by improving quality of cultivation and reducing operational times. Problems such as dearth in labor can be resolved using mechanization techniques during agricultural operations. Overall mechanization in the agricultural industry in India registered 40-45% in 2020, whereas overall mechanization in the U.S., China, and Brazil were 95%, 57%, and 75%, respectively. In addition, it contributes toward reducing poverty and provides food security, which, in turn, improves lifestyles and livelihoods of majority of population in the agricultural industry. Thus, increase in mechanization of agricultural activities drives adoption of tractors in the agricultural sector, which, in turn, is expected to fuel growth of the hydrogen powered tractor market.

High suitability of hydrogen as fuel

To support the ever-rising vehicle-traffic, industrial & mining applications, and agricultural activities, a fuel must be found to replace petroleum-based fuels. New fuels should be accessible at a global level without causing any hazard of control by a cartel (for instance, Organization of the Petroleum Exporting Countries (OPEC)) and must meet fundamental requirements of safety performance, environment, and economic considerations. Hydrogen has the potential to substitute currently used fuel. Hydrogen as an energy carrier for usage in a vehicle has some exceptional qualities such as minimum pollution and lightweight, global availability, and safety, thus making it a suitable fuel. In comparison with li-ion batteries, hydrogen has a greater energy density, both in terms of gravimetric and volumetric measures. Furthermore, hydrogen is expected to enter into usage in several industries, which could quicken advancements of fuel cells and storage systems, push downstream infrastructure, and drive down supply chain costs. Hence, all such factors are expected to propel the hydrogen powered tractor industry growth.

Hydrogen Powered Tractor Market
By Application

Your browser does not support the canvas element.

Agriculture is projected as the most lucrative segment

Get more information on this report : Request Sample Pages

High costs associated with production and handling of hydrogen

Hydrogen (in gaseous form) is usually extracted from water by electrolysis process, which includes passing a high electric current through water to isolate oxygen and hydrogen atoms. Electrolysis process is quite expensive as it includes high expenditure on energy requirements. Furthermore, hydrogen poses challenges for designers, in terms of mass and volume requirements, as well as for fuel management and storage onboard vehicle. High volume-to-energy property of liquid hydrogen (LH2) requires hydrogen powered tractor to contain a huge quantity of fuel compared to legacy diesel-fueled tractors. A typical property of hydrogen is that it has a lower density. Its density is quite lower than gasoline. For this reason, it has to be compressed and brought to a liquid state and stocked in the same manner at lower temperatures to sustain its effectiveness and efficiency as a power source. This is the reason why hydrogen must necessarily be transported and stored in high-pressure conditions, which makes the application of hydrogen for transportation and common use difficult presently. Above mentioned factors are anticipated to obstruct the market growth of the hydrogen powered tractor market during the forecast period.

Technological advancements and future potential in the hydrogen fuel cell vehicle market

Increase in R&D activities related to hydrogen fuel cell technology has led to rise in joint developments and partnerships regarding adoption of the HFCV market. Moreover, governments across the globe are promoting use of hydrogen powered vehicles. For instance, in 2019, European Union (EU) started H2Haul project which will run for five years. This EU-funded project aims to deploy 16 zero-emission fuel cell vehicles at four sites i.e., Germany, Belgium, Switzerland, and France by 2024. Moreover, the California Air Resources Board (CARB), Toyota, Shell, and Kenworth started $82 million Zero-Emission and Near Zero-Emission Freight Facilities (ZANZEFF) project. With the use of this project Port of Los Angeles (POLA) is expected to establish a fuel-cell technology network for freight transport to move goods from “Shore to Store”.  In addition to this, partnerships among OEMs to develop hydrogen powered tractors and technological advances regarding HFCV provide a major growth opportunity for the hydrogen fuel cell tractor market. For instance, in December 2020, Hyster-Yale Group and Capacity Trucks announced partnership to jointly develop a hydrogen powered terminal tractors with automation-ready capabilities. Hence, these factors are expected to propel growth of the market during the forecast period.
Hydrogen Powered Tractor Market

Key Benefits For Stakeholders

  • This report provides a quantitative analysis of the market segments, current trends, estimations, and dynamics of the hydrogen powered tractor market analysis from 2025 to 2035 to identify the prevailing hydrogen powered tractor market opportunities.
  • The market research is offered along with information related to key drivers, restraints, and opportunities.
  • Porter's five forces analysis highlights the potency of buyers and suppliers to enable stakeholders make profit-oriented business decisions and strengthen their supplier-buyer network.
  • In-depth analysis of the hydrogen powered tractor market segmentation assists to determine the prevailing market opportunities.
  • Major countries in each region are mapped according to their revenue contribution to the global market.
  • Market player positioning facilitates benchmarking and provides a clear understanding of the present position of the market players.
  • The report includes the analysis of the regional as well as global hydrogen powered tractor market trends, key players, market segments, application areas, and market growth strategies.

Hydrogen Powered Tractor Market Report Highlights

Aspects Details
By Installation
  • OEM
  • Retrofit
By Product
  • Proton Exchange Membrane Fuel Cell
  • Phosphoric Acid Fuel Cell
  • Solid Oxide Fuel Cell
  • Others
By Application
  • Agriculture
  • Industries
  • Mining
  • Others
By Capacity
  • Less Than 25 tonnes
  • More Than 25 tonnes
By Region
  • North America  (U.S., Canada, Mexico)
  • Europe  (Germany, France, Netherlands, U.K., Poland, Spain, Russia, Rest of Europe)
  • Asia-Pacific  (China, India, Japan, South Korea, Asean, Rest of Asia-Pacific)
  • LAMEA  (Brazil, UAE, Saudi Arabia, South Africa, Rest of LAMEA)
Key Market Players Toyota, Cummins Inc., CNH Industrial N.V., Blue Fuel Solutions, Terberg, Hyster Yale Group, New Holland, Deutz Fahr group, H2Trac B.V., Kubota Corporation, Allis Chalmers, Ballard Power Systems, Amogy, Inc, Fendt, Hyundai Motor Company, BMW, Deere Company
 
  • CHAPTER 1:INTRODUCTION

    • 1.1.Report description

    • 1.2.Key market segments

    • 1.3.Key benefits to the stakeholders

    • 1.4.Research Methodology

      • 1.4.1.Secondary research

      • 1.4.2.Primary research

      • 1.4.3.Analyst tools and models

  • CHAPTER 2:EXECUTIVE SUMMARY

    • 2.1.Key findings of the study

    • 2.2.CXO Perspective

  • CHAPTER 3:MARKET OVERVIEW

    • 3.1.Market definition and scope

    • 3.2.Key findings

      • 3.2.1.Top investment pockets

    • 3.3.Porter’s five forces analysis

    • 3.4.Top player positioning

    • 3.5.Market dynamics

      • 3.5.1.Drivers

      • 3.5.2.Restraints

      • 3.5.3.Opportunities

    • 3.6.COVID-19 Impact Analysis on the market

  • CHAPTER 4: HYDROGEN POWERED TRACTOR MARKET, BY INSTALLATION

    • 4.1 Overview

      • 4.1.1 Market size and forecast

    • 4.2 OEM

      • 4.2.1 Key market trends, growth factors and opportunities

      • 4.2.2 Market size and forecast, by region

      • 4.2.3 Market analysis by country

    • 4.3 Retrofit

      • 4.3.1 Key market trends, growth factors and opportunities

      • 4.3.2 Market size and forecast, by region

      • 4.3.3 Market analysis by country

  • CHAPTER 5: HYDROGEN POWERED TRACTOR MARKET, BY PRODUCT

    • 5.1 Overview

      • 5.1.1 Market size and forecast

    • 5.2 Proton Exchange Membrane Fuel Cell

      • 5.2.1 Key market trends, growth factors and opportunities

      • 5.2.2 Market size and forecast, by region

      • 5.2.3 Market analysis by country

    • 5.3 Phosphoric Acid Fuel Cell

      • 5.3.1 Key market trends, growth factors and opportunities

      • 5.3.2 Market size and forecast, by region

      • 5.3.3 Market analysis by country

    • 5.4 Solid Oxide Fuel Cell

      • 5.4.1 Key market trends, growth factors and opportunities

      • 5.4.2 Market size and forecast, by region

      • 5.4.3 Market analysis by country

    • 5.5 Others

      • 5.5.1 Key market trends, growth factors and opportunities

      • 5.5.2 Market size and forecast, by region

      • 5.5.3 Market analysis by country

  • CHAPTER 6: HYDROGEN POWERED TRACTOR MARKET, BY APPLICATION

    • 6.1 Overview

      • 6.1.1 Market size and forecast

    • 6.2 Agriculture

      • 6.2.1 Key market trends, growth factors and opportunities

      • 6.2.2 Market size and forecast, by region

      • 6.2.3 Market analysis by country

    • 6.3 Industries

      • 6.3.1 Key market trends, growth factors and opportunities

      • 6.3.2 Market size and forecast, by region

      • 6.3.3 Market analysis by country

    • 6.4 Mining

      • 6.4.1 Key market trends, growth factors and opportunities

      • 6.4.2 Market size and forecast, by region

      • 6.4.3 Market analysis by country

    • 6.5 Others

      • 6.5.1 Key market trends, growth factors and opportunities

      • 6.5.2 Market size and forecast, by region

      • 6.5.3 Market analysis by country

  • CHAPTER 7: HYDROGEN POWERED TRACTOR MARKET, BY CAPACITY

    • 7.1 Overview

      • 7.1.1 Market size and forecast

    • 7.2 Less Than 25 tonnes

      • 7.2.1 Key market trends, growth factors and opportunities

      • 7.2.2 Market size and forecast, by region

      • 7.2.3 Market analysis by country

    • 7.3 More Than 25 tonnes

      • 7.3.1 Key market trends, growth factors and opportunities

      • 7.3.2 Market size and forecast, by region

      • 7.3.3 Market analysis by country

  • CHAPTER 8: HYDROGEN POWERED TRACTOR MARKET, BY REGION

    • 8.1 Overview

      • 8.1.1 Market size and forecast

    • 8.2 North America

      • 8.2.1 Key trends and opportunities

      • 8.2.2 North America Market size and forecast, by Installation

      • 8.2.3 North America Market size and forecast, by Product

      • 8.2.4 North America Market size and forecast, by Application

      • 8.2.5 North America Market size and forecast, by Capacity

      • 8.2.6 North America Market size and forecast, by country

        • 8.2.6.1 U.S.
          • 8.2.6.1.1 Market size and forecast, by Installation
          • 8.2.6.1.2 Market size and forecast, by Product
          • 8.2.6.1.3 Market size and forecast, by Application
          • 8.2.6.1.4 Market size and forecast, by Capacity
        • 8.2.6.2 Canada
          • 8.2.6.2.1 Market size and forecast, by Installation
          • 8.2.6.2.2 Market size and forecast, by Product
          • 8.2.6.2.3 Market size and forecast, by Application
          • 8.2.6.2.4 Market size and forecast, by Capacity
        • 8.2.6.3 Mexico
          • 8.2.6.3.1 Market size and forecast, by Installation
          • 8.2.6.3.2 Market size and forecast, by Product
          • 8.2.6.3.3 Market size and forecast, by Application
          • 8.2.6.3.4 Market size and forecast, by Capacity
    • 8.3 Europe

      • 8.3.1 Key trends and opportunities

      • 8.3.2 Europe Market size and forecast, by Installation

      • 8.3.3 Europe Market size and forecast, by Product

      • 8.3.4 Europe Market size and forecast, by Application

      • 8.3.5 Europe Market size and forecast, by Capacity

      • 8.3.6 Europe Market size and forecast, by country

        • 8.3.6.1 Germany
          • 8.3.6.1.1 Market size and forecast, by Installation
          • 8.3.6.1.2 Market size and forecast, by Product
          • 8.3.6.1.3 Market size and forecast, by Application
          • 8.3.6.1.4 Market size and forecast, by Capacity
        • 8.3.6.2 France
          • 8.3.6.2.1 Market size and forecast, by Installation
          • 8.3.6.2.2 Market size and forecast, by Product
          • 8.3.6.2.3 Market size and forecast, by Application
          • 8.3.6.2.4 Market size and forecast, by Capacity
        • 8.3.6.3 Netherlands
          • 8.3.6.3.1 Market size and forecast, by Installation
          • 8.3.6.3.2 Market size and forecast, by Product
          • 8.3.6.3.3 Market size and forecast, by Application
          • 8.3.6.3.4 Market size and forecast, by Capacity
        • 8.3.6.4 U.K.
          • 8.3.6.4.1 Market size and forecast, by Installation
          • 8.3.6.4.2 Market size and forecast, by Product
          • 8.3.6.4.3 Market size and forecast, by Application
          • 8.3.6.4.4 Market size and forecast, by Capacity
        • 8.3.6.5 Poland
          • 8.3.6.5.1 Market size and forecast, by Installation
          • 8.3.6.5.2 Market size and forecast, by Product
          • 8.3.6.5.3 Market size and forecast, by Application
          • 8.3.6.5.4 Market size and forecast, by Capacity
        • 8.3.6.6 Spain
          • 8.3.6.6.1 Market size and forecast, by Installation
          • 8.3.6.6.2 Market size and forecast, by Product
          • 8.3.6.6.3 Market size and forecast, by Application
          • 8.3.6.6.4 Market size and forecast, by Capacity
        • 8.3.6.7 Russia
          • 8.3.6.7.1 Market size and forecast, by Installation
          • 8.3.6.7.2 Market size and forecast, by Product
          • 8.3.6.7.3 Market size and forecast, by Application
          • 8.3.6.7.4 Market size and forecast, by Capacity
        • 8.3.6.8 Rest of Europe
          • 8.3.6.8.1 Market size and forecast, by Installation
          • 8.3.6.8.2 Market size and forecast, by Product
          • 8.3.6.8.3 Market size and forecast, by Application
          • 8.3.6.8.4 Market size and forecast, by Capacity
    • 8.4 Asia-Pacific

      • 8.4.1 Key trends and opportunities

      • 8.4.2 Asia-Pacific Market size and forecast, by Installation

      • 8.4.3 Asia-Pacific Market size and forecast, by Product

      • 8.4.4 Asia-Pacific Market size and forecast, by Application

      • 8.4.5 Asia-Pacific Market size and forecast, by Capacity

      • 8.4.6 Asia-Pacific Market size and forecast, by country

        • 8.4.6.1 China
          • 8.4.6.1.1 Market size and forecast, by Installation
          • 8.4.6.1.2 Market size and forecast, by Product
          • 8.4.6.1.3 Market size and forecast, by Application
          • 8.4.6.1.4 Market size and forecast, by Capacity
        • 8.4.6.2 India
          • 8.4.6.2.1 Market size and forecast, by Installation
          • 8.4.6.2.2 Market size and forecast, by Product
          • 8.4.6.2.3 Market size and forecast, by Application
          • 8.4.6.2.4 Market size and forecast, by Capacity
        • 8.4.6.3 Japan
          • 8.4.6.3.1 Market size and forecast, by Installation
          • 8.4.6.3.2 Market size and forecast, by Product
          • 8.4.6.3.3 Market size and forecast, by Application
          • 8.4.6.3.4 Market size and forecast, by Capacity
        • 8.4.6.4 South Korea
          • 8.4.6.4.1 Market size and forecast, by Installation
          • 8.4.6.4.2 Market size and forecast, by Product
          • 8.4.6.4.3 Market size and forecast, by Application
          • 8.4.6.4.4 Market size and forecast, by Capacity
        • 8.4.6.5 Asean
          • 8.4.6.5.1 Market size and forecast, by Installation
          • 8.4.6.5.2 Market size and forecast, by Product
          • 8.4.6.5.3 Market size and forecast, by Application
          • 8.4.6.5.4 Market size and forecast, by Capacity
        • 8.4.6.6 Rest of Asia-Pacific
          • 8.4.6.6.1 Market size and forecast, by Installation
          • 8.4.6.6.2 Market size and forecast, by Product
          • 8.4.6.6.3 Market size and forecast, by Application
          • 8.4.6.6.4 Market size and forecast, by Capacity
    • 8.5 LAMEA

      • 8.5.1 Key trends and opportunities

      • 8.5.2 LAMEA Market size and forecast, by Installation

      • 8.5.3 LAMEA Market size and forecast, by Product

      • 8.5.4 LAMEA Market size and forecast, by Application

      • 8.5.5 LAMEA Market size and forecast, by Capacity

      • 8.5.6 LAMEA Market size and forecast, by country

        • 8.5.6.1 Brazil
          • 8.5.6.1.1 Market size and forecast, by Installation
          • 8.5.6.1.2 Market size and forecast, by Product
          • 8.5.6.1.3 Market size and forecast, by Application
          • 8.5.6.1.4 Market size and forecast, by Capacity
        • 8.5.6.2 UAE
          • 8.5.6.2.1 Market size and forecast, by Installation
          • 8.5.6.2.2 Market size and forecast, by Product
          • 8.5.6.2.3 Market size and forecast, by Application
          • 8.5.6.2.4 Market size and forecast, by Capacity
        • 8.5.6.3 Saudi Arabia
          • 8.5.6.3.1 Market size and forecast, by Installation
          • 8.5.6.3.2 Market size and forecast, by Product
          • 8.5.6.3.3 Market size and forecast, by Application
          • 8.5.6.3.4 Market size and forecast, by Capacity
        • 8.5.6.4 South Africa
          • 8.5.6.4.1 Market size and forecast, by Installation
          • 8.5.6.4.2 Market size and forecast, by Product
          • 8.5.6.4.3 Market size and forecast, by Application
          • 8.5.6.4.4 Market size and forecast, by Capacity
        • 8.5.6.5 Rest of LAMEA
          • 8.5.6.5.1 Market size and forecast, by Installation
          • 8.5.6.5.2 Market size and forecast, by Product
          • 8.5.6.5.3 Market size and forecast, by Application
          • 8.5.6.5.4 Market size and forecast, by Capacity
  • CHAPTER 9: COMPANY LANDSCAPE

    • 9.1. Introduction

    • 9.2. Top winning strategies

    • 9.3. Product Mapping of Top 10 Player

    • 9.4. Competitive Dashboard

    • 9.5. Competitive Heatmap

    • 9.6. Key developments

  • CHAPTER 10: COMPANY PROFILES

    • 10.1 Allis Chalmers

      • 10.1.1 Company overview

      • 10.1.2 Company snapshot

      • 10.1.3 Operating business segments

      • 10.1.4 Product portfolio

      • 10.1.5 Business performance

      • 10.1.6 Key strategic moves and developments

    • 10.2 Amogy, Inc

      • 10.2.1 Company overview

      • 10.2.2 Company snapshot

      • 10.2.3 Operating business segments

      • 10.2.4 Product portfolio

      • 10.2.5 Business performance

      • 10.2.6 Key strategic moves and developments

    • 10.3 Ballard Power Systems

      • 10.3.1 Company overview

      • 10.3.2 Company snapshot

      • 10.3.3 Operating business segments

      • 10.3.4 Product portfolio

      • 10.3.5 Business performance

      • 10.3.6 Key strategic moves and developments

    • 10.4 Blue Fuel Solutions

      • 10.4.1 Company overview

      • 10.4.2 Company snapshot

      • 10.4.3 Operating business segments

      • 10.4.4 Product portfolio

      • 10.4.5 Business performance

      • 10.4.6 Key strategic moves and developments

    • 10.5 BMW

      • 10.5.1 Company overview

      • 10.5.2 Company snapshot

      • 10.5.3 Operating business segments

      • 10.5.4 Product portfolio

      • 10.5.5 Business performance

      • 10.5.6 Key strategic moves and developments

    • 10.6 CNH Industrial N.V.

      • 10.6.1 Company overview

      • 10.6.2 Company snapshot

      • 10.6.3 Operating business segments

      • 10.6.4 Product portfolio

      • 10.6.5 Business performance

      • 10.6.6 Key strategic moves and developments

    • 10.7 Cummins Inc.

      • 10.7.1 Company overview

      • 10.7.2 Company snapshot

      • 10.7.3 Operating business segments

      • 10.7.4 Product portfolio

      • 10.7.5 Business performance

      • 10.7.6 Key strategic moves and developments

    • 10.8 Deere Company

      • 10.8.1 Company overview

      • 10.8.2 Company snapshot

      • 10.8.3 Operating business segments

      • 10.8.4 Product portfolio

      • 10.8.5 Business performance

      • 10.8.6 Key strategic moves and developments

    • 10.9 Deutz Fahr group

      • 10.9.1 Company overview

      • 10.9.2 Company snapshot

      • 10.9.3 Operating business segments

      • 10.9.4 Product portfolio

      • 10.9.5 Business performance

      • 10.9.6 Key strategic moves and developments

    • 10.10 Fendt

      • 10.10.1 Company overview

      • 10.10.2 Company snapshot

      • 10.10.3 Operating business segments

      • 10.10.4 Product portfolio

      • 10.10.5 Business performance

      • 10.10.6 Key strategic moves and developments

    • 10.11 H2Trac B.V.

      • 10.11.1 Company overview

      • 10.11.2 Company snapshot

      • 10.11.3 Operating business segments

      • 10.11.4 Product portfolio

      • 10.11.5 Business performance

      • 10.11.6 Key strategic moves and developments

    • 10.12 Hyster Yale Group

      • 10.12.1 Company overview

      • 10.12.2 Company snapshot

      • 10.12.3 Operating business segments

      • 10.12.4 Product portfolio

      • 10.12.5 Business performance

      • 10.12.6 Key strategic moves and developments

    • 10.13 Hyundai Motor Company

      • 10.13.1 Company overview

      • 10.13.2 Company snapshot

      • 10.13.3 Operating business segments

      • 10.13.4 Product portfolio

      • 10.13.5 Business performance

      • 10.13.6 Key strategic moves and developments

    • 10.14 Kubota Corporation

      • 10.14.1 Company overview

      • 10.14.2 Company snapshot

      • 10.14.3 Operating business segments

      • 10.14.4 Product portfolio

      • 10.14.5 Business performance

      • 10.14.6 Key strategic moves and developments

    • 10.15 New Holland

      • 10.15.1 Company overview

      • 10.15.2 Company snapshot

      • 10.15.3 Operating business segments

      • 10.15.4 Product portfolio

      • 10.15.5 Business performance

      • 10.15.6 Key strategic moves and developments

    • 10.16 Terberg

      • 10.16.1 Company overview

      • 10.16.2 Company snapshot

      • 10.16.3 Operating business segments

      • 10.16.4 Product portfolio

      • 10.16.5 Business performance

      • 10.16.6 Key strategic moves and developments

    • 10.17 Toyota

      • 10.17.1 Company overview

      • 10.17.2 Company snapshot

      • 10.17.3 Operating business segments

      • 10.17.4 Product portfolio

      • 10.17.5 Business performance

      • 10.17.6 Key strategic moves and developments

  • LIST OF TABLES

  • TABLE 1. GLOBAL HYDROGEN POWERED TRACTOR MARKET, BY INSTALLATION, 2025-2035 ($MILLION)
    TABLE 2. HYDROGEN POWERED TRACTOR MARKET SIZE, FOR OEM, BY REGION, 2025-2035 ($MILLION)
    TABLE 3. HYDROGEN POWERED TRACTOR MARKET FOR OEM BY COUNTRY, 2025-2035 ($MILLION)
    TABLE 4. HYDROGEN POWERED TRACTOR MARKET SIZE, FOR RETROFIT, BY REGION, 2025-2035 ($MILLION)
    TABLE 5. HYDROGEN POWERED TRACTOR MARKET FOR RETROFIT BY COUNTRY, 2025-2035 ($MILLION)
    TABLE 6. GLOBAL HYDROGEN POWERED TRACTOR MARKET, BY PRODUCT, 2025-2035 ($MILLION)
    TABLE 7. HYDROGEN POWERED TRACTOR MARKET SIZE, FOR PROTON EXCHANGE MEMBRANE FUEL CELL, BY REGION, 2025-2035 ($MILLION)
    TABLE 8. HYDROGEN POWERED TRACTOR MARKET FOR PROTON EXCHANGE MEMBRANE FUEL CELL BY COUNTRY, 2025-2035 ($MILLION)
    TABLE 9. HYDROGEN POWERED TRACTOR MARKET SIZE, FOR PHOSPHORIC ACID FUEL CELL, BY REGION, 2025-2035 ($MILLION)
    TABLE 10. HYDROGEN POWERED TRACTOR MARKET FOR PHOSPHORIC ACID FUEL CELL BY COUNTRY, 2025-2035 ($MILLION)
    TABLE 11. HYDROGEN POWERED TRACTOR MARKET SIZE, FOR SOLID OXIDE FUEL CELL, BY REGION, 2025-2035 ($MILLION)
    TABLE 12. HYDROGEN POWERED TRACTOR MARKET FOR SOLID OXIDE FUEL CELL BY COUNTRY, 2025-2035 ($MILLION)
    TABLE 13. HYDROGEN POWERED TRACTOR MARKET SIZE, FOR OTHERS, BY REGION, 2025-2035 ($MILLION)
    TABLE 14. HYDROGEN POWERED TRACTOR MARKET FOR OTHERS BY COUNTRY, 2025-2035 ($MILLION)
    TABLE 15. GLOBAL HYDROGEN POWERED TRACTOR MARKET, BY APPLICATION, 2025-2035 ($MILLION)
    TABLE 16. HYDROGEN POWERED TRACTOR MARKET SIZE, FOR AGRICULTURE, BY REGION, 2025-2035 ($MILLION)
    TABLE 17. HYDROGEN POWERED TRACTOR MARKET FOR AGRICULTURE BY COUNTRY, 2025-2035 ($MILLION)
    TABLE 18. HYDROGEN POWERED TRACTOR MARKET SIZE, FOR INDUSTRIES, BY REGION, 2025-2035 ($MILLION)
    TABLE 19. HYDROGEN POWERED TRACTOR MARKET FOR INDUSTRIES BY COUNTRY, 2025-2035 ($MILLION)
    TABLE 20. HYDROGEN POWERED TRACTOR MARKET SIZE, FOR MINING, BY REGION, 2025-2035 ($MILLION)
    TABLE 21. HYDROGEN POWERED TRACTOR MARKET FOR MINING BY COUNTRY, 2025-2035 ($MILLION)
    TABLE 22. HYDROGEN POWERED TRACTOR MARKET SIZE, FOR OTHERS, BY REGION, 2025-2035 ($MILLION)
    TABLE 23. HYDROGEN POWERED TRACTOR MARKET FOR OTHERS BY COUNTRY, 2025-2035 ($MILLION)
    TABLE 24. GLOBAL HYDROGEN POWERED TRACTOR MARKET, BY CAPACITY, 2025-2035 ($MILLION)
    TABLE 25. HYDROGEN POWERED TRACTOR MARKET SIZE, FOR LESS THAN 25 TONNES, BY REGION, 2025-2035 ($MILLION)
    TABLE 26. HYDROGEN POWERED TRACTOR MARKET FOR LESS THAN 25 TONNES BY COUNTRY, 2025-2035 ($MILLION)
    TABLE 27. HYDROGEN POWERED TRACTOR MARKET SIZE, FOR MORE THAN 25 TONNES, BY REGION, 2025-2035 ($MILLION)
    TABLE 28. HYDROGEN POWERED TRACTOR MARKET FOR MORE THAN 25 TONNES BY COUNTRY, 2025-2035 ($MILLION)
    TABLE 29. HYDROGEN POWERED TRACTOR MARKET, BY REGION, 2025-2035 ($MILLION)
    TABLE 30. NORTH AMERICA HYDROGEN POWERED TRACTOR MARKET, BY INSTALLATION, 2025-2035 ($MILLION)
    TABLE 31. NORTH AMERICA HYDROGEN POWERED TRACTOR MARKET, BY PRODUCT, 2025-2035 ($MILLION)
    TABLE 32. NORTH AMERICA HYDROGEN POWERED TRACTOR MARKET, BY APPLICATION, 2025-2035 ($MILLION)
    TABLE 33. NORTH AMERICA HYDROGEN POWERED TRACTOR MARKET, BY CAPACITY, 2025-2035 ($MILLION)
    TABLE 34. NORTH AMERICA HYDROGEN POWERED TRACTOR MARKET, BY COUNTRY, 2025-2035 ($MILLION)
    TABLE 35. U.S. HYDROGEN POWERED TRACTOR MARKET, BY INSTALLATION, 2025-2035 ($MILLION)
    TABLE 36. U.S. HYDROGEN POWERED TRACTOR MARKET, BY PRODUCT, 2025-2035 ($MILLION)
    TABLE 37. U.S. HYDROGEN POWERED TRACTOR MARKET, BY APPLICATION, 2025-2035 ($MILLION)
    TABLE 38. U.S. HYDROGEN POWERED TRACTOR MARKET, BY CAPACITY, 2025-2035 ($MILLION)
    TABLE 39. CANADA HYDROGEN POWERED TRACTOR MARKET, BY INSTALLATION, 2025-2035 ($MILLION)
    TABLE 40. CANADA HYDROGEN POWERED TRACTOR MARKET, BY PRODUCT, 2025-2035 ($MILLION)
    TABLE 41. CANADA HYDROGEN POWERED TRACTOR MARKET, BY APPLICATION, 2025-2035 ($MILLION)
    TABLE 42. CANADA HYDROGEN POWERED TRACTOR MARKET, BY CAPACITY, 2025-2035 ($MILLION)
    TABLE 43. MEXICO HYDROGEN POWERED TRACTOR MARKET, BY INSTALLATION, 2025-2035 ($MILLION)
    TABLE 44. MEXICO HYDROGEN POWERED TRACTOR MARKET, BY PRODUCT, 2025-2035 ($MILLION)
    TABLE 45. MEXICO HYDROGEN POWERED TRACTOR MARKET, BY APPLICATION, 2025-2035 ($MILLION)
    TABLE 46. MEXICO HYDROGEN POWERED TRACTOR MARKET, BY CAPACITY, 2025-2035 ($MILLION)
    TABLE 47. EUROPE HYDROGEN POWERED TRACTOR MARKET, BY INSTALLATION, 2025-2035 ($MILLION)
    TABLE 48. EUROPE HYDROGEN POWERED TRACTOR MARKET, BY PRODUCT, 2025-2035 ($MILLION)
    TABLE 49. EUROPE HYDROGEN POWERED TRACTOR MARKET, BY APPLICATION, 2025-2035 ($MILLION)
    TABLE 50. EUROPE HYDROGEN POWERED TRACTOR MARKET, BY CAPACITY, 2025-2035 ($MILLION)
    TABLE 51. EUROPE HYDROGEN POWERED TRACTOR MARKET, BY COUNTRY, 2025-2035 ($MILLION)
    TABLE 52. GERMANY HYDROGEN POWERED TRACTOR MARKET, BY INSTALLATION, 2025-2035 ($MILLION)
    TABLE 53. GERMANY HYDROGEN POWERED TRACTOR MARKET, BY PRODUCT, 2025-2035 ($MILLION)
    TABLE 54. GERMANY HYDROGEN POWERED TRACTOR MARKET, BY APPLICATION, 2025-2035 ($MILLION)
    TABLE 55. GERMANY HYDROGEN POWERED TRACTOR MARKET, BY CAPACITY, 2025-2035 ($MILLION)
    TABLE 56. FRANCE HYDROGEN POWERED TRACTOR MARKET, BY INSTALLATION, 2025-2035 ($MILLION)
    TABLE 57. FRANCE HYDROGEN POWERED TRACTOR MARKET, BY PRODUCT, 2025-2035 ($MILLION)
    TABLE 58. FRANCE HYDROGEN POWERED TRACTOR MARKET, BY APPLICATION, 2025-2035 ($MILLION)
    TABLE 59. FRANCE HYDROGEN POWERED TRACTOR MARKET, BY CAPACITY, 2025-2035 ($MILLION)
    TABLE 60. NETHERLANDS HYDROGEN POWERED TRACTOR MARKET, BY INSTALLATION, 2025-2035 ($MILLION)
    TABLE 61. NETHERLANDS HYDROGEN POWERED TRACTOR MARKET, BY PRODUCT, 2025-2035 ($MILLION)
    TABLE 62. NETHERLANDS HYDROGEN POWERED TRACTOR MARKET, BY APPLICATION, 2025-2035 ($MILLION)
    TABLE 63. NETHERLANDS HYDROGEN POWERED TRACTOR MARKET, BY CAPACITY, 2025-2035 ($MILLION)
    TABLE 64. U.K. HYDROGEN POWERED TRACTOR MARKET, BY INSTALLATION, 2025-2035 ($MILLION)
    TABLE 65. U.K. HYDROGEN POWERED TRACTOR MARKET, BY PRODUCT, 2025-2035 ($MILLION)
    TABLE 66. U.K. HYDROGEN POWERED TRACTOR MARKET, BY APPLICATION, 2025-2035 ($MILLION)
    TABLE 67. U.K. HYDROGEN POWERED TRACTOR MARKET, BY CAPACITY, 2025-2035 ($MILLION)
    TABLE 68. POLAND HYDROGEN POWERED TRACTOR MARKET, BY INSTALLATION, 2025-2035 ($MILLION)
    TABLE 69. POLAND HYDROGEN POWERED TRACTOR MARKET, BY PRODUCT, 2025-2035 ($MILLION)
    TABLE 70. POLAND HYDROGEN POWERED TRACTOR MARKET, BY APPLICATION, 2025-2035 ($MILLION)
    TABLE 71. POLAND HYDROGEN POWERED TRACTOR MARKET, BY CAPACITY, 2025-2035 ($MILLION)
    TABLE 72. SPAIN HYDROGEN POWERED TRACTOR MARKET, BY INSTALLATION, 2025-2035 ($MILLION)
    TABLE 73. SPAIN HYDROGEN POWERED TRACTOR MARKET, BY PRODUCT, 2025-2035 ($MILLION)
    TABLE 74. SPAIN HYDROGEN POWERED TRACTOR MARKET, BY APPLICATION, 2025-2035 ($MILLION)
    TABLE 75. SPAIN HYDROGEN POWERED TRACTOR MARKET, BY CAPACITY, 2025-2035 ($MILLION)
    TABLE 76. RUSSIA HYDROGEN POWERED TRACTOR MARKET, BY INSTALLATION, 2025-2035 ($MILLION)
    TABLE 77. RUSSIA HYDROGEN POWERED TRACTOR MARKET, BY PRODUCT, 2025-2035 ($MILLION)
    TABLE 78. RUSSIA HYDROGEN POWERED TRACTOR MARKET, BY APPLICATION, 2025-2035 ($MILLION)
    TABLE 79. RUSSIA HYDROGEN POWERED TRACTOR MARKET, BY CAPACITY, 2025-2035 ($MILLION)
    TABLE 80. REST OF EUROPE HYDROGEN POWERED TRACTOR MARKET, BY INSTALLATION, 2025-2035 ($MILLION)
    TABLE 81. REST OF EUROPE HYDROGEN POWERED TRACTOR MARKET, BY PRODUCT, 2025-2035 ($MILLION)
    TABLE 82. REST OF EUROPE HYDROGEN POWERED TRACTOR MARKET, BY APPLICATION, 2025-2035 ($MILLION)
    TABLE 83. REST OF EUROPE HYDROGEN POWERED TRACTOR MARKET, BY CAPACITY, 2025-2035 ($MILLION)
    TABLE 84. ASIA-PACIFIC HYDROGEN POWERED TRACTOR MARKET, BY INSTALLATION, 2025-2035 ($MILLION)
    TABLE 85. ASIA-PACIFIC HYDROGEN POWERED TRACTOR MARKET, BY PRODUCT, 2025-2035 ($MILLION)
    TABLE 86. ASIA-PACIFIC HYDROGEN POWERED TRACTOR MARKET, BY APPLICATION, 2025-2035 ($MILLION)
    TABLE 87. ASIA-PACIFIC HYDROGEN POWERED TRACTOR MARKET, BY CAPACITY, 2025-2035 ($MILLION)
    TABLE 88. ASIA-PACIFIC HYDROGEN POWERED TRACTOR MARKET, BY COUNTRY, 2025-2035 ($MILLION)
    TABLE 89. CHINA HYDROGEN POWERED TRACTOR MARKET, BY INSTALLATION, 2025-2035 ($MILLION)
    TABLE 90. CHINA HYDROGEN POWERED TRACTOR MARKET, BY PRODUCT, 2025-2035 ($MILLION)
    TABLE 91. CHINA HYDROGEN POWERED TRACTOR MARKET, BY APPLICATION, 2025-2035 ($MILLION)
    TABLE 92. CHINA HYDROGEN POWERED TRACTOR MARKET, BY CAPACITY, 2025-2035 ($MILLION)
    TABLE 93. INDIA HYDROGEN POWERED TRACTOR MARKET, BY INSTALLATION, 2025-2035 ($MILLION)
    TABLE 94. INDIA HYDROGEN POWERED TRACTOR MARKET, BY PRODUCT, 2025-2035 ($MILLION)
    TABLE 95. INDIA HYDROGEN POWERED TRACTOR MARKET, BY APPLICATION, 2025-2035 ($MILLION)
    TABLE 96. INDIA HYDROGEN POWERED TRACTOR MARKET, BY CAPACITY, 2025-2035 ($MILLION)
    TABLE 97. JAPAN HYDROGEN POWERED TRACTOR MARKET, BY INSTALLATION, 2025-2035 ($MILLION)
    TABLE 98. JAPAN HYDROGEN POWERED TRACTOR MARKET, BY PRODUCT, 2025-2035 ($MILLION)
    TABLE 99. JAPAN HYDROGEN POWERED TRACTOR MARKET, BY APPLICATION, 2025-2035 ($MILLION)
    TABLE 100. JAPAN HYDROGEN POWERED TRACTOR MARKET, BY CAPACITY, 2025-2035 ($MILLION)
    TABLE 101. SOUTH KOREA HYDROGEN POWERED TRACTOR MARKET, BY INSTALLATION, 2025-2035 ($MILLION)
    TABLE 102. SOUTH KOREA HYDROGEN POWERED TRACTOR MARKET, BY PRODUCT, 2025-2035 ($MILLION)
    TABLE 103. SOUTH KOREA HYDROGEN POWERED TRACTOR MARKET, BY APPLICATION, 2025-2035 ($MILLION)
    TABLE 104. SOUTH KOREA HYDROGEN POWERED TRACTOR MARKET, BY CAPACITY, 2025-2035 ($MILLION)
    TABLE 105. ASEAN HYDROGEN POWERED TRACTOR MARKET, BY INSTALLATION, 2025-2035 ($MILLION)
    TABLE 106. ASEAN HYDROGEN POWERED TRACTOR MARKET, BY PRODUCT, 2025-2035 ($MILLION)
    TABLE 107. ASEAN HYDROGEN POWERED TRACTOR MARKET, BY APPLICATION, 2025-2035 ($MILLION)
    TABLE 108. ASEAN HYDROGEN POWERED TRACTOR MARKET, BY CAPACITY, 2025-2035 ($MILLION)
    TABLE 109. REST OF ASIA-PACIFIC HYDROGEN POWERED TRACTOR MARKET, BY INSTALLATION, 2025-2035 ($MILLION)
    TABLE 110. REST OF ASIA-PACIFIC HYDROGEN POWERED TRACTOR MARKET, BY PRODUCT, 2025-2035 ($MILLION)
    TABLE 111. REST OF ASIA-PACIFIC HYDROGEN POWERED TRACTOR MARKET, BY APPLICATION, 2025-2035 ($MILLION)
    TABLE 112. REST OF ASIA-PACIFIC HYDROGEN POWERED TRACTOR MARKET, BY CAPACITY, 2025-2035 ($MILLION)
    TABLE 113. LAMEA HYDROGEN POWERED TRACTOR MARKET, BY INSTALLATION, 2025-2035 ($MILLION)
    TABLE 114. LAMEA HYDROGEN POWERED TRACTOR MARKET, BY PRODUCT, 2025-2035 ($MILLION)
    TABLE 115. LAMEA HYDROGEN POWERED TRACTOR MARKET, BY APPLICATION, 2025-2035 ($MILLION)
    TABLE 116. LAMEA HYDROGEN POWERED TRACTOR MARKET, BY CAPACITY, 2025-2035 ($MILLION)
    TABLE 117. LAMEA HYDROGEN POWERED TRACTOR MARKET, BY COUNTRY, 2025-2035 ($MILLION)
    TABLE 118. BRAZIL HYDROGEN POWERED TRACTOR MARKET, BY INSTALLATION, 2025-2035 ($MILLION)
    TABLE 119. BRAZIL HYDROGEN POWERED TRACTOR MARKET, BY PRODUCT, 2025-2035 ($MILLION)
    TABLE 120. BRAZIL HYDROGEN POWERED TRACTOR MARKET, BY APPLICATION, 2025-2035 ($MILLION)
    TABLE 121. BRAZIL HYDROGEN POWERED TRACTOR MARKET, BY CAPACITY, 2025-2035 ($MILLION)
    TABLE 122. UAE HYDROGEN POWERED TRACTOR MARKET, BY INSTALLATION, 2025-2035 ($MILLION)
    TABLE 123. UAE HYDROGEN POWERED TRACTOR MARKET, BY PRODUCT, 2025-2035 ($MILLION)
    TABLE 124. UAE HYDROGEN POWERED TRACTOR MARKET, BY APPLICATION, 2025-2035 ($MILLION)
    TABLE 125. UAE HYDROGEN POWERED TRACTOR MARKET, BY CAPACITY, 2025-2035 ($MILLION)
    TABLE 126. SAUDI ARABIA HYDROGEN POWERED TRACTOR MARKET, BY INSTALLATION, 2025-2035 ($MILLION)
    TABLE 127. SAUDI ARABIA HYDROGEN POWERED TRACTOR MARKET, BY PRODUCT, 2025-2035 ($MILLION)
    TABLE 128. SAUDI ARABIA HYDROGEN POWERED TRACTOR MARKET, BY APPLICATION, 2025-2035 ($MILLION)
    TABLE 129. SAUDI ARABIA HYDROGEN POWERED TRACTOR MARKET, BY CAPACITY, 2025-2035 ($MILLION)
    TABLE 130. SOUTH AFRICA HYDROGEN POWERED TRACTOR MARKET, BY INSTALLATION, 2025-2035 ($MILLION)
    TABLE 131. SOUTH AFRICA HYDROGEN POWERED TRACTOR MARKET, BY PRODUCT, 2025-2035 ($MILLION)
    TABLE 132. SOUTH AFRICA HYDROGEN POWERED TRACTOR MARKET, BY APPLICATION, 2025-2035 ($MILLION)
    TABLE 133. SOUTH AFRICA HYDROGEN POWERED TRACTOR MARKET, BY CAPACITY, 2025-2035 ($MILLION)
    TABLE 134. REST OF LAMEA HYDROGEN POWERED TRACTOR MARKET, BY INSTALLATION, 2025-2035 ($MILLION)
    TABLE 135. REST OF LAMEA HYDROGEN POWERED TRACTOR MARKET, BY PRODUCT, 2025-2035 ($MILLION)
    TABLE 136. REST OF LAMEA HYDROGEN POWERED TRACTOR MARKET, BY APPLICATION, 2025-2035 ($MILLION)
    TABLE 137. REST OF LAMEA HYDROGEN POWERED TRACTOR MARKET, BY CAPACITY, 2025-2035 ($MILLION)
    TABLE 138.ALLIS CHALMERS: COMPANY SNAPSHOT
    TABLE 139.ALLIS CHALMERS: OPERATING SEGMENTS
    TABLE 140.ALLIS CHALMERS: PRODUCT PORTFOLIO
    TABLE 141.ALLIS CHALMERS: NET SALES,
    TABLE 142.ALLIS CHALMERS: KEY STRATERGIES
    TABLE 143.AMOGY, INC: COMPANY SNAPSHOT
    TABLE 144.AMOGY, INC: OPERATING SEGMENTS
    TABLE 145.AMOGY, INC: PRODUCT PORTFOLIO
    TABLE 146.AMOGY, INC: NET SALES,
    TABLE 147.AMOGY, INC: KEY STRATERGIES
    TABLE 148.BALLARD POWER SYSTEMS: COMPANY SNAPSHOT
    TABLE 149.BALLARD POWER SYSTEMS: OPERATING SEGMENTS
    TABLE 150.BALLARD POWER SYSTEMS: PRODUCT PORTFOLIO
    TABLE 151.BALLARD POWER SYSTEMS: NET SALES,
    TABLE 152.BALLARD POWER SYSTEMS: KEY STRATERGIES
    TABLE 153.BLUE FUEL SOLUTIONS: COMPANY SNAPSHOT
    TABLE 154.BLUE FUEL SOLUTIONS: OPERATING SEGMENTS
    TABLE 155.BLUE FUEL SOLUTIONS: PRODUCT PORTFOLIO
    TABLE 156.BLUE FUEL SOLUTIONS: NET SALES,
    TABLE 157.BLUE FUEL SOLUTIONS: KEY STRATERGIES
    TABLE 158.BMW: COMPANY SNAPSHOT
    TABLE 159.BMW: OPERATING SEGMENTS
    TABLE 160.BMW: PRODUCT PORTFOLIO
    TABLE 161.BMW: NET SALES,
    TABLE 162.BMW: KEY STRATERGIES
    TABLE 163.CNH INDUSTRIAL N.V.: COMPANY SNAPSHOT
    TABLE 164.CNH INDUSTRIAL N.V.: OPERATING SEGMENTS
    TABLE 165.CNH INDUSTRIAL N.V.: PRODUCT PORTFOLIO
    TABLE 166.CNH INDUSTRIAL N.V.: NET SALES,
    TABLE 167.CNH INDUSTRIAL N.V.: KEY STRATERGIES
    TABLE 168.CUMMINS INC.: COMPANY SNAPSHOT
    TABLE 169.CUMMINS INC.: OPERATING SEGMENTS
    TABLE 170.CUMMINS INC.: PRODUCT PORTFOLIO
    TABLE 171.CUMMINS INC.: NET SALES,
    TABLE 172.CUMMINS INC.: KEY STRATERGIES
    TABLE 173.DEERE COMPANY: COMPANY SNAPSHOT
    TABLE 174.DEERE COMPANY: OPERATING SEGMENTS
    TABLE 175.DEERE COMPANY: PRODUCT PORTFOLIO
    TABLE 176.DEERE COMPANY: NET SALES,
    TABLE 177.DEERE COMPANY: KEY STRATERGIES
    TABLE 178.DEUTZ FAHR GROUP: COMPANY SNAPSHOT
    TABLE 179.DEUTZ FAHR GROUP: OPERATING SEGMENTS
    TABLE 180.DEUTZ FAHR GROUP: PRODUCT PORTFOLIO
    TABLE 181.DEUTZ FAHR GROUP: NET SALES,
    TABLE 182.DEUTZ FAHR GROUP: KEY STRATERGIES
    TABLE 183.FENDT: COMPANY SNAPSHOT
    TABLE 184.FENDT: OPERATING SEGMENTS
    TABLE 185.FENDT: PRODUCT PORTFOLIO
    TABLE 186.FENDT: NET SALES,
    TABLE 187.FENDT: KEY STRATERGIES
    TABLE 188.H2TRAC B.V.: COMPANY SNAPSHOT
    TABLE 189.H2TRAC B.V.: OPERATING SEGMENTS
    TABLE 190.H2TRAC B.V.: PRODUCT PORTFOLIO
    TABLE 191.H2TRAC B.V.: NET SALES,
    TABLE 192.H2TRAC B.V.: KEY STRATERGIES
    TABLE 193.HYSTER YALE GROUP: COMPANY SNAPSHOT
    TABLE 194.HYSTER YALE GROUP: OPERATING SEGMENTS
    TABLE 195.HYSTER YALE GROUP: PRODUCT PORTFOLIO
    TABLE 196.HYSTER YALE GROUP: NET SALES,
    TABLE 197.HYSTER YALE GROUP: KEY STRATERGIES
    TABLE 198.HYUNDAI MOTOR COMPANY: COMPANY SNAPSHOT
    TABLE 199.HYUNDAI MOTOR COMPANY: OPERATING SEGMENTS
    TABLE 200.HYUNDAI MOTOR COMPANY: PRODUCT PORTFOLIO
    TABLE 201.HYUNDAI MOTOR COMPANY: NET SALES,
    TABLE 202.HYUNDAI MOTOR COMPANY: KEY STRATERGIES
    TABLE 203.KUBOTA CORPORATION: COMPANY SNAPSHOT
    TABLE 204.KUBOTA CORPORATION: OPERATING SEGMENTS
    TABLE 205.KUBOTA CORPORATION: PRODUCT PORTFOLIO
    TABLE 206.KUBOTA CORPORATION: NET SALES,
    TABLE 207.KUBOTA CORPORATION: KEY STRATERGIES
    TABLE 208.NEW HOLLAND: COMPANY SNAPSHOT
    TABLE 209.NEW HOLLAND: OPERATING SEGMENTS
    TABLE 210.NEW HOLLAND: PRODUCT PORTFOLIO
    TABLE 211.NEW HOLLAND: NET SALES,
    TABLE 212.NEW HOLLAND: KEY STRATERGIES
    TABLE 213.TERBERG: COMPANY SNAPSHOT
    TABLE 214.TERBERG: OPERATING SEGMENTS
    TABLE 215.TERBERG: PRODUCT PORTFOLIO
    TABLE 216.TERBERG: NET SALES,
    TABLE 217.TERBERG: KEY STRATERGIES
    TABLE 218.TOYOTA: COMPANY SNAPSHOT
    TABLE 219.TOYOTA: OPERATING SEGMENTS
    TABLE 220.TOYOTA: PRODUCT PORTFOLIO
    TABLE 221.TOYOTA: NET SALES,
    TABLE 222.TOYOTA: KEY STRATERGIES
  • LIST OF FIGURES

  • FIGURE 1.HYDROGEN POWERED TRACTOR MARKET SEGMENTATION
    FIGURE 2.HYDROGEN POWERED TRACTOR MARKET,2025-2035
    FIGURE 3.HYDROGEN POWERED TRACTOR MARKET,2025-2035
    FIGURE 4. TOP INVESTMENT POCKETS, BY REGION
    FIGURE 5.PORTER FIVE-1
    FIGURE 6.PORTER FIVE-2
    FIGURE 7.PORTER FIVE-3
    FIGURE 8.PORTER FIVE-4
    FIGURE 9.PORTER FIVE-5
    FIGURE 10.TOP PLAYER POSITIONING
    FIGURE 11.HYDROGEN POWERED TRACTOR MARKET:DRIVERS, RESTRAINTS AND OPPORTUNITIES
    FIGURE 12.HYDROGEN POWERED TRACTOR MARKET,BY INSTALLATION,2025(%)
    FIGURE 13.COMPARATIVE SHARE ANALYSIS OF OEM HYDROGEN POWERED TRACTOR MARKET,2025-2035(%)
    FIGURE 14.COMPARATIVE SHARE ANALYSIS OF RETROFIT HYDROGEN POWERED TRACTOR MARKET,2025-2035(%)
    FIGURE 15.HYDROGEN POWERED TRACTOR MARKET,BY PRODUCT,2025(%)
    FIGURE 16.COMPARATIVE SHARE ANALYSIS OF PROTON EXCHANGE MEMBRANE FUEL CELL HYDROGEN POWERED TRACTOR MARKET,2025-2035(%)
    FIGURE 17.COMPARATIVE SHARE ANALYSIS OF PHOSPHORIC ACID FUEL CELL HYDROGEN POWERED TRACTOR MARKET,2025-2035(%)
    FIGURE 18.COMPARATIVE SHARE ANALYSIS OF SOLID OXIDE FUEL CELL HYDROGEN POWERED TRACTOR MARKET,2025-2035(%)
    FIGURE 19.COMPARATIVE SHARE ANALYSIS OF OTHERS HYDROGEN POWERED TRACTOR MARKET,2025-2035(%)
    FIGURE 20.HYDROGEN POWERED TRACTOR MARKET,BY APPLICATION,2025(%)
    FIGURE 21.COMPARATIVE SHARE ANALYSIS OF AGRICULTURE HYDROGEN POWERED TRACTOR MARKET,2025-2035(%)
    FIGURE 22.COMPARATIVE SHARE ANALYSIS OF INDUSTRIES HYDROGEN POWERED TRACTOR MARKET,2025-2035(%)
    FIGURE 23.COMPARATIVE SHARE ANALYSIS OF MINING HYDROGEN POWERED TRACTOR MARKET,2025-2035(%)
    FIGURE 24.COMPARATIVE SHARE ANALYSIS OF OTHERS HYDROGEN POWERED TRACTOR MARKET,2025-2035(%)
    FIGURE 25.HYDROGEN POWERED TRACTOR MARKET,BY CAPACITY,2025(%)
    FIGURE 26.COMPARATIVE SHARE ANALYSIS OF LESS THAN 25 TONNES HYDROGEN POWERED TRACTOR MARKET,2025-2035(%)
    FIGURE 27.COMPARATIVE SHARE ANALYSIS OF MORE THAN 25 TONNES HYDROGEN POWERED TRACTOR MARKET,2025-2035(%)
    FIGURE 28.HYDROGEN POWERED TRACTOR MARKET BY REGION,2025
    FIGURE 29.U.S. HYDROGEN POWERED TRACTOR MARKET,2025-2035($MILLION)
    FIGURE 30.CANADA HYDROGEN POWERED TRACTOR MARKET,2025-2035($MILLION)
    FIGURE 31.MEXICO HYDROGEN POWERED TRACTOR MARKET,2025-2035($MILLION)
    FIGURE 32.GERMANY HYDROGEN POWERED TRACTOR MARKET,2025-2035($MILLION)
    FIGURE 33.FRANCE HYDROGEN POWERED TRACTOR MARKET,2025-2035($MILLION)
    FIGURE 34.NETHERLANDS HYDROGEN POWERED TRACTOR MARKET,2025-2035($MILLION)
    FIGURE 35.U.K. HYDROGEN POWERED TRACTOR MARKET,2025-2035($MILLION)
    FIGURE 36.POLAND HYDROGEN POWERED TRACTOR MARKET,2025-2035($MILLION)
    FIGURE 37.SPAIN HYDROGEN POWERED TRACTOR MARKET,2025-2035($MILLION)
    FIGURE 38.RUSSIA HYDROGEN POWERED TRACTOR MARKET,2025-2035($MILLION)
    FIGURE 39.REST OF EUROPE HYDROGEN POWERED TRACTOR MARKET,2025-2035($MILLION)
    FIGURE 40.CHINA HYDROGEN POWERED TRACTOR MARKET,2025-2035($MILLION)
    FIGURE 41.INDIA HYDROGEN POWERED TRACTOR MARKET,2025-2035($MILLION)
    FIGURE 42.JAPAN HYDROGEN POWERED TRACTOR MARKET,2025-2035($MILLION)
    FIGURE 43.SOUTH KOREA HYDROGEN POWERED TRACTOR MARKET,2025-2035($MILLION)
    FIGURE 44.ASEAN HYDROGEN POWERED TRACTOR MARKET,2025-2035($MILLION)
    FIGURE 45.REST OF ASIA-PACIFIC HYDROGEN POWERED TRACTOR MARKET,2025-2035($MILLION)
    FIGURE 46.BRAZIL HYDROGEN POWERED TRACTOR MARKET,2025-2035($MILLION)
    FIGURE 47.UAE HYDROGEN POWERED TRACTOR MARKET,2025-2035($MILLION)
    FIGURE 48.SAUDI ARABIA HYDROGEN POWERED TRACTOR MARKET,2025-2035($MILLION)
    FIGURE 49.SOUTH AFRICA HYDROGEN POWERED TRACTOR MARKET,2025-2035($MILLION)
    FIGURE 50.REST OF LAMEA HYDROGEN POWERED TRACTOR MARKET,2025-2035($MILLION)
    FIGURE 51. TOP WINNING STRATEGIES, BY YEAR
    FIGURE 52. TOP WINNING STRATEGIES, BY DEVELOPMENT
    FIGURE 53. TOP WINNING STRATEGIES, BY COMPANY
    FIGURE 54.PRODUCT MAPPING OF TOP 10 PLAYERS
    FIGURE 55.COMPETITIVE DASHBOARD
    FIGURE 56.COMPETITIVE HEATMAP OF TOP 10 KEY PLAYERS
    FIGURE 57.ALLIS CHALMERS.: NET SALES ,($MILLION)
    FIGURE 58.AMOGY, INC.: NET SALES ,($MILLION)
    FIGURE 59.BALLARD POWER SYSTEMS.: NET SALES ,($MILLION)
    FIGURE 60.BLUE FUEL SOLUTIONS.: NET SALES ,($MILLION)
    FIGURE 61.BMW.: NET SALES ,($MILLION)
    FIGURE 62.CNH INDUSTRIAL N.V..: NET SALES ,($MILLION)
    FIGURE 63.CUMMINS INC..: NET SALES ,($MILLION)
    FIGURE 64.DEERE COMPANY.: NET SALES ,($MILLION)
    FIGURE 65.DEUTZ FAHR GROUP.: NET SALES ,($MILLION)
    FIGURE 66.FENDT.: NET SALES ,($MILLION)
    FIGURE 67.H2TRAC B.V..: NET SALES ,($MILLION)
    FIGURE 68.HYSTER YALE GROUP.: NET SALES ,($MILLION)
    FIGURE 69.HYUNDAI MOTOR COMPANY.: NET SALES ,($MILLION)
    FIGURE 70.KUBOTA CORPORATION.: NET SALES ,($MILLION)
    FIGURE 71.NEW HOLLAND.: NET SALES ,($MILLION)
    FIGURE 72.TERBERG.: NET SALES ,($MILLION)
    FIGURE 73.TOYOTA.: NET SALES ,($MILLION)


The hydrogen powered tractor market is expected to witness significant growth, owing to rise in demand to reduce greenhouse gas (GHG) emissions across the globe. Moreover, the hydrogen powered tractor market is supplemented by developments carried out by different companies such as Blue Fuel Solutions, New Holland, Ballard Power Systems, and others. These companies have heftily invested in hydrogen powered tractor technology as well as have carried out collaborations and partnerships with different companies; thus, boosting the market growth.

Factors such as rise in mechanization in agriculture activities, high suitability of hydrogen as fuel, and reduced greenhouse gas emissions are anticipated to boost growth of the global hydrogen powered tractor market during the forecast period. However, high costs associated with production and handling of hydrogen and lack of awareness about efficient agriculture tractor among farmers are expected to hinder growth of the global hydrogen powered tractor market during the forecast period. Moreover, technological advancements and future potential in the hydrogen fuel cell vehicle market and government support for development of agricultural activities is expected to create opportunities for the hydrogen powered tractor market in the future.

Changing demand scenarios have led market participants to concentrate on product launch and product developments to offer a diverse range of products and meet new business opportunities. For instance, in February 2022, Fendt presented development of a prototype hydrogen-powered tractor with fuel cells. Moreover, in October 2020, Terberg Special Vehicles developed and started extensive testing of its first concept hydrogen-powered terminal tractor. The tractor was developed in collaboration with zepp solutions. In addition, market participants are continuously focusing on acquisition efforts to match changing end-user requirements. For instance, in November 2021, Ballard Power Systems, a world leader in design and manufacturing of PEM fuel cell engines acquired the Arcola Energy, an UK-based systems engineering company specializing in hydrogen fuel cell powertrain and vehicle systems integration.

The hydrogen powered tractor market is segmented basis of installation, product, application, capacity, and region. Based on installation, it is divided into OEM and retrofit. Based on product, it is segmented into Proton Exchange Membrane Fuel Cell, Phosphoric Acid Fuel Cell, Solid Oxide Fuel Cell and others. By application, it is divided into agriculture, industries, mining and others. By capacity, the market is divided into Less Than 25 tons and More Than 25 tons. By region, the market is analyzed across North America, Europe, Asia-Pacific and LAMEA.

Key players that operate in this market include Allis-Chalmers, Amogy, Inc., Ballard Power Systems, Blue Fuel Solutions (CMB.TECH), BMW, CNH Industrial N.V., Cummins Inc., Deere & Company, Fendt, H2Trac B.V., Honda Motor Co., Ltd., Hyster-Yale Group Inc., Hyundai Motor Company, Kubota Corporation, SDF Group, Terberg Special Vehicles, and Toyota Motor Corporation

PURCHASE OPTIONS

Call or Email us

U.S.-Canada Toll-free: +1-800-792-5285
Int'l : +1-503-894-6022
Europe : +44-845-528-1300
Email : help@alliedmarketresearch.com
 
FREQUENTLY ASKED QUESTIONS?

A. The global hydrogen powered tractor market is expected to be valued at $1.57 billion in 2025, and is projected to reach $4.54 billion by 2035.

A. Agriculture is the leading application of Hydrogen Powered Tractor Market

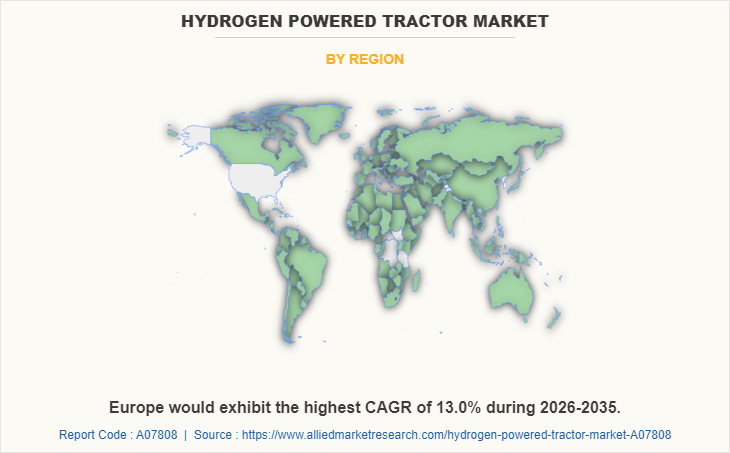
A. Europe is the largest regional market for Hydrogen Powered Tractor

A. Key players that operate in this hydrogen powered tractor market include Allis-Chalmers, Amogy, Inc., Ballard Power Systems, Blue Fuel Solutions (CMB. TECH), BMW, CNH Industrial N.V., Cummins Inc., Deere & Company, Fendt, H2Trac B.V., Honda Motor Co., Ltd., Hyster-Yale Group Inc., Hyundai Motor Company, Kubota Corporation, SDF Group, Terberg Special Vehicles, and Toyota Motor Corporation

A. The report sample for global Hydrogen Powered Tractor market report can be obtained on demand from the website.

Looking for Customization?

 Customization Request

Have a Question?

 Speak with Analyst

Any Confusion?

 Inquire Before Buying

Have a glance of the Report

  Request Sample
RELATED TAGS

Purchase Full Report of
Hydrogen Powered Tractor Market

Start reading instantly.
This Report and over 66,804+ more Reports, Available with Avenue Library. T&C*.

  • Online Only
  • $3,456
  • Online cloud access only
  • Restricted print, copy, paste & download
  • Read only
  • Free industry update
    (Within 180 days)
  • Free report update in next update cycle
    (Jul 2023 - Jul 2024)
  • Data Pack
  • $3,840
  • Restricted to one authorized user
  • One print only
  • Available in
    Excel
  • Free industry update
    (Within 180 days)
  •   Free report update in next update cycle
    (Jul 2023 - Jul 2024)
  • Single User
  • $5,769
  • Restricted to one authorized user
  • One print only
  • Available in
    PDF
  • Free industry update
    (Within 180 days)
  •   Free report update in next update cycle
    (Jul 2023 - Jul 2024)
  • Five Users
  • $6,450
  • Limited to five authorized users
  • Print upto five copies
  • Available in
    PDF
  • Free industry update
    (Within 180 days)
  •   Free report update in next update cycle
    (Jul 2023 - Jul 2024)
  • Enterprise
    License/PDF

  • $10,995
  • Unlimited
    within
    company/enterprise
  • Available in Excel & PDF
  • Free industry update
    (Within 180 days)
  •   Free report update in next update cycle
    (Jul 2023 - Jul 2024)
  • Library
    Membership

  • $999 $ 1,175
    Per User/ Per month/ Billed annually
  • Published Content
    E-access
  • Company Profiles
    E-access
  • Newly Added Content Access
  • 10 PDF
    Downloads
  • 5 Excel Data
    Pack Downloads
  • 250 Company Profiles PDF Downloads
  • Buy Now

*Taxes/Fees, if applicable will be added during checkout. All prices in USD

RELATED REPORTS
 

Why Allied Market Research?


Infallible Methodology

To ensure high-level data integrity, accurate analysis, and impeccable forecasts

Analyst Support

For complete satisfaction

Customization

On-demand customization of scope of the report to exactly meet your needs

TARGETED MARKET VIEW

Targeted market view to provide pertinent information and save time of readers

Get fresh content delivered

Get insights on topics that are crucial for your business. Stay abreast of your interest areas.

Get Industry Data Alerts

Why Allied Market Research?

Infallible Methodology

To ensure high-level data integrity, accurate analysis, and impeccable forecasts

Analyst Support

For complete satisfaction

Customization

On-demand customization of scope of the report to exactly meet your needs

TARGETED MARKET VIEW

Targeted market view to provide pertinent information and save time of readers