0
2021
Insurance Third Party Administrator Market

Insurance Third Party Administrator Market

by Service Type (Claims Management, Policy Management, Commission Management, and Others), End User (Life & Health Insurance [Diseases Insurance and Medical Insurance] and Property & Casualty (P&C) Insurance), and Enterprise Size (Large Enterprises and Small & Medium-sized Enterprises): Global Opportunity Analysis and Industry Forecast, 2021-2030

Report Code: A12542
Jul 2021 | Pages: 321
Tables: 179
Charts: 59
  • Formats*:

  • pdf

    Single User License, Five User
    License & Enterprise User License

  • xls

    Data Pack Excel License

  • ppt

    It comes with the additional cost
    of $2500.00 contact sales.


COVID-19

Pandemic disrupted the entire world and affected many industries.

Get detailed COVID-19 impact analysis on the Insurance Third Party Administrator Market

Request Now !

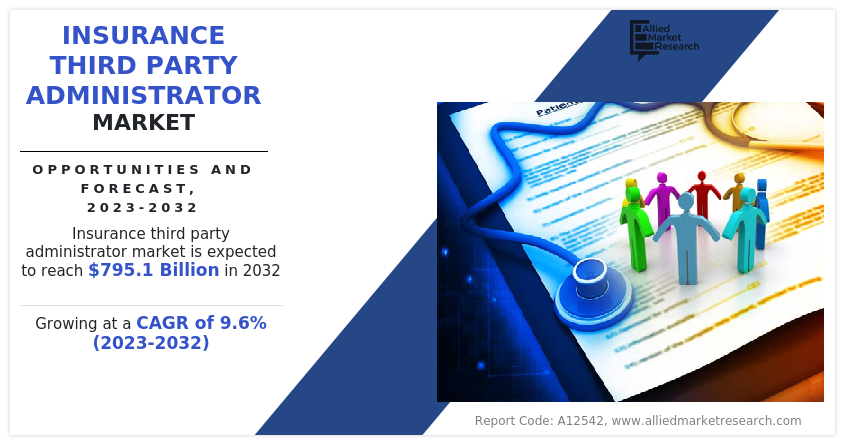
The insurance third party administrator market size was valued at $280.69 billion in 2020, and is projected to reach $514.98 billion by 2030, growing at a CAGR of 6.3% from 2021 to 2030. 

In wake of COVID-19, shutdowns of businesses have disrupted the process for receiving new hardware & upgraded equipment, which has resulted into lower mining operations during the pandemic situation.

Third party administrator is an organization that processes insurance claims for several insurance coverages such as workers compensation, general liability, and others. It is an organization within the insurance industry, which administers other services such as underwriting and customer service. Third party administrators perform outsourcing of administrating the claims process since the TPAs perform the task, which is usually handled by the insurance company or the company itself. 

Global-Insurance-Third-Party-Administrators-Market

Rapid adoption of third party administrators in the health insurance industry and rise in need for operational efficiency & transparency in insurance business process are some of the factors propelling the insurance third party administrator market growth. However, security issues and privacy concerns are the major factors limiting the market growth. On the contrary, technological advancements in third party administrator, such as adoption of Internet of things (IoT), artificial intelligence, machine learning, and robotics process automation, have led to the growth of the insurance third party administrator industry.

Furthermore, artificial intelligence technology has claims administration with predictive outcomes, wherein a low-cost claim can be identified automatically through processing & eliminating the need for claim adjustment intervention. Thus, the demand for insurance third party administrator market is expected to grow tremendously in the coming years.

The report focuses on growth prospects, restraints, and trends of the insurance third party administrator market analysis. The study provides Porter’s five forces analysis to understand the impact of various factors, such as bargaining power of suppliers, competitive intensity of competitors, threat of new entrants, threat of substitutes, and bargaining power of buyers, on the global market.

Segment review

The insurance third party administrator market share is segmented on the basis of service type, end user, enterprise size, and region. By service type, it is divided into claims management, policy management, commission management, and others. By end user, it is bifurcated into life & health insurance and property & casualty (P&C) insurance. By enterprise size, it is divided into large enterprises and small & medium-sized enterprises. By region, it is analyzed across North America, Europe, Asia-Pacific, and LAMEA. 
Insurance Third Party Administrator Market
By End User

Your browser does not support the canvas element.

P&C Insurance is projected as one of the most lucrative segments.

Get more information on this report : Request Sample Pages

The report analyzes the profiles of key players operating in the insurance third party administrator market such as Charles Taylor, CORVEL, CRAWFORD & COMPANY, ESIS, ExlService Holdings, Inc., GALLAGHER BASSETT SERVICES, INC., Helmsman Management Services LLC, Meritain Health, SEDGWICK, and United HealthCare Services, Inc. These players have adopted various strategies to increase their market penetration and strengthen their position in the insurance third party administrator market.   

COVID-19 impact analysis

The outbreak of COVID-19 is anticipated to provide growth opportunities for the Insurance third party administrator market expansion during the forecast period, owing to rise in digital transformation trend in insurance and surge in demand for third party administration solutions that are hosted or managed on the cloud. Moreover, during the pandemic, there is a rising number of claims in health insurance. Therefore, to effectively handle such high number of claims, the insurance companies are heavily investing in third party administrator services. Thus, these factors ensure that insurance companies are considering third party administrators for improving cost efficiency and business operations during the pandemic situation.  

Insurance Third Party Administrator Market
By Enterprise Size

Your browser does not support the canvas element.

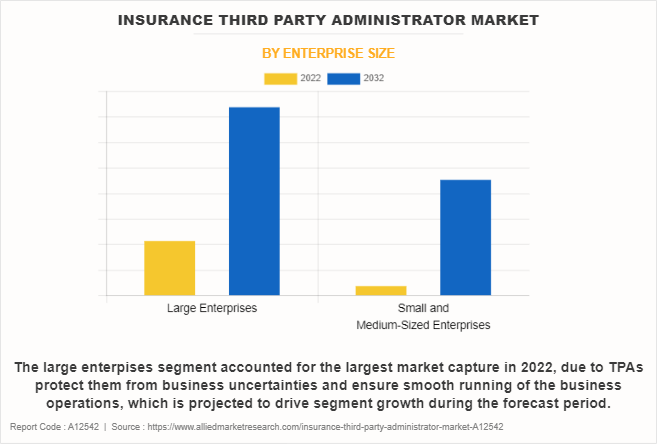
Large Enterprises segment account for the major market share in 2020.

Get more information on this report : Request Sample Pages

Top impacting factors

Rapid adoption of third party administrators in the health insurance industry

A third party administrator plays a vital role in processing of health insurance claims. In the practical world of insurance, some of the jobs of a TPA may refer to the responsibility to speed up the claim process as soon as it is intimated by the insured. Their job is to check all the documents submitted in favor of the claim and settle the claim either on cashless or on a reimbursement basis. In addition, other than the claim processing, TPAs also arrange for other services such as ambulance, well-being programs, and others. These factors have contributed in the rapid adoption of third party administrators in the health insurance industry.

Technological advancement in third party administration services  

Increased adoption of advanced technologies, such as IoT, artificial intelligence, machine learning, and robotics process automation, has led toward the growth of the insurance third party administrator industry. In addition, TPAs leverage these technologies to ensure highly efficient processes that provide outstanding service and reduce cost. Furthermore, by consistently investing in and updating its technology, TPAs embrace customer trends and accommodate new technologies at lower cost to update their own administrative platform. Moreover, technological innovation in the insurance industry has been evolving almost rapidly in recent years, and with the introduction of automated underwriting, increased process automation, and higher levels of customer interaction, the future is expected to accelerate the pace of these advancements. Therefore, to remain competitive, digital TPAs provide a technologically advanced ecosystem in a timely and cost-effective manner to help insurers to effectively handle claims. Therefore, these are the major boosting factors for the insurance third party administrator market.

Insurance Third Party Administrator Market
By Region

2030
North America 
Europe
Asia-Pacific
LAMEA

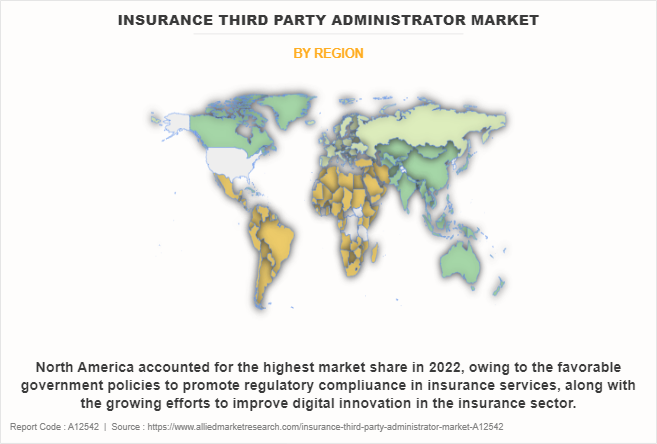
Asia-Pacific is projected as one of the most significant regions.

Get more information on this report : Request Sample Pages

Key benefits for stakeholders 

  • The study provides in-depth analysis of the insurance third party administrator market share along with current & future trends to illustrate the imminent investment pockets.
  • Information about key drivers, restrains, & opportunities and their impact analysis on the insurance third party administrator market size are provided in the report.
  • Porter’s five forces illustrates the potency of buyers and suppliers operating in the insurance third party administrator market growth.
  • An extensive analysis of the key segments of the industry helps to understand the insurance third party administrator market trends.
  • The quantitative analysis of the insurance third party administrator market size from 2021 to 2030 is provided to determine the market potential.

Key market segments

By Service Type

  • Claims Management
  • Policy Management
  • Commission Management
  • Others

By End User

  • Life & Health Insurance
  • Diseases Insurance
  • Medical Insurance
  • Senior Citizens
  • Adult
  • Minors
  • Property & Casualty (P&C) Insurance

By Enterprise Size

  • Large Enterprises 
  • Small & Medium-sized Enterprises 

By Region

  • North America
    • U.S.
    • Canada
  • Europe
    • UK
    • Germany
    • France
    • Italy
    • Spain
    • The Netherlands
    • Rest of Europe 
  • Asia-Pacific 
    • China
    • India
    • Japan
    • Australia
    • South Korea
    • Rest of Asia-Pacific 
  • LAMEA
    • Latin America 
    • Middle East
    • Africa

Key market players

  • Charles Taylor    
  • CORVEL    
  • CRAWFORD & COMPANY    
  • ESIS    
  • ExlService Holdings, Inc.    
  • GALLAGHER BASSETT SERVICES, INC.    
  • Helmsman Management Services LLC    
  • Meritain Health    
  • SEDGWICK    
  • United HealthCare Services, Inc. 

Insurance Third Party Administrator Market Report Highlights

Aspects Details
By Service Type
  • Claims Management
  • Policy Management
  • Commission Management
  • Others
By End User
  • Life & Health Insurance
  • Diseases Insurance
  • Medical Insurance
  • Senior Citizens
  • Adult
  • Minors
  • Property & Casualty (P&C) Insurance
By Enterprise Size
  • Large Enterprises
  • Small & Medium-sized Enterprises
By Region
  • North America  (U.S., Canada, Mexico)
  • Europe  (France, Germany, Italy, Spain, UK, Russia, Rest of Europe)
  • Asia-Pacific  (China, Japan, India, South Korea, Australia, Thailand, Malaysia, Indonesia, Rest of Asia-Pacific)
  • LAMEA  (Brazil, South Africa, Saudi Arabia, UAE, Argentina, Rest of LAMEA)
Key Market Players CRAWFORD & COMPANY, GALLAGHER BASSETT SERVICES, INC., United HealthCare Services, Inc., Meritain Health, ExlService Holdings, Inc., CORVEL, Charles Taylor, ESIS, Helmsman Management Services LLC, SEDGWICK
 

CHAPTER 1:INTRODUCTION

1.1.Report description
1.2.Key benefits for stakeholders
1.3.Key market segments
1.4.Research methodology

1.4.1.Secondary research
1.4.2.Primary research
1.4.3.Analyst tools and models

CHAPTER 2:EXECUTIVE SUMMARY

2.1.Key findings

2.1.1.Top impacting factors
2.1.2.Top investment pockets

2.2.CXO perspective

CHAPTER 3:MARKET OVERVIEW

3.1.Market definition and scope
3.2.Key forces shaping global insurance third party administrator market
3.3.Industry evolution/industry roadmap
3.4.Impact of government regulations on the global insurance third-party administrator (TPA) market
3.5.Market dynamics

3.5.1.Drivers

3.5.1.1.Surge in adoption of third party administrators in the health insurance industry
3.5.1.2.Rise in need for operational efficiency & transparency in insurance business process

3.5.2.Restraint

3.5.2.1.Security issues and privacy concerns

3.5.3.Opportunity

3.5.3.1.Technological advancement in third party administrator services

3.6.COVID-19 impact analysis on insurance third party administrator market

3.6.1.Impact on insurance third party administrator market size
3.6.2.Change in consumer trends, preferences, and budget impact, owing to COVID-19
3.6.3.Framework for market challenges faced by insurance third party administrator providers
3.6.4.Economic impact on insurance third party administrator providers
3.6.5.Key player strategies to tackle negative impact on the industry
3.6.6.Opportunity analysis for insurance third party administrator

CHAPTER 4:INSURANCE THIRD PARTY ADMINISTRATOR MARKET, BY ENTERPRISE SIZE

4.1.Overview
4.2.Large enterprises

4.2.1.Market size and forecast, by region
4.2.2.Market size and forecast, by region
4.2.3.Market analysis, by country

4.3.Small & medium-sized enterprises (SMEs)

4.3.1.Market size and forecast, by region
4.3.2.Market size and forecast, by region
4.3.3.Market analysis, by country

CHAPTER 5:INSURANCE THIRD PARTY ADMINISTRATOR MARKET, BY END USER

5.1.Overview
5.2.Life & annuities Insurance 

5.2.1.Market size and forecast, by region
5.2.2.Market size and forecast, by region
5.2.3.Market analysis, by country
5.2.4.Global Life & annuities Insurance  third-party administrators market, by type

5.2.4.1.Life insurance

5.2.4.1.1.Market size and forecast, by region

5.2.4.2.Market analysis, by country
5.2.4.3.Annuities insurance

5.2.4.3.1.Market size and forecast, by region
5.2.4.3.2.Market analysis, by country
5.2.4.3.3.Health insurance third-party administrators market, by type
5.2.4.3.4.Disease insurance
5.2.4.3.5.Market size and forecast, by region
5.2.4.3.6.Market analysis, by country
5.2.4.3.7.Medical insurance
5.2.4.3.8.Market size and forecast, by region
5.2.4.3.9.Market analysis, by country

5.2.4.3.9.1.Disease insurance third-party administrators market, by demographics
5.2.4.3.9.2.Senior citizens

5.2.4.3.10.Market size and forecast, by region
5.2.4.3.11.Market analysis, by country

5.2.4.3.11.1.Adults

5.2.4.3.12.Market size and forecast, by region
5.2.4.3.13.Market analysis, by country

5.2.4.3.13.1.Minors

5.2.4.3.14.Market size and forecast, by region
5.2.4.3.15.Market analysis, by country

5.3.P&C insurance

5.3.1.Market size and forecast, by region
5.3.2.Market size and forecast, by region
5.3.3.Market analysis, by country

CHAPTER 6:INSURANCE THIRD PARTY ADMINISTRATOR MARKET, BY SERVICE TYPE

6.1.Overview
6.2.Claims management

6.2.1.Key market trends, growth factors, and opportunities
6.2.2.Market size and forecast, by region
6.2.3.Market analysis, by country

6.3.Policy management

6.3.1.Key market trends, growth factors, and opportunities
6.3.2.Market size and forecast, by region
6.3.3.Market analysis, by country

6.4.Commission management

6.4.1.Key market trends, growth factors, and opportunities
6.4.2.Market size and forecast, by region
6.4.3.Market analysis, by country

6.5.Others

6.5.1.Key market trends, growth factors, and opportunities
6.5.2.Market size and forecast, by region
6.5.3.Market analysis, by country

CHAPTER 7:INSURANCE THIRD PARTY ADMINISTRATOR MARKET, BY REGION

7.1.Overview

7.1.1.Market size and forecast

7.2.North America

7.2.1.Key market trends, growth factors, and opportunities
7.2.2.Market size and forecast, by enterprise size
7.2.3.Market size and forecast, by end user
7.2.4.Market size and forecast, Life & annuities Insurance  third-party administrators market, by type
7.2.5.Market size and forecast, health insurance third-party administrators market, by type
7.2.6.Market size and forecast, disease insurance third-party administrators market, by demographics
7.2.7.Market size and forecast, by service type
7.2.8.Market analysis, by country

7.2.8.1.U.S.

7.2.8.1.1.Market size and forecast, by enterprise size
7.2.8.1.2.Market size and forecast, by end user
7.2.8.1.3.Market size and forecast, Life & annuities Insurance  third-party administrators market, by type
7.2.8.1.4.Market size and forecast, health insurance third-party administrators market, by type
7.2.8.1.5.Market size and forecast, disease insurance third-party administrators market, by demographics
7.2.8.1.6.Market size and forecast, by service type

7.2.8.2.Canada

7.2.8.2.1.Market size and forecast, by enterprise size
7.2.8.2.2.Market size and forecast, by end user
7.2.8.2.3.Market size and forecast, Life & annuities Insurance  third-party administrators market, by type
7.2.8.2.4.Market size and forecast, health insurance third-party administrators market, by type
7.2.8.2.5.Market size and forecast, disease insurance third-party administrators market, by demographics
7.2.8.2.6.Market size and forecast, by service type

7.3.Europe

7.3.1.Key market trends, growth factors, and opportunities
7.3.2.Market size and forecast, by enterprise size
7.3.3.Market size and forecast, by end user
7.3.4.Market size and forecast, Life & annuities Insurance  third-party administrators market, by type
7.3.5.Market size and forecast, health insurance third-party administrators market, by type
7.3.6.Market size and forecast, disease insurance third-party administrators market, by demographics
7.3.7.Market size and forecast, by service type
7.3.8.Market analysis, by country

7.3.8.1.UK

7.3.8.1.1.Market size and forecast, by enterprise size
7.3.8.1.2.Market size and forecast, by end user
7.3.8.1.3.Market size and forecast, Life & annuities Insurance  third-party administrators market, by type
7.3.8.1.4.Market size and forecast, health insurance third-party administrators market, by type
7.3.8.1.5.Market size and forecast, disease insurance third-party administrators market, by demographics
7.3.8.1.6.Market size and forecast, by service type

7.3.8.2.Germany

7.3.8.2.1.Market size and forecast, by enterprise size
7.3.8.2.2.Market size and forecast, by end user
7.3.8.2.3.Market size and forecast, Life & annuities Insurance  third-party administrators market, by type
7.3.8.2.4.Market size and forecast, health insurance third-party administrators market, by type
7.3.8.2.5.Market size and forecast, disease insurance third-party administrators market, by demographics
7.3.8.2.6.Market size and forecast, by service type

7.3.8.3.France

7.3.8.3.1.Market size and forecast, by enterprise size
7.3.8.3.2.Market size and forecast, by end user
7.3.8.3.3.Market size and forecast, Life & annuities Insurance  third-party administrators market, by type
7.3.8.3.4.Market size and forecast, health insurance third-party administrators market, by type
7.3.8.3.5.Market size and forecast, disease insurance third-party administrators market, by demographics
7.3.8.3.6.Market size and forecast, by service type

7.3.8.4.Italy

7.3.8.4.1.Market size and forecast, by enterprise size
7.3.8.4.2.Market size and forecast, by end user
7.3.8.4.3.Market size and forecast, Life & annuities Insurance  third-party administrators market, by type
7.3.8.4.4.Market size and forecast, health insurance third-party administrators market, by type
7.3.8.4.5.Market size and forecast, disease insurance third-party administrators market, by demographics
7.3.8.4.6.Market size and forecast, by service type

7.3.8.5.Spain

7.3.8.5.1.Market size and forecast, by enterprise size
7.3.8.5.2.Market size and forecast, by end user
7.3.8.5.3.Market size and forecast, Life & annuities Insurance  third-party administrators market, by type
7.3.8.5.4.Market size and forecast, health insurance third-party administrators market, by type
7.3.8.5.5.Market size and forecast, disease insurance third-party administrators market, by demographics
7.3.8.5.6.Market size and forecast, by service type

7.3.8.6.Netherlands

7.3.8.6.1.Market size and forecast, by enterprise size
7.3.8.6.2.Market size and forecast, by end user
7.3.8.6.3.Market size and forecast, Life & annuities Insurance  third-party administrators market, by type
7.3.8.6.4.Market size and forecast, health insurance third-party administrators market, by type
7.3.8.6.5.Market size and forecast, disease insurance third-party administrators market, by demographics
7.3.8.6.6.Market size and forecast, by service type

7.3.8.7.Rest of Europe

7.3.8.7.1.Market size and forecast, by enterprise size
7.3.8.7.2.Market size and forecast, by end user
7.3.8.7.3.Market size and forecast, Life & annuities Insurance  third-party administrators market, by type
7.3.8.7.4.Market size and forecast, health insurance third-party administrators market, by type
7.3.8.7.5.Market size and forecast, disease insurance third-party administrators market, by demographics
7.3.8.7.6.Market size and forecast, by service type

7.4.Asia-Pacific

7.4.1.Key market trends, growth factors, and opportunities
7.4.2.Market size and forecast, by enterprise size
7.4.3.Market size and forecast, by end user
7.4.4.Market size and forecast, Life & annuities Insurance  third-party administrators market, by type
7.4.5.Market size and forecast, health insurance third-party administrators market, by type
7.4.6.Market size and forecast, disease insurance third-party administrators market, by demographics
7.4.7.Market size and forecast, by service type
7.4.8.Market analysis, by country

7.4.8.1.China

7.4.8.1.1.Market size and forecast, by enterprise size
7.4.8.1.2.Market size and forecast, by end user
7.4.8.1.3.Market size and forecast, Life & annuities Insurance  third-party administrators market, by type
7.4.8.1.4.Market size and forecast, health insurance third-party administrators market, by type
7.4.8.1.5.Market size and forecast, disease insurance third-party administrators market, by demographics
7.4.8.1.6.Market size and forecast, by service type

7.4.8.2.India

7.4.8.2.1.Market size and forecast, by enterprise size
7.4.8.2.2.Market size and forecast, by end user
7.4.8.2.3.Market size and forecast, Life & annuities Insurance  third-party administrators market, by type
7.4.8.2.4.Market size and forecast, health insurance third-party administrators market, by type
7.4.8.2.5.Market size and forecast, disease insurance third-party administrators market, by demographics
7.4.8.2.6.Market size and forecast, by service type

7.4.8.3.Japan

7.4.8.3.1.Market size and forecast, by enterprise size
7.4.8.3.2.Market size and forecast, by end user
7.4.8.3.3.Market size and forecast, Life & annuities Insurance  third-party administrators market, by type
7.4.8.3.4.Market size and forecast, health insurance third-party administrators market, by type
7.4.8.3.5.Market size and forecast, disease insurance third-party administrators market, by demographics
7.4.8.3.6.Market size and forecast, by service type

7.4.8.4.Australia

7.4.8.4.1.Market size and forecast, by enterprise size
7.4.8.4.2.Market size and forecast, by end user
7.4.8.4.3.Market size and forecast, Life & annuities Insurance  third-party administrators market, by type
7.4.8.4.4.Market size and forecast, health insurance third-party administrators market, by type
7.4.8.4.5.Market size and forecast, disease insurance third-party administrators market, by demographics
7.4.8.4.6.Market size and forecast, by service type

7.4.8.5.South Korea

7.4.8.5.1.Market size and forecast, by enterprise size
7.4.8.5.2.Market size and forecast, by end user
7.4.8.5.3.Market size and forecast, Life & annuities Insurance  third-party administrators market, by type
7.4.8.5.4.Market size and forecast, health insurance third-party administrators market, by type
7.4.8.5.5.Market size and forecast, disease insurance third-party administrators market, by demographics
7.4.8.5.6.Market size and forecast, by service type

7.4.8.6.Rest of Asia-Pacific

7.4.8.6.1.Market size and forecast, by enterprise size
7.4.8.6.2.Market size and forecast, by end user
7.4.8.6.3.Market size and forecast, Life & annuities Insurance  third-party administrators market, by type
7.4.8.6.4.Market size and forecast, health insurance third-party administrators market, by type
7.4.8.6.5.Market size and forecast, disease insurance third-party administrators market, by demographics
7.4.8.6.6.Market size and forecast, by service type

7.5.LAMEA

7.5.1.Key market trends, growth factors, and opportunities
7.5.2.Market size and forecast, by enterprise size
7.5.3.Market size and forecast, by end user
7.5.4.Market size and forecast, Life & annuities Insurance  third party administrators market, by type
7.5.5.Market size and forecast, health insurance third-party administrators market, by type
7.5.6.Market size and forecast, disease insurance third-party administrators market, by demographics
7.5.7.Market size and forecast, by service type
7.5.8.Market analysis, by country

7.5.8.1.Latin America

7.5.8.1.1.Market size and forecast, by enterprise size
7.5.8.1.2.Market size and forecast, by end user
7.5.8.1.3.Market size and forecast, Life & annuities Insurance  third-party administrators market, by type
7.5.8.1.4.Market size and forecast, health insurance third-party administrators market, by type
7.5.8.1.5.Market size and forecast, disease insurance third-party administrators market, by demographics
7.5.8.1.6.Market size and forecast, by service type

7.5.8.2.Middle East

7.5.8.2.1.Market size and forecast, by enterprise size
7.5.8.2.2.Market size and forecast, by end user
7.5.8.2.3.Market size and forecast, Life & annuities Insurance  third-party administrators market, by type
7.5.8.2.4.Market size and forecast, health insurance third-party administrators market, by type
7.5.8.2.5.Market size and forecast, disease insurance third-party administrators market, by demographics
7.5.8.2.6.Market size and forecast, by service type

7.5.8.3.Africa

7.5.8.3.1.Market size and forecast, by enterprise size
7.5.8.3.2.Market size and forecast, by end user
7.5.8.3.3.Market size and forecast, Life & annuities Insurance  third-party administrators market, by type
7.5.8.3.4.Market size and forecast, health insurance third-party administrators market, by type
7.5.8.3.5.Market size and forecast, disease insurance third-party administrators market, by demographics
7.5.8.3.6.Market size and forecast, by service type

CHAPTER 8:COMPETITIVE LANDSCAPE

8.1.Introduction

8.1.1.Market player positioning, 2020
8.1.2.Top winning strategies

CHAPTER 9:COMPANY PROFILES

9.1.CHARLES TAYLOR

9.1.1.Company overview
9.1.2.Company snapshot
9.1.3.Product portfolio
9.1.4.Key strategic moves and developments

9.2.CORVEL

9.2.1.Company overview
9.2.2.Company snapshot
9.2.3.Product portfolio
9.2.4.Business performance
9.2.5.Key strategic moves and developments

9.3.CRAWFORD & COMPANY

9.3.1.Company overview
9.3.2.Company snapshot
9.3.3.Product portfolio
9.3.4.Key strategic moves and developments

9.4.ESIS

9.4.1.Company overview
9.4.2.Company snapshot
9.4.3.Product portfolio
9.4.4.Key strategic moves and developments

9.5.EXLSERVICE HOLDINGS, INC.

9.5.1.Company overview
9.5.2.Company snapshot
9.5.3.Operating business segments
9.5.4.Product portfolio
9.5.5.Business performance
9.5.6.Key strategic moves and developments

9.6.GALLAGHER BASSETT SERVICES, INC.

9.6.1.Company overview
9.6.2.Company snapshot
9.6.3.Product portfolio
9.6.4.Key strategic moves and developments

9.7.HELMSMAN MANAGEMENT SERVICES LLC

9.7.1.Company overview
9.7.2.Company snapshot
9.7.3.Product portfolio
9.7.4.Key strategic moves and developments

9.8.MERITAIN HEALTH

9.8.1.Company overview
9.8.2.Company snapshot
9.8.3.Product portfolio

9.9.SEDGWICK

9.9.1.Company overview
9.9.2.Company snapshot
9.9.3.Product portfolio
9.9.4.Key strategic moves and developments

9.10.UNITED HEALTHCARE SERVICES, INC.

9.10.1.Company overview
9.10.2.Product portfolio
9.10.3.Company snapshot
9.10.4.Business performance

 LIST OF TABLES

TABLE 01.GLOBAL INSURANCE THIRD PARTY ADMINISTRATOR MARKET REVENUE, BY ENTERPRISE SIZE, 2020-2030 ($MILLION)
TABLE 02.INSURANCE THIRD PARTY ADMINISTRATOR MARKET FOR LARGE ENTERPRISES, BY REGION, 2020-2030 ($MILLION)
TABLE 03.INSURANCE THIRD PARTY ADMINISTRATOR MARKET FOR SMALL & MEDIUM-SIZED ENTERPRISES (SMES), BY REGION, 2020-2030 ($MILLION)
TABLE 04.GLOBAL INSURANCE THIRD PARTY ADMINISTRATOR MARKET REVENUE, BY END USER, 2020-2030 ($MILLION)
TABLE 05.INSURANCE THIRD PARTY ADMINISTRATOR MARKET FOR LIFE & ANNUITIES INSURANCE , BY REGION, 2020-2030 ($MILLION)
TABLE 06.LIFE & ANNUITIES INSURANCE  THIRD-PARTY ADMINISTRATORS MARKET, BY TYPE, 2020-2030 ($MILLION)
TABLE 07.LIFE & ANNUITIES INSURANCE  THIRD-PARTY ADMINISTRATORS MARKET FOR LIFE INSURANCE, BY REGION, 2020–2030 ($MILLION)
TABLE 08.LIFE & ANNUITIES INSURANCE  THIRD-PARTY ADMINISTRATORS MARKET FOR HEALTH INSURANCE, BY REGION, 2020–2030 ($MILLION)
TABLE 09.HEALTH INSURANCE THIRD-PARTY ADMINISTRATORS MARKET, BY TYPE, 2020-2030 ($MILLION)
TABLE 10.HEALTH INSURANCE THIRD-PARTY ADMINISTRATORS MARKET REVENUE FOR DISEASE INSURANCE, BY REGION, 2020–2030 ($MILLION)
TABLE 11.HEALTH INSURANCE THIRD-PARTY ADMINISTRATORS MARKET REVENUE FOR MEDICAL INSURANCE, BY REGION, 2020–2030 ($MILLION)
TABLE 12.DISEASE INSURANCE THIRD-PARTY ADMINISTRATORS MARKET, BY DEMOGRAPHICS, 2020-2030 ($MILLION)
TABLE 13.DISEASE INSURANCE THIRD-PARTY ADMINISTRATORS MARKET REVENUE FOR SENIOR CITIZENS, BY REGION, 2020–2030 ($MILLION)
TABLE 14.DISEASE INSURANCE THIRD-PARTY ADMINISTRATORS MARKET REVENUE FOR ADULTS, BY REGION, 2020–2030 ($MILLION)
TABLE 15.DISEASE INSURANCE THIRD-PARTY ADMINISTRATORS MARKET REVENUE FOR MINORS, BY REGION, 2020–2030 ($MILLION)
TABLE 16.INSURANCE THIRD PARTY ADMINISTRATOR MARKET FOR P&C INSURANCE, BY REGION, 2020-2030 ($MILLION)
TABLE 17.GLOBAL INSURANCE THIRD PARTY ADMINISTRATOR MARKET, BY SERVICE TYPE, 2020-2030 ($MILLION)
TABLE 18.INSURANCE THIRD PARTY ADMINISTRATOR MARKET FOR CLAIMS MANAGEMENT, BY REGION, 2020-2030 ($MILLION)
TABLE 19.INSURANCE THIRD PARTY ADMINISTRATOR MARKET FOR POLICY MANAGEMENT, BY REGION, 2020-2030 ($MILLION)
TABLE 20.INSURANCE THIRD PARTY ADMINISTRATOR MARKET FOR COMMISSION MANAGEMENT, BY REGION, 2020-2030 ($MILLION)
TABLE 21.INSURANCE THIRD PARTY ADMINISTRATOR MARKET FOR OTHERS, BY REGION, 2020-2030 ($MILLION)
TABLE 22.INSURANCE THIRD PARTY ADMINISTRATOR MARKET, BY REGION, 2020-2030 ($MILLION)
TABLE 23.NORTH AMERICA INSURANCE THIRD PARTY ADMINISTRATOR MARKET REVENUE, BY ENTERPRISE SIZE, 2020–2030 ($MILLION)
TABLE 24.NORTH AMERICA INSURANCE THIRD PARTY ADMINISTRATOR MARKET REVENUE, BY END USER, 2020–2030 ($MILLION)
TABLE 25.NORTH AMERICA LIFE & ANNUITIES INSURANCE  THIRD-PARTY ADMINISTRATORS MARKET, BY TYPE, 2020–2030 ($MILLION)
TABLE 26.NORTH AMERICA HEALTH INSURANCE THIRD-PARTY ADMINISTRATORS MARKET, BY TYPE, 2020–2030 ($MILLION)
TABLE 27.NORTH AMERICA DISEASE INSURANCE THIRD-PARTY ADMINISTRATORS MARKET, BY DEMOGRAPHICS, 2020–2030 ($MILLION)
TABLE 28.NORTH AMERICA INSURANCE THIRD-PARTY ADMINISTRATORS MARKET, BY SERVICE TYPE, BY REGION, 2020–2030 ($MILLION)
TABLE 29.NORTH AMERICA INSURANCE THIRD PARTY ADMINISTRATOR MARKET REVENUE, BY COUNTRY, 2020–2030 ($MILLION)
TABLE 30.U.S. INSURANCE THIRD PARTY ADMINISTRATOR MARKET REVENUE, BY ENTERPRISE SIZE, 2020–2030 ($MILLION)
TABLE 31.U.S. INSURANCE THIRD PARTY ADMINISTRATOR MARKET REVENUE, BY END USER, 2020–2030 ($MILLION)
TABLE 32.U.S. LIFE & ANNUITIES INSURANCE  THIRD-PARTY ADMINISTRATORS MARKET, BY TYPE, 2020–2030 ($MILLION)
TABLE 33.U.S. HEALTH INSURANCE THIRD-PARTY ADMINISTRATORS MARKET, BY TYPE, 2020–2030 ($MILLION)
TABLE 34.U.S. DISEASE INSURANCE THIRD-PARTY ADMINISTRATORS MARKET, BY DEMOGRAPHICS, 2020–2030 ($MILLION)
TABLE 35.U.S. INSURANCE THIRD-PARTY ADMINISTRATORS MARKET REVENUE, BY SERVICE TYPE, 2020–2030 ($MILLION)
TABLE 36.CANADA INSURANCE THIRD PARTY ADMINISTRATOR MARKET REVENUE, BY ENTERPRISE SIZE, 2020–2030 ($MILLION)
TABLE 37.CANADA INSURANCE THIRD PARTY ADMINISTRATOR MARKET REVENUE, BY END USER, 2020–2030 ($MILLION)
TABLE 38.CANADA LIFE & ANNUITIES INSURANCE  THIRD-PARTY ADMINISTRATORS MARKET, BY TYPE, 2020–2030 ($MILLION)
TABLE 39.CANADA HEALTH INSURANCE THIRD-PARTY ADMINISTRATORS MARKET, BY TYPE, 2020–2030 ($MILLION)
TABLE 40.CANADA DISEASE INSURANCE THIRD-PARTY ADMINISTRATORS MARKET, BY DEMOGRAPHICS, 2020–2030 ($MILLION)
TABLE 41.CANADA INSURANCE THIRD-PARTY ADMINISTRATORS MARKET REVENUE, BY SERVICE TYPE, 2020–2030 ($MILLION)
TABLE 42.EUROPE INSURANCE THIRD PARTY ADMINISTRATOR MARKET REVENUE, BY ENTERPRISE SIZE, 2020–2030 ($MILLION)
TABLE 43.EUROPE INSURANCE THIRD PARTY ADMINISTRATOR MARKET REVENUE, BY END USER, 2020–2030 ($MILLION)
TABLE 44.EUROPE LIFE & ANNUITIES INSURANCE  THIRD-PARTY ADMINISTRATORS MARKET, BY TYPE, 2020–2030 ($MILLION)
TABLE 45.EUROPE HEALTH INSURANCE THIRD-PARTY ADMINISTRATORS MARKET, BY TYPE, 2020–2030 ($MILLION)
TABLE 46.EUROPE DISEASE INSURANCE THIRD-PARTY ADMINISTRATORS MARKET, BY DEMOGRAPHICS, 2020–2030 ($MILLION)
TABLE 47.EUROPE THIRD-PARTY ADMINISTRATORS MARKET, BY SERVICE TYPE, BY REGION, 2020–2030 ($MILLION)
TABLE 48.EUROPE INSURANCE THIRD PARTY ADMINISTRATOR MARKET REVENUE, BY COUNTRY, 2020–2030 ($MILLION)
TABLE 49.UK INSURANCE THIRD PARTY ADMINISTRATOR MARKET REVENUE, BY ENTERPRISE SIZE, 2020–2030 ($MILLION)
TABLE 50.UK INSURANCE THIRD PARTY ADMINISTRATOR MARKET REVENUE, BY END USER, 2020–2030 ($MILLION)
TABLE 51.UK LIFE & ANNUITIES INSURANCE  THIRD-PARTY ADMINISTRATORS MARKET, BY TYPE, 2020–2030 ($MILLION)
TABLE 52.UK HEALTH INSURANCE THIRD-PARTY ADMINISTRATORS MARKET, BY TYPE, 2020–2030 ($MILLION)
TABLE 53.UK DISEASE INSURANCE THIRD-PARTY ADMINISTRATORS MARKET, BY DEMOGRAPHICS, 2020–2030 ($MILLION)
TABLE 54.UK INSURANCE THIRD-PARTY ADMINISTRATORS MARKET REVENUE, BY SERVICE TYPE, 2020–2030 ($MILLION)
TABLE 55.GERMANY INSURANCE THIRD PARTY ADMINISTRATOR MARKET REVENUE, BY ENTERPRISE SIZE, 2020–2030 ($MILLION)
TABLE 56.GERMANY INSURANCE THIRD PARTY ADMINISTRATOR MARKET REVENUE, BY END USER, 2020–2030 ($MILLION)
TABLE 57.GERMANY LIFE & ANNUITIES INSURANCE  THIRD-PARTY ADMINISTRATORS MARKET, BY TYPE, 2020–2030 ($MILLION)
TABLE 58.GERMANY HEALTH INSURANCE THIRD-PARTY ADMINISTRATORS MARKET, BY TYPE, 2020–2030 ($MILLION)
TABLE 59.GERMANY DISEASE INSURANCE THIRD-PARTY ADMINISTRATORS MARKET, BY DEMOGRAPHICS, 2020–2030 ($MILLION)
TABLE 60.GERMANY INSURANCE THIRD-PARTY ADMINISTRATORS MARKET REVENUE, BY SERVICE TYPE, 2020–2030 ($MILLION)
TABLE 61.FRANCE INSURANCE THIRD PARTY ADMINISTRATOR MARKET REVENUE, BY ENTERPRISE SIZE, 2020–2030 ($MILLION)
TABLE 62.FRANCE INSURANCE THIRD PARTY ADMINISTRATOR MARKET REVENUE, BY END USER, 2020–2030 ($MILLION)
TABLE 63.FRANCE LIFE & ANNUITIES INSURANCE  THIRD-PARTY ADMINISTRATORS MARKET, BY TYPE, 2020–2030 ($MILLION)
TABLE 64.FRANCE HEALTH INSURANCE THIRD-PARTY ADMINISTRATORS MARKET, BY TYPE, 2020–2030 ($MILLION)
TABLE 65.FRANCE DISEASE INSURANCE THIRD-PARTY ADMINISTRATORS MARKET, BY DEMOGRAPHICS, 2020–2030 ($MILLION)
TABLE 66.FRANCE INSURANCE THIRD-PARTY ADMINISTRATORS MARKET REVENUE, BY SERVICE TYPE, 2020–2030 ($MILLION)
TABLE 67.ITALY INSURANCE THIRD PARTY ADMINISTRATOR MARKET REVENUE, BY ENTERPRISE SIZE, 2020–2030 ($MILLION)
TABLE 68.ITALY INSURANCE THIRD PARTY ADMINISTRATOR MARKET REVENUE, BY END USER, 2020–2030 ($MILLION)
TABLE 69.ITALY LIFE & ANNUITIES INSURANCE  THIRD-PARTY ADMINISTRATORS MARKET, BY TYPE, 2020–2030 ($MILLION)
TABLE 70.ITALY HEALTH INSURANCE THIRD-PARTY ADMINISTRATORS MARKET, BY TYPE, 2020–2030 ($MILLION)
TABLE 71.ITALY DISEASE INSURANCE THIRD-PARTY ADMINISTRATORS MARKET, BY DEMOGRAPHICS, 2020–2030 ($MILLION)
TABLE 72.ITALY INSURANCE THIRD-PARTY ADMINISTRATORS MARKET REVENUE, BY SERVICE TYPE, 2020–2030 ($MILLION)
TABLE 73.SPAIN INSURANCE THIRD PARTY ADMINISTRATOR MARKET REVENUE, BY ENTERPRISE SIZE, 2020–2030 ($MILLION)
TABLE 74.SPAIN INSURANCE THIRD PARTY ADMINISTRATOR MARKET REVENUE, BY END USER, 2020–2030 ($MILLION)
TABLE 75.SPAIN LIFE & ANNUITIES INSURANCE  THIRD-PARTY ADMINISTRATORS MARKET, BY TYPE, 2020–2030 ($MILLION)
TABLE 76.SPAIN HEALTH INSURANCE THIRD-PARTY ADMINISTRATORS MARKET, BY TYPE, 2020–2030 ($MILLION)
TABLE 77.SPAIN DISEASE INSURANCE THIRD-PARTY ADMINISTRATORS MARKET, BY DEMOGRAPHICS, 2020–2030 ($MILLION)
TABLE 78.SPAIN INSURANCE THIRD-PARTY ADMINISTRATORS MARKET REVENUE, BY SERVICE TYPE, 2020–2030 ($MILLION)
TABLE 79.THE NETHERLANDS INSURANCE THIRD PARTY ADMINISTRATOR MARKET REVENUE, BY ENTERPRISE SIZE, 2020–2030 ($MILLION)
TABLE 80.THE NETHERLANDS INSURANCE THIRD PARTY ADMINISTRATOR MARKET REVENUE, BY END USER, 2020–2030 ($MILLION)
TABLE 81.THE NETHERLANDS LIFE & ANNUITIES INSURANCE  THIRD-PARTY ADMINISTRATORS MARKET, BY TYPE, 2020–2030 ($MILLION)
TABLE 82.THE NETHERLANDS HEALTH INSURANCE THIRD-PARTY ADMINISTRATORS MARKET, BY TYPE, 2020–2030 ($MILLION)
TABLE 83.THE NETHERLANDS DISEASE INSURANCE THIRD-PARTY ADMINISTRATORS MARKET, BY DEMOGRAPHICS, 2020–2030 ($MILLION)
TABLE 84.THE NETHERLANDS INSURANCE THIRD-PARTY ADMINISTRATORS MARKET REVENUE, BY SERVICE TYPE, 2020–2030 ($MILLION)
TABLE 85.REST OF EUROPE INSURANCE THIRD PARTY ADMINISTRATOR MARKET REVENUE, BY ENTERPRISE SIZE, 2020–2030 ($MILLION)
TABLE 86.REST OF EUROPE INSURANCE THIRD PARTY ADMINISTRATOR MARKET REVENUE, BY END USER, 2020–2030 ($MILLION)
TABLE 87.REST OF EUROPE LIFE & ANNUITIES INSURANCE  THIRD-PARTY ADMINISTRATORS MARKET, BY TYPE, 2020–2030 ($MILLION)
TABLE 88.REST OF EUROPE HEALTH INSURANCE THIRD-PARTY ADMINISTRATORS MARKET, BY TYPE, 2020–2030 ($MILLION)
TABLE 89.REST OF EUROPE DISEASE INSURANCE THIRD-PARTY ADMINISTRATORS MARKET, BY DEMOGRAPHICS, 2020–2030 ($MILLION)
TABLE 90.REST OF EUROPE INSURANCE THIRD-PARTY ADMINISTRATORS MARKET REVENUE, BY SERVICE TYPE, 2020–2030 ($MILLION)
TABLE 91.ASIA-PACIFIC INSURANCE THIRD PARTY ADMINISTRATOR MARKET REVENUE, BY ENTERPRISE SIZE, 2020–2030 ($MILLION)
TABLE 92.ASIA-PACIFIC INSURANCE THIRD PARTY ADMINISTRATOR MARKET REVENUE, BY END USER, 2020–2030 ($MILLION)
TABLE 93.ASIA-PACIFIC LIFE & ANNUITIES INSURANCE  THIRD-PARTY ADMINISTRATORS MARKET, BY TYPE, 2020–2030 ($MILLION)
TABLE 94.ASIA-PACIFIC HEALTH INSURANCE THIRD-PARTY ADMINISTRATORS MARKET, BY TYPE, 2020–2030 ($MILLION)
TABLE 95.ASIA-PACIFIC DISEASE INSURANCE THIRD-PARTY ADMINISTRATORS MARKET, BY DEMOGRAPHICS, 2020–2030 ($MILLION)
TABLE 96.ASIA-PACIFIC INSURANCE THIRD-PARTY ADMINISTRATORS MARKET, BY SERVICE TYPE, BY REGION, 2020–2030 ($MILLION)
TABLE 97.ASIA-PACIFIC INSURANCE THIRD PARTY ADMINISTRATOR MARKET REVENUE, BY COUNTRY, 2020–2030 ($MILLION)
TABLE 98.CHINA INSURANCE THIRD PARTY ADMINISTRATOR MARKET REVENUE, BY ENTERPRISE SIZE, 2020–2030 ($MILLION)
TABLE 99.CHINA INSURANCE THIRD PARTY ADMINISTRATOR MARKET REVENUE, BY END USER, 2020–2030 ($MILLION)
TABLE 100.CHINA LIFE & ANNUITIES INSURANCE  THIRD-PARTY ADMINISTRATORS MARKET, BY TYPE, 2020–2030 ($MILLION)
TABLE 101.CHINA HEALTH INSURANCE THIRD-PARTY ADMINISTRATORS MARKET, BY TYPE, 2020–2030 ($MILLION)
TABLE 102.CHINA DISEASE INSURANCE THIRD-PARTY ADMINISTRATORS MARKET, BY DEMOGRAPHICS, 2020–2030 ($MILLION)
TABLE 103.CHINA INSURANCE THIRD-PARTY ADMINISTRATORS MARKET REVENUE, BY SERVICE TYPE, 2020–2030 ($MILLION)
TABLE 104.INDIA INSURANCE THIRD PARTY ADMINISTRATOR MARKET REVENUE, BY ENTERPRISE SIZE, 2020–2030 ($MILLION)
TABLE 105.INDIA INSURANCE THIRD PARTY ADMINISTRATOR MARKET REVENUE, BY END USER, 2020–2030 ($MILLION)
TABLE 106.INDIA LIFE & ANNUITIES INSURANCE  THIRD-PARTY ADMINISTRATORS MARKET, BY TYPE, 2020–2030 ($MILLION)
TABLE 107.INDIA HEALTH INSURANCE THIRD-PARTY ADMINISTRATORS MARKET, BY TYPE, 2020–2030 ($MILLION)
TABLE 108.INDIA DISEASE INSURANCE THIRD-PARTY ADMINISTRATORS MARKET, BY DEMOGRAPHICS, 2020–2030 ($MILLION)
TABLE 109.INDIA INSURANCE THIRD-PARTY ADMINISTRATORS MARKET REVENUE, BY SERVICE TYPE, 2020–2030 ($MILLION)
TABLE 110.JAPAN INSURANCE THIRD PARTY ADMINISTRATOR MARKET REVENUE, BY ENTERPRISE SIZE, 2020–2030 ($MILLION)
TABLE 111.JAPAN INSURANCE THIRD PARTY ADMINISTRATOR MARKET REVENUE, BY END USER, 2020–2030 ($MILLION)
TABLE 112.JAPAN LIFE & ANNUITIES INSURANCE  THIRD-PARTY ADMINISTRATORS MARKET, BY TYPE, 2020–2030 ($MILLION)
TABLE 113.JAPAN HEALTH INSURANCE THIRD-PARTY ADMINISTRATORS MARKET, BY TYPE, 2020–2030 ($MILLION)
TABLE 114.JAPAN DISEASE INSURANCE THIRD-PARTY ADMINISTRATORS MARKET, BY DEMOGRAPHICS, 2020–2030 ($MILLION)
TABLE 115.JAPAN INSURANCE THIRD-PARTY ADMINISTRATORS MARKET REVENUE, BY SERVICE TYPE, 2020–2030 ($MILLION)
TABLE 116.AUSTRALIA INSURANCE THIRD PARTY ADMINISTRATOR MARKET REVENUE, BY ENTERPRISE SIZE, 2020–2030 ($MILLION)
TABLE 117.AUSTRALIA INSURANCE THIRD PARTY ADMINISTRATOR MARKET REVENUE, BY END USER, 2020–2030 ($MILLION)
TABLE 118.AUSTRALIA LIFE & ANNUITIES INSURANCE  THIRD-PARTY ADMINISTRATORS MARKET, BY TYPE, 2020–2030 ($MILLION)
TABLE 119.AUSTRALIA HEALTH INSURANCE THIRD-PARTY ADMINISTRATORS MARKET, BY TYPE, 2020–2030 ($MILLION)
TABLE 120.AUSTRALIA DISEASE INSURANCE THIRD-PARTY ADMINISTRATORS MARKET, BY DEMOGRAPHICS, 2020–2030 ($MILLION)
TABLE 121.AUSTRALIA INSURANCE THIRD-PARTY ADMINISTRATORS MARKET REVENUE, BY SERVICE TYPE, 2020–2030 ($MILLION)
TABLE 122.SOUTH KOREA INSURANCE THIRD PARTY ADMINISTRATOR MARKET REVENUE, BY ENTERPRISE SIZE, 2020–2030 ($MILLION)
TABLE 123.SOUTH KOREA INSURANCE THIRD PARTY ADMINISTRATOR MARKET REVENUE, BY END USER, 2020–2030 ($MILLION)
TABLE 124.SOUTH KOREA LIFE & ANNUITIES INSURANCE  THIRD-PARTY ADMINISTRATORS MARKET, BY TYPE, 2020–2030 ($MILLION)
TABLE 125.SOUTH KOREA HEALTH INSURANCE THIRD-PARTY ADMINISTRATORS MARKET, BY TYPE, 2020–2030 ($MILLION)
TABLE 126.SOUTH KOREA DISEASE INSURANCE THIRD-PARTY ADMINISTRATORS MARKET, BY DEMOGRAPHICS, 2020–2030 ($MILLION)
TABLE 127.SOUTH KOREA INSURANCE THIRD-PARTY ADMINISTRATORS MARKET REVENUE, BY SERVICE TYPE, 2020–2030 ($MILLION)
TABLE 128.REST OF ASIA-PACIFIC INSURANCE THIRD PARTY ADMINISTRATOR MARKET REVENUE, BY ENTERPRISE SIZE, 2020–2030 ($MILLION)
TABLE 129.REST OF ASIA-PACIFIC INSURANCE THIRD PARTY ADMINISTRATOR MARKET REVENUE, BY END USER, 2020–2030 ($MILLION)
TABLE 130.REST OF ASIA-PACIFIC LIFE & ANNUITIES INSURANCE  THIRD-PARTY ADMINISTRATORS MARKET, BY TYPE, 2020–2030 ($MILLION)
TABLE 131.REST OF ASIA-PACIFIC HEALTH INSURANCE THIRD-PARTY ADMINISTRATORS MARKET, BY TYPE, 2020–2030 ($MILLION)
TABLE 132.REST OF ASIA-PACIFIC DISEASE INSURANCE THIRD-PARTY ADMINISTRATORS MARKET, BY DEMOGRAPHICS, 2020–2030 ($MILLION)
TABLE 133.REST OF ASIA-PACIFIC INSURANCE THIRD-PARTY ADMINISTRATORS MARKET REVENUE, BY SERVICE TYPE, 2020–2030 ($MILLION)
TABLE 134.LAMEA INSURANCE THIRD PARTY ADMINISTRATOR MARKET REVENUE, BY ENTERPRISE SIZE, 2020–2030 ($MILLION)
TABLE 135.LAMEA INSURANCE THIRD PARTY ADMINISTRATOR MARKET REVENUE, BY END USER, 2020–2030 ($MILLION)
TABLE 136.LAMEA LIFE & ANNUITIES INSURANCE  THIRD-PARTY ADMINISTRATORS MARKET, BY TYPE, 2020–2030 ($MILLION)
TABLE 137.LAMEA HEALTH INSURANCE THIRD-PARTY ADMINISTRATORS MARKET, BY TYPE, 2020–2030 ($MILLION)
TABLE 138.LAMEA DISEASE INSURANCE THIRD-PARTY ADMINISTRATORS MARKET, BY DEMOGRAPHICS, 2020–2030 ($MILLION)
TABLE 139.LAMEA INSURANCE THIRD-PARTY ADMINISTRATORS MARKET, BY SERVICE TYPE, BY REGION, 2020–2030 ($MILLION)
TABLE 140.LAMEA INSURANCE THIRD PARTY ADMINISTRATOR MARKET REVENUE, BY COUNTRY, 2020–2030 ($MILLION)
TABLE 141.LATIN AMERICA INSURANCE THIRD PARTY ADMINISTRATOR MARKET REVENUE, BY ENTERPRISE SIZE, 2020–2030 ($MILLION)
TABLE 142.LATIN AMERICA INSURANCE THIRD PARTY ADMINISTRATOR MARKET REVENUE, BY END USER, 2020–2030 ($MILLION)
TABLE 143.LATIN AMERICA LIFE & ANNUITIES INSURANCE  THIRD-PARTY ADMINISTRATORS MARKET, BY TYPE, 2020–2030 ($MILLION)
TABLE 144.LATIN AMERICA HEALTH INSURANCE THIRD-PARTY ADMINISTRATORS MARKET, BY TYPE, 2020–2030 ($MILLION)
TABLE 145.LATIN AMERICA DISEASE INSURANCE THIRD-PARTY ADMINISTRATORS MARKET, BY DEMOGRAPHICS, 2020–2030 ($MILLION)
TABLE 146.LATIN AMERICA INSURANCE THIRD-PARTY ADMINISTRATORS MARKET REVENUE, BY SERVICE TYPE, 2020–2030 ($MILLION)
TABLE 147.MIDDLE EAST INSURANCE THIRD PARTY ADMINISTRATOR MARKET REVENUE, BY ENTERPRISE SIZE, 2020–2030 ($MILLION)
TABLE 148.MIDDLE EAST INSURANCE THIRD PARTY ADMINISTRATOR MARKET REVENUE, BY END USER, 2020–2030 ($MILLION)
TABLE 149.MIDDLE EAST LIFE & ANNUITIES INSURANCE  THIRD-PARTY ADMINISTRATORS MARKET, BY TYPE, 2020–2030 ($MILLION)
TABLE 150.MIDDLE EAST HEALTH INSURANCE THIRD-PARTY ADMINISTRATORS MARKET, BY TYPE, 2020–2030 ($MILLION)
TABLE 151.MIDDLE EAST DISEASE INSURANCE THIRD-PARTY ADMINISTRATORS MARKET, BY DEMOGRAPHICS, 2020–2030 ($MILLION)
TABLE 152.MIDDLE EAST INSURANCE THIRD-PARTY ADMINISTRATORS MARKET REVENUE, BY SERVICE TYPE, 2020–2030 ($MILLION)
TABLE 153.AFRICA INSURANCE THIRD PARTY ADMINISTRATOR MARKET REVENUE, BY ENTERPRISE SIZE, 2020–2030 ($MILLION)
TABLE 154.AFRICA INSURANCE THIRD PARTY ADMINISTRATOR MARKET REVENUE, BY END USER, 2020–2030 ($MILLION)
TABLE 155.AFRICA LIFE & ANNUITIES INSURANCE  THIRD-PARTY ADMINISTRATORS MARKET, BY TYPE, 2020–2030 ($MILLION)
TABLE 156.AFRICA HEALTH INSURANCE THIRD-PARTY ADMINISTRATORS MARKET, BY TYPE, 2020–2030 ($MILLION)
TABLE 157.AFRICA DISEASE INSURANCE THIRD-PARTY ADMINISTRATORS MARKET, BY DEMOGRAPHICS, 2020–2030 ($MILLION)
TABLE 158.AFRICA INSURANCE THIRD-PARTY ADMINISTRATORS MARKET REVENUE, BY SERVICE TYPE, 2020–2030 ($MILLION)
TABLE 159.CHARLES TAYLOR: COMPANY SNAPSHOT
TABLE 160.CHARLES TAYLOR: PRODUCT PORTFOLIO
TABLE 161.CORVEL: COMPANY SNAPSHOT
TABLE 162.CORVEL: PRODUCT PORTFOLIO
TABLE 163.CRAWFORD & COMPANY: COMPANY SNAPSHOT
TABLE 164.CRAWFORD & COMPANY: PRODUCT PORTFOLIO
TABLE 165.ESIS: COMPANY SNAPSHOT
TABLE 166.ESIS: PRODUCT PORTFOLIO
TABLE 167.EXLSERVICE HOLDINGS, INC.: COMPANY SNAPSHOT
TABLE 168.EXLSERVICE HOLDINGS, INC.: OPERATING SEGMENTS
TABLE 169.EXLSERVICE HOLDINGS, INC.: PRODUCT PORTFOLIO
TABLE 170.GALLAGHER BASSETT SERVICES, INC.: COMPANY SNAPSHOT
TABLE 171.GALLAGHER BASSETT SERVICES, INC.: PRODUCT PORTFOLIO
TABLE 172.HELMSMAN MANAGEMENT SERVICES LLC: COMPANY SNAPSHOT
TABLE 173.HELMSMAN MANAGEMENT SERVICES LLC: PRODUCT PORTFOLIO
TABLE 174.MERITAIN HEALTH: COMPANY SNAPSHOT
TABLE 175.MERITAIN HEALTH: PRODUCT PORTFOLIO
TABLE 176.SEDGWICK: COMPANY SNAPSHOT
TABLE 177.SEDGWICK: PRODUCT PORTFOLIO
TABLE 178.UNITED HEALTHCARE SERVICES, INC.: PRODUCT PORTFOLIO
TABLE 179.UNITED HEALTHCARE SERVICES, INC.: COMPANY SNAPSHOT

 LIST OF FIGURES

FIGURE 01.KEY MARKET SEGMENTS
FIGURE 02.GLOBAL INSURANCE THIRD PARTY ADMINISTRATOR MARKET, 2020–2030
FIGURE 03.GLOBAL INSURANCE THIRD PARTY ADMINISTRATOR MARKET, BY REGION, 2020–2030
FIGURE 04.INSURANCE THIRD PARTY ADMINISTRATOR MARKET: TOP IMPACTING FACTOR
FIGURE 05.TOP INVESTMENT POCKETS
FIGURE 06.MODERATE BARGAINING POWER OF SUPPLIERS
FIGURE 07.MODERATE BARGAINING POWER OF BUYER
FIGURE 08.LOW THREAT OF SUBSTITUTES
FIGURE 09.HIGH THREAT OF NEW ENTRANTS
FIGURE 10.MODERATE COMPETITIVE RIVALRY
FIGURE 11.MARKET EVOLUTION/INDUSTRY ROADMAP
FIGURE 12.IMPACT OF GOVERNMENT REGULATIONS ON INSURANCE THIRD PARTY ADMINISTRATOR MARKET
FIGURE 13.GLOBAL INSURANCE THIRD PARTY ADMINISTRATOR MARKET, BY ENTERPRISE SIZE, 2020-2030
FIGURE 14.COMPARATIVE COUNTRY ANALYSIS OF INSURANCE THIRD PARTY ADMINISTRATOR MARKET FOR LARGE ENTERPRISES, 2020 & 2030 (%)
FIGURE 15.COMPARATIVE ANALYSIS OF INSURANCE THIRD PARTY ADMINISTRATOR MARKET FOR SMALL & MEDIUM-SIZED ENTERPRISES (SMES), 2020 & 2030 (%)
FIGURE 16.GLOBAL INSURANCE THIRD PARTY ADMINISTRATOR MARKET, BY END USER, 2020-2030
FIGURE 17.COMPARATIVE COUNTRY ANALYSIS OF INSURANCE THIRD PARTY ADMINISTRATOR MARKET FOR LIFE & ANNUITIES INSURANCE , 2020 & 2030 (%)
FIGURE 18.LIFE & ANNUITIES INSURANCE  THIRD-PARTY ADMINISTRATORS MARKET, BY TYPE, 2020-2030
FIGURE 19.COMPARATIVE SHARE ANALYSIS OF LIFE & ANNUITIES INSURANCE  THIRD-PARTY ADMINISTRATORS MARKET FOR LIFE INSURANCE, BY COUNTRY, 2020 & 2030(%)
FIGURE 20.COMPARATIVE SHARE ANALYSIS OF LIFE & ANNUITIES INSURANCE  THIRD-PARTY ADMINISTRATORS MARKET FOR HEALTH INSURANCE, BY COUNTRY, 2020 & 2030(%)
FIGURE 21.HEALTH INSURANCE THIRD-PARTY ADMINISTRATORS MARKET, BY TYPE, 2020-2030
FIGURE 22.COMPARATIVE SHARE ANALYSIS OF HEALTH INSURANCE THIRD-PARTY ADMINISTRATORS MARKET FOR DISEASE INSURANCE, BY COUNTRY, 2020 & 2030(%)
FIGURE 23.COMPARATIVE SHARE ANALYSIS OF HEALTH INSURANCE THIRD-PARTY ADMINISTRATORS MARKET FOR MEDICAL INSURANCE, BY COUNTRY, 2020 & 2030(%)
FIGURE 24.DISEASE INSURANCE THIRD-PARTY ADMINISTRATORS MARKET, BY DEMOGRAPHICS, 2020-2030
FIGURE 25.COMPARATIVE SHARE ANALYSIS OF DISEASE INSURANCE THIRD-PARTY ADMINISTRATORS MARKET FOR SENIOR CITIZENS, BY COUNTRY, 2020 & 2030(%)
FIGURE 26.COMPARATIVE SHARE ANALYSIS OF DISEASE INSURANCE THIRD-PARTY ADMINISTRATORS MARKET FOR ADULTS, BY COUNTRY, 2020 & 2030(%)
FIGURE 27.COMPARATIVE SHARE ANALYSIS OF DISEASE INSURANCE THIRD-PARTY ADMINISTRATORS MARKET FOR MINORS, BY COUNTRY, 2020 & 2030(%)
FIGURE 28.COMPARATIVE COUNTRY ANALYSIS OF INSURANCE THIRD PARTY ADMINISTRATOR MARKET FOR P&C INSURANCE, 2020 & 2030 (%)
FIGURE 29.GLOBAL INSURANCE THIRD PARTY ADMINISTRATOR MARKET, BY SERVICE TYPE, 2020-2030
FIGURE 30.COMPARATIVE COUNTRY ANALYSIS OF INSURANCE THIRD PARTY ADMINISTRATOR MARKET FOR CLAIMS MANAGEMENT, 2020 & 2030 (%)
FIGURE 31.COMPARATIVE COUNTRY ANALYSIS OF INSURANCE THIRD PARTY ADMINISTRATOR MARKET FOR POLICY MANAGEMENT, 2020 & 2030 (%)
FIGURE 32.COMPARATIVE COUNTRY ANALYSIS OF INSURANCE THIRD PARTY ADMINISTRATOR MARKET FOR COMMISSION MANAGEMENT, 2020 & 2030 (%)
FIGURE 33.COMPARATIVE COUNTRY ANALYSIS OF INSURANCE THIRD PARTY ADMINISTRATOR MARKET FOR OTHERS,  2020 & 2030 (%)
FIGURE 34.U.S. INSURANCE THIRD PARTY ADMINISTRATOR MARKET REVENUE, 2020–2030 ($MILLION)
FIGURE 35.CANADA INSURANCE THIRD PARTY ADMINISTRATOR MARKET REVENUE, 2020–2030 ($MILLION)
FIGURE 36.UK INSURANCE THIRD PARTY ADMINISTRATOR MARKET REVENUE, 2020–2030 ($MILLION)
FIGURE 37.GERMANY INSURANCE THIRD PARTY ADMINISTRATOR MARKET REVENUE, 2020–2030 ($MILLION)
FIGURE 38.FRANCE INSURANCE THIRD PARTY ADMINISTRATOR MARKET REVENUE, 2020–2030 ($MILLION)
FIGURE 39.ITALY INSURANCE THIRD PARTY ADMINISTRATOR MARKET REVENUE, 2020–2030 ($MILLION)
FIGURE 40.SPAIN INSURANCE THIRD PARTY ADMINISTRATOR MARKET REVENUE, 2020–2030 ($MILLION)
FIGURE 41.THE NETHERLANDS INSURANCE THIRD PARTY ADMINISTRATOR MARKET REVENUE, 2020–2030 ($MILLION)
FIGURE 42.REST OF EUROPE INSURANCE THIRD PARTY ADMINISTRATOR MARKET REVENUE, 2020–2030 ($MILLION)
FIGURE 43.CHINA INSURANCE THIRD PARTY ADMINISTRATOR MARKET REVENUE, 2020–2030 ($MILLION)
FIGURE 44.INDIA INSURANCE THIRD PARTY ADMINISTRATOR MARKET REVENUE, 2020–2030 ($MILLION)
FIGURE 45.JAPAN INSURANCE THIRD PARTY ADMINISTRATOR MARKET REVENUE, 2020–2030 ($MILLION)
FIGURE 46.AUSTRALIA INSURANCE THIRD PARTY ADMINISTRATOR MARKET REVENUE, 2020–2030 ($MILLION)
FIGURE 47.SOUTH KOREA INSURANCE THIRD PARTY ADMINISTRATOR MARKET REVENUE, 2020–2030 ($MILLION)
FIGURE 48.REST OF ASIA-PACIFIC INSURANCE THIRD PARTY ADMINISTRATOR MARKET REVENUE, 2020–2030 ($MILLION)
FIGURE 49.LATIN AMERICA INSURANCE THIRD PARTY ADMINISTRATOR MARKET REVENUE, 2020–2030 ($MILLION)
FIGURE 50.MIDDLE EAST INSURANCE THIRD PARTY ADMINISTRATOR MARKET REVENUE, 2020–2030 ($MILLION)
FIGURE 51.AFRICA INSURANCE THIRD PARTY ADMINISTRATOR MARKET REVENUE, 2020–2030 ($MILLION)
FIGURE 52.MARKET PLAYER POSITIONING, 2020
FIGURE 53.TOP WINNING STRATEGIES, BY YEAR, 2018–2020
FIGURE 54.TOP WINNING STRATEGIES, BY DEVELOPMENT, 2019–2021
FIGURE 55.TOP WINNING STRATEGIES, BY COMPANY, 2019–2021
FIGURE 56.CORVEL: NET SALES, 2018–2020 ($MILLION)
FIGURE 57.EXLSERVICE HOLDINGS, INC.: REVENUE, 2018–2020 ($MILLION)
FIGURE 58.EXLSERVICE HOLDINGS, INC.: REVENUE SHARE, BY SEGMENT, 2020 (%)
FIGURE 59.UNITED HEALTHCARE SERVICES, INC.: NET REVENUE, 2018–2020 ($MILLION)


There is rapid demand for insurance third party administrator (TPA) for handling the claims of worker’s compensation offered by employment firms under employee benefits. In addition, TPAs are used to manage company’s group benefits, particularly health, workers compensation, and dental claims that are typically self-funded. Furthermore, TPAs are used by health insurance companies to handle claims of the policyholders and also provide value added services, including hospitalization of patients, medical facilities such as arrangement of wheelchairs, beds, medicines, and others. In addition, during the COVID-19 pandemic, the services of TPAs have increased tremendously due to the rise in COVID-19 cases. There has been an increased need for hospitalization and unavailability of hospital beds that accelerated the dependency on TPAs for arrangement of beds and medical equipment. Therefore, there is an increase in adoption of third-party administrators by insurance companies for effectively handling the claims & providing other related insurance services during the pandemic.

The insurance third party administrator market is fragmented with the presence of regional vendors such as CRAWFORD & COMPANY, SEDGWICK, and Charles Taylor. North America dominated the insurance third party administrator market, in terms of revenue in 2020, and is expected to retain their dominance during the forecast period. However, Asia-Pacific is anticipated to experience significant growth in the future as insurance TPAs play an important role in terms of enhancing customer relationships and delivering niche & unique insurance third party administrator services in this region.

The report analyzes the profiles of key players operating in the insurance third party administrator market such as Charles Taylor, CORVEL, CRAWFORD & COMPANY, ESIS, ExlService Holdings, Inc., GALLAGHER BASSETT SERVICES, INC., Helmsman Management Services LLC, Meritain Health, SEDGWICK, and United HealthCare Services, Inc. These players have adopted various strategies to increase their market penetration and strengthen their position in the insurance third party administrator market.

PURCHASE OPTIONS

Call or Email us

U.S.-Canada Toll-free: +1-800-792-5285
Int'l : +1-503-894-6022
Europe : +44-845-528-1300
Email : help@alliedmarketresearch.com

Looking for Customization?

 Customization Request

Have a Question?

 Speak with Analyst

Any Confusion?

 Inquire Before Buying

Have a glance of the Report

  Request Sample
RELATED TAGS

Purchase Full Report of
Insurance Third Party Administrator Market

Start reading instantly.
This Report and over 66,983+ more Reports, Available with Avenue Library. T&C*.

  • Online Only
  • $3,713
  • Online cloud access only
  • Restricted print, copy, paste & download
  • Read only
  • Free industry update
    (Within 180 days)
  • Free report update in next update cycle
    (Jul 2022 - Jul 2023)
  • Data Pack
  • $4,126
  • Restricted to one authorized user
  • One print only
  • Available in
    Excel
  • Free industry update
    (Within 180 days)
  •   Free report update in next update cycle
    (Jul 2022 - Jul 2023)
  • Single User
  • $5,770
  • Restricted to one authorized user
  • One print only
  • Available in
    PDF
  • Free industry update
    (Within 180 days)
  •   Free report update in next update cycle
    (Jul 2022 - Jul 2023)
  • Five Users
  • $6,930
  • Limited to five authorized users
  • Print upto five copies
  • Available in
    PDF
  • Free industry update
    (Within 180 days)
  •   Free report update in next update cycle
    (Jul 2022 - Jul 2023)
  • Enterprise
    License/PDF

  • $10,665
  • Unlimited
    within
    company/enterprise
  • Available in Excel & PDF
  • Free industry update
    (Within 180 days)
  •   Free report update in next update cycle
    (Jul 2022 - Jul 2023)
  • Library
    Membership

  • $999 $ 1,175
    Per User/ Per month/ Billed annually
  • Published Content
    E-access
  • Company Profiles
    E-access
  • Newly Added Content Access
  • 10 PDF
    Downloads
  • 5 Excel Data
    Pack Downloads
  • 250 Company Profiles PDF Downloads
  • Buy Now

*Taxes/Fees, if applicable will be added during checkout. All prices in USD

RELATED REPORTS
 

Why Allied Market Research?


Infallible Methodology

To ensure high-level data integrity, accurate analysis, and impeccable forecasts

Analyst Support

For complete satisfaction

Customization

On-demand customization of scope of the report to exactly meet your needs

TARGETED MARKET VIEW

Targeted market view to provide pertinent information and save time of readers

Get fresh content delivered

Get insights on topics that are crucial for your business. Stay abreast of your interest areas.

Get Industry Data Alerts

Why Allied Market Research?

Infallible Methodology

To ensure high-level data integrity, accurate analysis, and impeccable forecasts

Analyst Support

For complete satisfaction

Customization

On-demand customization of scope of the report to exactly meet your needs

TARGETED MARKET VIEW

Targeted market view to provide pertinent information and save time of readers