
North America Family/Indoor Entertainment Centers Market Overview
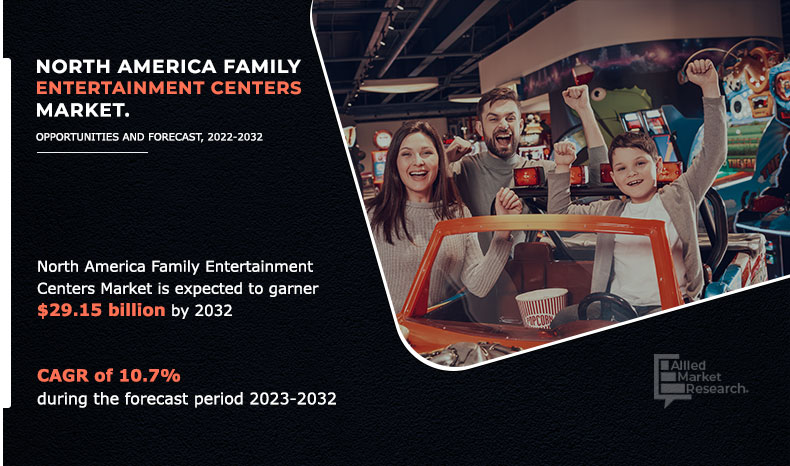
The North America family/indoor entertainment centers market was valued at USD 10.86 billion in 2022, and is projected to reach USD 29.15 billion by 2032, growing at a CAGR of 10.7% from 2023 to 2032. The surge in investments in new games and attractions across North America is one of the opportunities for the family entertainment center market. FECs that invest in new and exciting attractions are expected to attract more visitors and retain existing customers.
Key Market Insights
- By facility size, 10,001 to 20,000 sq. ft. segment is expected to grow at the highest rate during the forecast period.
- By activity area, the physical play activities segment led the market size in terms of revenue in 2022.
- By visitor demographics, the teenager (13-19) segment generated the highest revenue in 2022.
Market Size & Forecast
- 2032 Projected Market Size: USD 29.15 Billion
- 2022 Market Size: USD 10.86 Billion
- Compound Annual Growth Rate (CAGR) (2023-2032): 10.7%
What is Family Entertainment Center (FEC)
A family entertainment center, or FEC, is a type of venue that provides a range of activities and attractions for families and individuals of all ages. These centers typically offer a variety of activities such as arcade games, mini-golf, laser tag, trampoline parks, bowling, and virtual reality experiences. FECs are designed to provide safe and fun environments for families to spend time together and create lasting memories. FECs often incorporate a range of interactive and immersive experiences, using technology such as augmented and virtual reality to create engaging and exciting experiences.
Many FECs offer food & beverage options, from snack stands to full-service restaurants and bars, providing a complete entertainment experience. Furthermore, FECs cater to a wide range of ages and interests, making them a popular destination for families, birthday parties, corporate events, and social outings. They provide an opportunity for families to spend quality time together while engaging in activities that are both fun and challenging.
Moreover, the FEC industry is constantly evolving, with new attractions and experiences being developed to keep up with changing consumer preferences. FECs often incorporate new technologies and interactive experiences to stay ahead of the curve and provide a unique and exciting experience for visitors. Thus, family entertainment centers provide a safe and enjoyable way for families to spend time together while engaging in a range of fun activities. FECs are a popular destination for families and individuals looking for fun and engaging entertainment with their variety of attractions, food & beverage offerings, and focus on immersive experiences.
One of the major drivers of the family entertainment center market is the favorable youth demographics. The younger generation tends to prioritize experiences over material possessions, which has led to surge in demand for entertainment centers that offer a range of fun and engaging activities. This trend is expected to continue as younger generations grow up and continue to seek out new and exciting entertainment options across North America. Furthermore, increase in number of malls and continuous launch of new FECs supporting family activities, F&B integration, and participatory play in North America are the major driving factors for the market.
However, surge in ticket prices is a major hampering factor for the market. As FECs continue to invest in new technologies and attractions, the cost of visiting these centers has increased. This could lead to a decrease in demand, particularly for families with limited budgets. In addition, rise in popularity of home and mobile gaming is a major restraining factor for the market.
This investment could help FECs differentiate themselves from competitors and provide a unique and memorable experience for visitors, thus providing major lucrative opportunities for the market in the upcoming years. On the basis of visitor demographic, teenagers (13-19) segment holds the largest North America family/indoor entertainment centers market share, owing to variety of game offerings provided by numerous family entertainment centers (FECs).
However, families with children (9-12) segment is expected to grow at the highest rate during the forecast period of North America family/indoor entertainment centers market size, as the families with children of age between 9 and 12 years are more focused on shaping future of their children through numerous activities, whether it is fun or education.
The report focuses on growth prospects, restraints, and trends of the North America family/indoor entertainment centers market analysis. The study provides Porter’s five forces analysis to understand the impact of various factors, such as bargaining power of suppliers, competitive intensity of competitors, threat of new entrants, threat of substitutes, and bargaining power of buyers, on the North America family/indoor entertainment centers market.
By Activity Area
Arcade studios segment accounted for the highest market share in 2022.
North America FEC Market Segment Review
The North America family/indoor entertainment centers market is segmented on the basis of facility size, revenue source, application, type, visitor demographics, and region. In terms of facility size, the market is classified into up to 5,000 sq. ft., 5,001 to 10,000 sq. ft., 10,001 to 20,000 sq. ft., 20,001 to 40,000 sq. ft., 1 to 10 acres, 11 to 30 acres, and over 30 acres. Depending on revenue source, it is divided entry fees and ticket sales, food and beverages, merchandising, advertisement, and others. Depending on application, it is fragmented into arcade studios, AR and VR gaming zones, physical play activities, skill/competition games, and others. The physical play activities segment is further bifurcated into waterplay, adventure and exploration, trampoline and jumping activities, creative and imaginative play and others. On the basis of type, the market is categorized into children entertainment centers (CECS), children edutainment centers (CEDCS), adult entertainment centers (AECS), and location-based entertainment centers (LBECS). By visitor demographics, the market is segregated into families with children (0-8), families with children (9-12), teenagers (13-19), young adults (20-25), and adults (ages 25+). Region-wise, the market is analyzed across North America.
The report analyzes the profiles of key players operating in the North America family/indoor entertainment centers market such as Bowlero, Cinergy Entertainment Group, CEC Entertainment, Inc., Dave and Buster's, Inc., Disney, IPlay America, Main Event Entertainment, SeaWorld Parks & Entertainment, Inc., White Hutchinson Leisure & Learning Group, and Scene75 Entertainment Centers. These players have adopted various business strategies to increase their market penetration and strengthen their position in the North America family/indoor entertainment centers market.
By Type
Children’s Entertainment Centers (CECs) segment accounted for the highest market share in 2022.
What are the Top Impacting Factors in North America FEC Market
Surge in demand for unique experiences in North America
Consumers increasingly seek unique and memorable experiences, and indoor entertainment centers provide a wide range of activities and attractions that can cater to this demand. In addition, as disposable income continues to rise in North America, more families are able to spend money on entertainment activities, including visiting indoor entertainment centers.
In addition, the integration of technology, such as virtual reality and augmented reality into indoor entertainment centers attracts more customers and provides new and exciting experiences. Furthermore, with busy schedules and limited leisure time, many people seek out for convenient and accessible entertainment options that can be enjoyed with family and friends. Indoor entertainment centers can provide a one-stop-shop for a variety of activities, making them an attractive option for busy consumers. Thus, rise in demand for unique experiences in augments the North America family/indoor entertainment centers market growth.
Favorable youth demographics
The major targeted clients of family entertainment centers (FECs) are children aged 8 to 14 years and their parents. The existence of a large young population under the age of 14 in U.S. and Canada fuels the market growth. Furthermore, as per capita disposable income has increased in North America, parents' spending on their children continues to climb, which is anticipated to fuel the expansion of the family/indoor entertainment centers market. In addition, youth is the major customer of indoor entertainment centers, as it makes up to 26% of the global population and often spends time with family and friends.
Furthermore, as younger generations, such as millennials and Gen Z, become a larger part of the population, they are more likely to prioritize experiences over material possessions. This trend fosters the demand for entertainment venues, including indoor entertainment centers. Therefore, the demand for family entertainment centers grows in countries with rich youth population such as U.S. and Canada.
Increase in number of malls in North America
Expansion of the market is being fueled by increase in the number of malls in North America, since FECs are conveniently positioned in malls where customers visit frequently. As the most malls in the world are largely in North America, and the area accounts for approximately 80% of retail space under construction globally, mall development in the region is intensive and well-known. Furthermore, the concept of putting huge FECs in malls has increased in recent years, which in turn, drives the market growth.
As a result, numerous new malls were built with significant space dedicated to FECs. They significantly boost a mall's appeal, enhance consumer retention, and boost income for other tenants. For instance, in December 2022, Supercharged Entertainment, a U.S. based event and party center, opened its second arena in New Jersey's Edison. It was a second center in the U.S. after the opening of the flagship complex in Massachusetts' Wrentham in 2019. The Edison center is spread across 16 acres and has the world's largest indoor and multi-levelled temperature-controlled karting track. Thus, increase in number of malls fuels the growth of North America family/indoor entertainment centers industry.
Which are the Key Companies in North America Family/Indoor Entertainment Centers
The following are the leading companies in the North America family indoor entertainment centre (FEC) market.
Dave and Buster’s, Inc.
KidZania
Cinergy Entertainment Group
Timezone Global
Funriders
Landmark Leisure LLC (Fun City)
Scene75 Entertainment Centers
Lucky Strike Entertainment
CEC Entertainment Concepts, LP.
Smaaash
Market Landscape and Trends
The North America family indoor entertainment centre (FEC) market is a rapidly growing industry that provides a variety of indoor activities for families and individuals of all ages. These centres typically offer a range of activities such as arcade games, mini-golf, laser tag, trampoline parks, bowling, and virtual reality experiences. In recent years, the FEC industry has seen a significant increase in demand due to the growing popularity of indoor activities and the need for family-friendly entertainment options across U.S. and Canada. This growth has been driven by the increase in disposable income and changing consumer preferences, which prioritize experiences over material possessions. The FEC market has also evolved to cater to changing consumer preferences. Many FECs in U.S. are now incorporating new technologies and interactive experiences such as augmented reality and virtual reality. This trend is expected to continue as consumers seek more immersive and engaging experiences.
Furthermore, many FECs now offer full-service restaurants and bars, allowing families to enjoy a meal or snack while participating in activities. This has become a significant revenue driver for FECs in North America. Moreover, the COVID-19 pandemic has had a significant impact on the FEC industry. Many FECs were forced to close temporarily, leading to a decrease in revenue. However, as restrictions have eased, FECs have seen a surge in demand as families seek safe and enjoyable indoor activities.
What are the Key Benefits for Stakeholders
This report provides a quantitative analysis of the market segments, current trends, estimations, and dynamics of the North America family/indoor entertainment centers market forecast from 2023 to 2032 to identify the prevailing North America family/indoor entertainment centers market opportunities.
The market research is offered along with information related to key drivers, restraints, and opportunities.
Porter's five forces analysis highlights the potency of buyers and suppliers to enable stakeholders make profit-oriented business decisions and strengthen their supplier-buyer network.
In-depth analysis of the North America family/indoor entertainment centers market segmentation assists to determine the prevailing market opportunities.
Major countries in each region are mapped according to their revenue contribution to the North America family/indoor entertainment centers market size.
Market player positioning facilitates benchmarking and provides a clear understanding of the present position of the market players.
The report includes the analysis of the regional as well as North America family/indoor entertainment centers market trends, key players, market segments, application areas, and market growth strategies.
North America Family/Indoor Entertainment Centers Market Report Highlights
| Aspects | Details |
| By FACILITY SIZE |
|
| By REVENUE SOURCE |
|
| By ACTIVITY AREA |
|
| By Type |
|
| By VISITOR DEMOGRAPHICS |
|
| By Country |
|
| Key Market Players | Smaaash, Landmark Leisure LLC (Fun City), Lucky Strike Entertainment, Cinergy Entertainment Group, Funriders, Timezone Global, Dave and Buster’s, Inc., KidZania, Scene75 Entertainment Centers, CEC Entertainment Concepts, LP. |
Analyst Review
The North America family entertainment center market has undergone significant changes in recent years, with several key trends emerging. One major trend is the increase in focus on providing unique and immersive experiences. Family entertainment centers in North America have incorporated more interactive and high-tech attractions, such as virtual reality experiences, augmented reality games, and immersive escape rooms, to create an engaging and memorable experience for customers. Furthermore, there is a growth in emphasis on health and wellness. Many entertainment centers have introduced fitness-oriented attractions, such as trampolines, climbing walls, and obstacle courses, to cater to health-conscious customers. In addition, facilities have increasingly offered healthier food options and incorporated sustainability initiatives to promote a healthier lifestyle and reduce their environmental impact.
Moreover, the COVID-19 pandemic has accelerated the adoption of digital technology in North America family entertainment centers market. Many businesses have implemented online booking systems, contactless payments, and virtual queuing to enhance the customer experience while adhering to social distancing measures. The pandemic has spurred innovation in hygiene and sanitation, with family entertainment centers adopting advanced cleaning technologies, such as UV sterilization and electrostatic spraying.
Furthermore, the demand for experiential retail has led to a surge in trend of family entertainment centers partnering with retailers and brands to create unique shopping experiences. Businesses are able to attract a wider range of customers and provide a more engaging and dynamic shopping environment by combining entertainment and retail. Therefore, the family entertainment center market has evolved rapidly, and businesses that embrace these trends and adapt to changes in customer preferences are expected to thrive in the coming years.
Furthermore, market players have adopted various strategies for enhancing their services in the market and improved customer satisfaction. For instance, Cinergy Entertainment Group expanded its presence in the market through new location openings. In April 2021, the company announced the opening of its eighth location in the U.S., in Amarillo, Texas. The new location features several attractions, including a ropes course, laser tag, and a virtual reality gaming area. Furthermore, KidZania has been expanding its global footprint through partnerships and franchise agreements. In February 2021, the company announced partnership with Grupo Sambil, a shopping mall developer in Venezuela, to open a new location in Caracas.
In addition, the company has signed agreements to open new locations in countries such as Japan, Thailand, and Saudi Arabia. Moreover, Dave and Buster's, Inc. has focused on digital initiatives to enhance the customer experience. In March 2021, the company launched a new mobile app that allows customers to view menus, place orders, and pay for their meals and games from their smartphones. Furthermore, the app offers rewards and promotions to incentivize repeat business. Thus, these major market players in North America family entertainment center market have implemented various strategies to adapt to the change in market conditions and attract customers. These strategies range from digital initiatives to global expansion and innovative attraction offerings.
Moreover, some of the key players profiled in the report include Bowlero, Cinergy Entertainment Group, CEC Entertainment, Inc., Dave and Buster's, Inc., Disney, iPlay America, Main Event Entertainment, SeaWorld Parks & Entertainment, Inc., White Hutchinson Leisure & Learning Group, and Scene75 Entertainment Centers. These players have adopted various strategies to increase their market penetration and strengthen their position in industries.
Loading Table Of Content...

