
Family/Indoor Entertainment Centers Market Overview
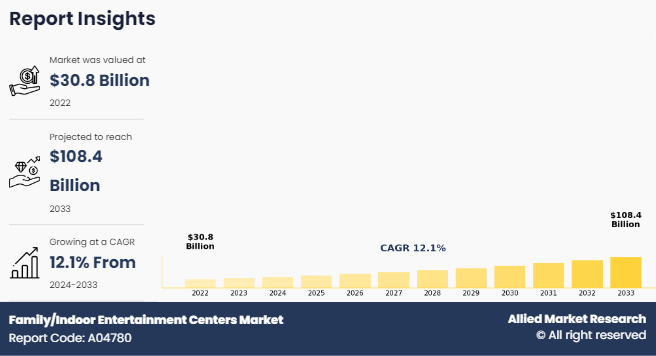
The global family/indoor entertainment centers market was valued at USD 30.8 billion in 2022 and is projected to reach USD 108.4 billion by 2033, growing at a CAGR of 12.1% from 2024 to 2033.
Key Market Insights
- By facility size, 10,001 to 20,000 sq. ft. segment is expected to grow at the highest rate during the forecast period.
- By terms of visitor demographic, families with children (9-12) segment are expected to grow at the highest rate during the forecast period.
- By region, is expected to witness significant growth during the forecast period.
Market Size & Forecast
- 2033 Projected Market Size: USD 108.4 Billion
- 2022 Market Size: USD 30.8 Billion
- Compound Annual Growth Rate (CAGR) (2024-2033): 12.1%
How to Describe Family/Indoor Entertainment Centers
A family indoor entertainment center, or FEC, is a type of indoor venue that provides a range of activities and attractions for families and individuals of all ages. These centers typically offer a variety of activities such as arcade games, mini-golf, laser tag, trampoline parks, bowling, and virtual reality experiences. FECs are designed to provide safe and fun environments for families to spend time together and create lasting memories. FECs often incorporate a range of interactive and immersive experiences, using technology such as augmented and virtual reality to create engaging and exciting experiences. Many FECs offer food and beverage options, from snack stands to full-service restaurants and bars, providing a complete entertainment experience.
Furthermore, FECs cater to a wide range of ages and interests, making them a popular destination for families, birthday parties, corporate events, and social outings. They provide an opportunity for families to spend quality time together while engaging in activities that are both fun and challenging. Moreover, the FEC industry is constantly evolving, with new attractions and experiences being developed to keep up with changing consumer preferences. FECs often incorporate new technologies and interactive experiences to stay ahead of the curve and provide a unique and exciting experience for visitors. Thus, family indoor entertainment centers provide a safe and enjoyable way for families to spend time together while engaging in a range of fun activities. With their variety of attractions, food & beverage offerings, and focus on immersive experiences, FECs are a popular destination for families and individuals looking for fun and engaging indoor entertainment.
Key Takeaways:
By activity area, the basic physical play activities segment accounted for the largest FEC market share in 2022.
By facility size, the 1 to 10 acres segment accounted for the largest FEC market share in 2022.
By visitor demographics, teenagers (12-18) segment accounted for the largest FEC market share in 2022.
By revenue sources, entry fees and ticket sales segment accounted for the largest FEC market share in 2022.
By type, childrens entertainment centers (CECs) segment accounted for the largest revenue FEC market size in 2022.
Region wise, North America generated the highest revenue in 2022.
The report focuses on growth prospects, restraints, and trends of family/indoor entertainment centers market analysis. The study provides Porter’s five forces analysis to understand the impact of various factors, such as bargaining power of suppliers, competitive intensity of competitors, threat of new entrants, threat of substitutes, and bargaining power of buyers, on the family/indoor entertainment centers market.
Segment Review
The family/indoor entertainment centers market is segmented based on activity area, facility size, revenue source, type, visitor demographics, and region. In terms of activity area, the market is classified into arcade studios, AR & VR gaming zones, physical play activities, skill/competition games, and others. Depending on facility size, it is divided into up to 5,000 sq. ft., 5,001 to 10,000 sq. ft., 10,001 to 20,000 sq. ft., 20,001 to 40,000 sq. ft., 1 to 10 acres, 11 to 30 acres, and over 30 acres. Depending on revenue source, it is classified into entry fees & ticket sales, food & beverages, merchandising, advertisement, and others.
On the basis of type, the market is categorized into children’s entertainment centers (CECs), children’s edutainment centers (CEDCs), adult entertainment centres (AECs), and location-based VR entertainment centers (LBECs). In terms of visitor demographics, the market is categorized into families with children (0-9), families with children (9-12), teenagers (12-18), young adults (18-24), and adults (ages 24+). Region-wise, the market is analyzed across North America, Europe, Asia-Pacific, and LAMEA.

On the basis of terms of visitor demographic, teenagers (12-18) segment holds the largest family/indoor entertainment centers market share, owing to variety of game offerings provided by numerous family entertainment centers (FECs). However, families with children (9-12) segment is expected to grow at the highest rate during the forecast period, as the families with children of age between 9 and 12 years are more focused on shaping their children’s future through numerous activities, whether it is fun or education.

Region-wise, the family/indoor entertainment centers market size was dominated by North America in 2022 and is expected to retain its position during the family/indoor entertainment centers market forecast period due to the presence of a large number of players and surge in popularity of adventurous games and sports. However, Asia-Pacific is expected to witness significant growth during the forecast period owing to rise in number of malls in countries such as India, China, and other developing countries.
Which are the Leading Companies in Family/Indoor Entertainment Centers
The following are the leading companies in the market. These players have adopted various strategies to increase their market penetration and strengthen their position in the family/indoor entertainment centers industry.
CEC Entertainment Concepts
LP.
Cinergy Entertainment Group
Landmark Leisure LLC (Fun City)
Funriders
KidZania
Dave
Buster’s, Inc.
Lucky Strike Entertainment
Scene75 Entertainment Centers
Smaaash
Timezone Global.
Recent Developments in the Family/indoor Entertainment Centers Industry:
In April 2023, Chuck E. Cheese unveiled the Brooklyn funcenter and trampoline zone that offers a quieter dining and entertainment environment, dimmed lighting, and a sensory-friendly arcade experience for families.
In October 2023, Toikido, the London-based entertainment company on the cutting edge of digital design and toys, partnered with Chuck E Cheese, the world’s number one global family entertainment fun center, It brought an immersive Piñata Smashlings experience to young fans, in-game and instore, that include the popular entertainment brand’s signature Chuck E Cheese characters’ first official IP integration on Roblox.
In June 2022, Cinergy Entertainment Group, a leader in family entertainment, announced their 10th location, Cinergy Dine-in Cinemas opening in Wheeling, IL. Cinergy Wheeling Dine-Cinemas, which feature in-theater dining, luxury recliner chairs, a spacioussports bar, and a lounge area including pool tables and shuffleboard. The new location will open this summer in Wheeling Town Center.
What are the Key Benefits For Stakeholders:
This report provides a quantitative analysis of the market segments, current trends, estimations, and dynamics of the family/indoor entertainment centers market analysis from 2022 to 2033 to identify the prevailing family/indoor entertainment centers market opportunities.
The market research is offered along with information related to key drivers, restraints, and opportunities.
Porter's five forces analysis highlights the potency of buyers and suppliers to enable stakeholders make profit-oriented business decisions and strengthen their supplier-buyer network.
In-depth analysis of the family/indoor entertainment centers market segmentation assists to determine the prevailing market opportunities and family/Indoor entertainment centers market size.
Major countries in each region are mapped according to their revenue contribution to the global market.
Market player positioning facilitates benchmarking and provides a clear understanding of the present position of the market players.
The report includes the analysis of the regional as well as global family/indoor entertainment centers market trends, key players, market segments, application areas, and family/Indoor entertainment centers market growth strategies.
Family/Indoor Entertainment Centers Market Report Highlights
| Aspects | Details |
| Market Size By 2033 | USD 108.4 billion |
| Growth Rate | CAGR of 12.1% |
| Forecast period | 2022 - 2033 |
| Report Pages | 267 |
| By Activity Area |
|
| By Facility Size |
|
| By Visitor Demographics |
|
| By Revenue Source |
|
| By Type |
|
| By Region |
|
| Key Market Players | CEC Entertainment Concepts, LP., Lucky Strike Entertainment, LLC, KidZania, Cinergy Entertainment Group, Funriders, SMAAASH, Dave and Buster's, Inc., Timezone Entertainment Pvt Ltd., Landmark Leisure LLC., SCENE75 ENTERTAINMENT CENTERS LLC |
Analyst Review
The family/indoor entertainment centers (FECs) market represents a vibrant and expanding segment within the broader leisure and entertainment industry. These centers provide a wide array of recreational activities and attractions, including arcade games, bowling alleys, trampolines, laser tag, mini-golf, virtual reality experiences, and indoor playgrounds, all housed in controlled, indoor environments. FECs have become popular destinations for family outings, birthday parties, corporate events, and social gatherings designed to cater to a diverse audience ranging from children to adults. The market growth is driven by increasing consumer expenditure on leisure activities, rising urbanization, and a growing demand for family-oriented entertainment options. Technological advancements have significantly enhanced the appeal of FECs, with the integration of state-of-the-art gaming technologies and virtual reality providing immersive and engaging experiences for visitors. Themed entertainment centers, which create unique environments based on specific themes such as adventure or fantasy, have also emerged as a notable trend, attracting a wide demographic, particularly among children and young adults. However, the FEC market faces several challenges. High initial investment costs, intense competition from other entertainment options, and the need for continuous innovation to meet evolving consumer preferences are notable constraints. The COVID-19 pandemic further impacted the market, with health concerns and restrictions on indoor gatherings leading to temporary closures and decreased foot traffic. Despite these challenges, the market rebounded as the situation normalized, driven by pent-up demand for social and recreational activities. The FEC market is expected to witness sustained growth, supported by technological advancements, innovative offerings, and a strong consumer desire for engaging, family-friendly entertainment experiences. As operators continue to adapt and innovate, the FEC market is expected to witness further expansion and diversification, solidifying its role as a key player in the leisure and entertainment industry.
Furthermore, market players have adopted various strategies for enhancing their services in the market and improved customer satisfaction. For instance, Cinergy Entertainment Group expanded its presence in the market through new location openings. In April 2021, the company announced the opening of its eighth location in the U.S., in Amarillo, Texas. The new location features several attractions, including a ropes course, laser tag, and a virtual reality gaming area. Furthermore, KidZania has been expanding its global footprint through partnerships and franchise agreements. In February 2021, the company announced partnership with Grupo Sambil, a shopping mall developer in Venezuela, to open a new location in Caracas. In addition, the company signed agreements to open new locations in countries such as Japan, Thailand, and Saudi Arabia. Moreover, Dave and Buster's, Inc. focused on digital initiatives to enhance the customer experience.
The global family/indoor entertainment centers market was valued at $30.8 billion in 2022, and is projected to reach $108.43 billion by 2033, growing at a CAGR of 12.1% from 2024 to 2033.
Increasing consumer spending on leisure & entertainment and technological advancement re the upcoming trends of Family/Indoor Entertainment Centers Market in the globe.
Demand for Family-Oriented Activities is the leading application of Family/Indoor Entertainment Centers Market.
North America is the largest regional market for Family/Indoor Entertainment Centers.
CEC Entertainment Concepts, LP., Cinergy Entertainment Group, Landmark Leisure LLC (Fun City), Funriders, KidZania, Dave and Buster’s, Inc., Lucky Strike Entertainment, Scene75 Entertainment Centers, Smaaash, and Timezone Global are the top companies to hold the market share in Family/Indoor Entertainment Centers.
Loading Table Of Content...
Loading Research Methodology...

