Report Code: A00277 | Oct 2022 | Pages: 300 | ||
Tables: 172 | Charts: 82 |
|
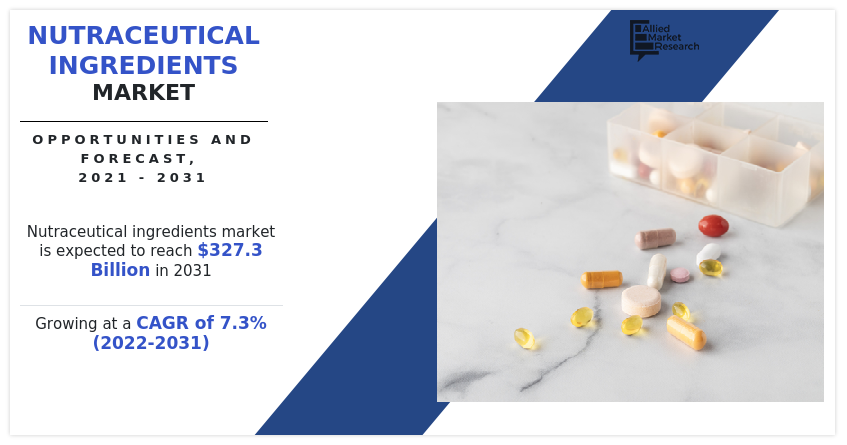
The global nutraceutical ingredients market size was valued at $163.9 billion in 2021, and is projected to reach $327.3 billion by 2031, growing at a CAGR of 7.3% from 2022 to 2031.
Ingredients called nutraceuticals are added to a variety of functional foods and beverages to boost their nutritional value. The finished food item's appearance, flavor, and sensory attributes are also improved. As consumer demand for products with better taste, flavor, and nutrition increases, new products are introduced to the market.
COVID-19 had a moderate impact on the market for nutraceutical ingredients. Nutraceutical ingredients are widely used in a variety of products, including dietary supplements, animal feed, and pharmaceuticals. Products containing nutraceutical ingredients are also used to improve muscle mass and immunity. This factor led to a high demand for nutraceutical ingredients in the market.
Growing customer preference for natural goods is a significant element impacting market expansion. The demand for nutraceuticals is expanding as a result of consumers' rising concerns about preventative healthcare and the effectiveness of these substances on their health. Because more people are consuming functional foods, which in addition to providing essential nourishment also have the potential to benefit health, the demand for nutraceutical ingredients has surged. The vast majority of individuals in today's world suffer from obesity, digestive issues, gastrointestinal infections, and other illnesses. As a result, industry participants are creating nutraceutical substances to aid in the treatment of such illnesses. Currently, the market for nutraceutical ingredients is not being significantly impacted by rising health concerns, but this is anticipated to change soon.
The majority of consumers are oriented toward nutraceutical ingredient products since they are more concerned with improving their health than with spending enormous medical expenditures for therapy. Nutraceuticals are becoming more significant and common in people's daily diets all around the world. Currently, product changes are done in accordance with the prevailing market trend. As a result, functional and nutraceutical foods that target both general and specific health issues can now be produced by large producers thanks to innovation and technology. Additionally, implementing preventative healthcare practices has a significant positive impact on product sales worldwide. One of the fastest-growing industries for beverages is the functional beverage sector, which has development potential in emerging nations. The demand for improved water and ready-to-drink beverages is rising in the functional beverage market.
The nutraceutical ingredients market is analyzed based on type, form, application, and region. By type, the market is divided into probiotics, vitamins, minerals, proteins, dietary fibers, and others. Further, proteins segment is bifurcated into plant proteins and animal proteins. By form, the market is divided into dry and liquid. By application, it is classified into dietary supplements, functional food & beverage, animal nutrition, others. Region wise, the market is analyzed across North America, Europe, Asia-Pacific, and LAMEA.
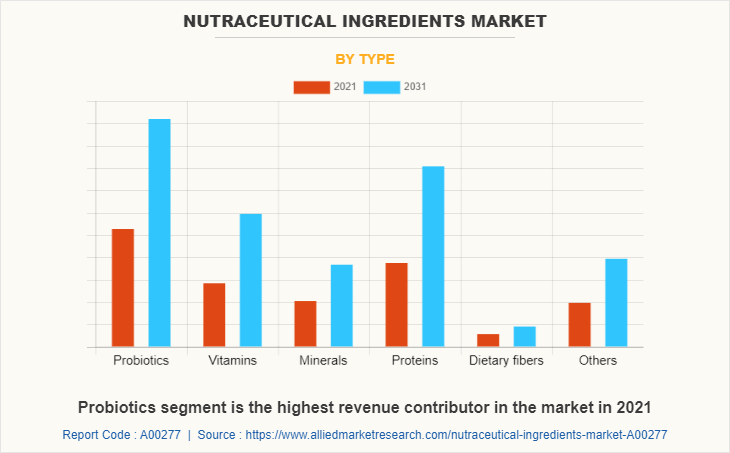
The probiotics segment, as per product type, dominated the global medical nutraceutical ingredients market in 2021 and is anticipated to maintain its dominance throughout the forecast period. Probiotics have positive benefits on the body when ingested in sufficient levels, such as enhanced gut health and decreased intestinal inflammation. Probiotics are essential for preventative healthcare since they boost immune function and stop the development of diseases. Therefore, increasing awareness of preventive healthcare is anticipated to fuel market expansion.
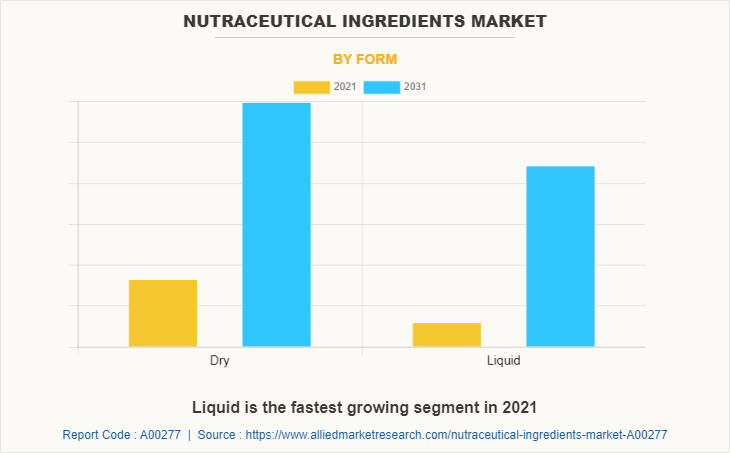
The liquid segment is the fastest growing segment in the global nutraceutical ingredients market. Due to its use in yogurt, the most widely consumed source of probiotics, which is a liquid form of a nutrient, the demand for liquid nutraceutical ingredients has increased as compared to dry nutraceutical ingredients. Kefir water, probiotic juices, and drinks made with yogurt are a few other products that contain liquid ingredients and are all beneficial daily supplements. It is anticipated that in the upcoming years, the Asia-Pacific region would be a significant market for nutraceutical ingredients. Considering how extensively functional food and drink are consumed in China, there is a significant opportunity for both domestic and foreign businesses to enter the nutraceutical ingredients market.
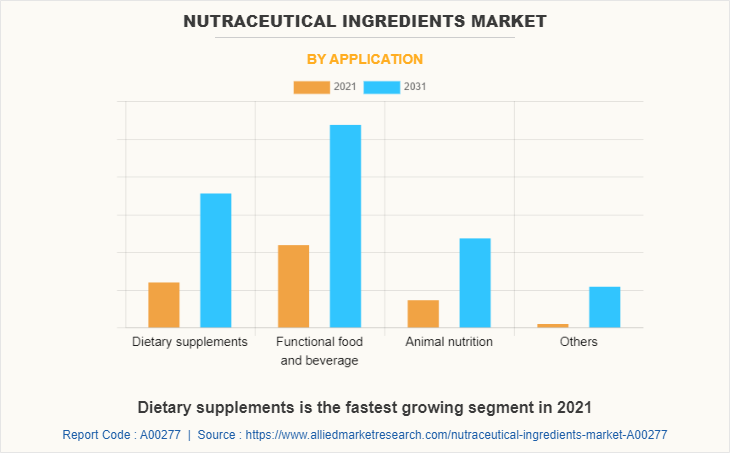
The functional food & beverage segment exhibits the fastest growth in the global nutraceutical ingredients market. Some of the factors affecting the market for nutraceutical ingredients include awareness, belief in their efficacy, and safety. Dairy products, non-dairy beverages, cereals, and newborn formula are just a few of the functional food and beverage applications where nutraceutical additives are being used on a large scale.
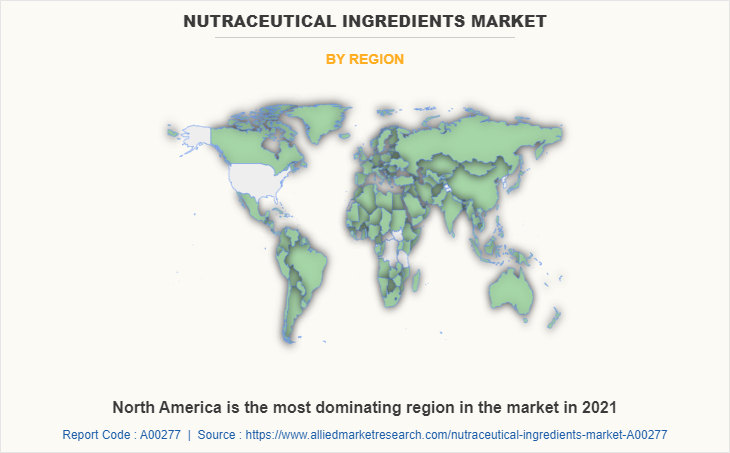
Region wise, North America dominated the market with the largest share during the nutraceutical ingredients market forecast period. The nutraceutical ingredients market growth in this region is attributed to an increase in the usage of dietary supplements since people are becoming more aware of the health advantages of taking them because they include nutrients, primarily minerals and vitamins. 80% of American adults use dietary supplements, according to U.S. Pharmacopeia Convection.
In addition, Asia-Pacific region is the fastest growing region in the global nutraceutical ingredients market. Convenience food consumption has increased as a result of busy lifestyles, and the region's economies have grown more rapidly. This has increased demand for enriched nutritional food and beverage items. Another important factor likely fueling nutraceutical ingredients market expansion in the Middle East & Africa and the Asia-Pacific is growing consumer expenditure on health and wellness products as a result of changing lifestyles and rising disposable income.
The nutraceutical ingredients market demand has grown significantly across all age groups, and this demand has grown significantly faster than the world average disposable income. Global consumers are more concerned about changes in their quality of life and are paying close attention to the foods they eat. The market for nutraceutical ingredients will have abundant growth opportunities as a result of the strong customer base for fortified foods from emerging markets. One of the key elements boosting the usage of nutraceutical ingredients is the rising demand for bread and confectionery products. Soluble nutraceutical ingredients are frequently used in baking and confectionery to fortify and increase the nutritional value of products.
The global market for nutraceutical ingredients is expanding favorably due to a wide range of driving factors. An important reason in the market's expansion has been the rising incidence of chronic illnesses and diseases. This has raised awareness about leading a healthy lifestyle and eating well. Non-communicable diseases have significantly increased in prevalence in recent years. The majority of cases are brought on by evolving lifestyles that are predominately unhealthy. Naturally, this has contributed to the rise in demand for nutraceutical substances that aid in the prevention of such disorders. As a result, the market has recently experienced a significant expansion.
The efforts made by governments throughout the world to promote its use is an significant factor driving the growth of the global market for nutraceutical ingredients. This has aided in raising awareness and making them more widely accessible. This has also fueled the growth of the market for nutraceutical ingredients globally. Additionally, the global market is being fueled by the expanding developments in the healthcare industry.
One of the main factors influencing market expansion is consumers' growing preference for natural products. The industry is expanding as a result of consumers' increased concerns about preventative healthcare and the benefits of probiotic bacteria. Increased intake of functional foods, which in addition to providing essential nourishment, have the potential to promote health, has led to an increase in the demand for probiotics. Obesity, digestive problems, gastrointestinal infections, vaginal infections, and other illnesses affect the majority of people today. Market participants have created probiotic products to assist in the treatment of such disorders in light of this. The rise in health concerns has had a modest effect on the probiotics business, but it is anticipated to grow rapidly.
The major players analyzed for the nutraceutical ingredients industry Amway Corporation, AOR Inc., Archer Daniels Midland, Cargill Incorporated, Danone, EID Parry, General Mills, Herbalife International of America Inc., Innophos, Matsun Nutrition, Mead Johnson, Nestle SA, Natrol, Royal DSM, and Valensa International. Key players operating in the nutraceutical ingredients market have adopted product launch, business expansion, and mergers & acquisitions as key strategies to expand their nutraceutical ingredients market share, increase profitability, and remain competitive in the market. In order to get an advantage over rival manufacturers in the market, they are primarily focused on improving the quality of their products. Manufacturers have an advantage in expanding their product line internationally due to an advanced distribution network and manufacturing knowledge and expertise.
Nutraceutical Ingredients Market Report Highlights
Aspects | Details |
---|---|
Market Size By 2031 | USD 327.3 billion |
Growth Rate | CAGR of 7.3% |
Forecast period | 2021 - 2031 |
Report Pages | 300 |
By Application |
|
By Type |
|
By Form |
|
By Region |
|
Key Market Players | Danone, Archer Daniels Midland Company, Herbalife Ltd., AMWAY CORPORATION, natrol, inc., , Nestle S.A., aor international, valensa international, Royal DSM, Innophos Holdings Inc, EID Parry India Ltd, General Mills, Inc., Matsun Nutrition, Mead Johnson, Cargill, Incorporated |
CHAPTER 1:INTRODUCTION
1.1.Report description
1.2.Key benefits for stakeholders
1.3.Key market segments
1.4.Research methodology
1.4.1.Secondary research
1.4.2.Primary research
1.4.3.Analyst tools and models
CHAPTER 2:EXECUTIVE SUMMARY
2.1.Snapshot
2.2.Key findings
2.2.1.Top investment pocket
2.3.CXO perspective
CHAPTER 3:MARKET OVERVIEW
3.1.Market definition and scope
3.2.Key forces shaping global nutraceutical ingredients industry/market
3.2.1.Bargaining power of suppliers
3.2.2.Bargaining power of buyers
3.2.3.Threat of new entrants
3.2.4.Threat of substitutes
3.2.5.Intensity of competitive rivalry
3.3.Market dynamics
3.3.1.Drivers
3.3.1.1.Growth in demand for functional food
3.3.1.2.Rise in non-communicable chronic diseases
3.3.1.3.Growth in investments in R&D activities
3.3.2.Restraints
3.3.2.1.Low awareness level among consumers about effectiveness of nutraceutical ingredients
3.3.2.2.Government regulations
3.3.3.Opportunities
3.3.3.1.Increase in use of nutraceutical ingredients in food and beverages products
3.3.3.2.Increase in demand from developing economies
3.4.COVID-19 impact analysis
3.5.Value chain analysis
3.6.Industry pain-point analysis
3.7.Market share analysis, 2021-2031
CHAPTER 4:NUTRACEUTICALS INGREDIENTS MARKET, BY TYPE
4.1.Overview
4.1.1.Market size and forecast
4.2.Probiotics
4.2.1.Key market trends, growth factors, and opportunities
4.2.2.Market size and forecast
4.2.3.Market analysis, by country
4.3.Vitamins
4.3.1.Key market trends, growth factors, and opportunities
4.3.2.Market size and forecast
4.3.3.Market analysis, by country
4.4.Minerals
4.4.1.Key market trends, growth factors, and opportunities
4.4.2.Market size and forecast
4.4.3.Market analysis, by country
4.5.Proteins
4.5.1.Key market trends, growth factors, and opportunities
4.5.2.Market size and forecast
4.5.2.1.Plant proteins
4.5.2.2.Animal proteins
4.5.3.Market analysis, by country
4.6.Dietary fibers
4.6.1.Key market trends, growth factors, and opportunities
4.6.2.Market size and forecast
4.6.3.Market analysis, by country
4.7.Others
4.7.1.Key market trends, growth factors, and opportunities
4.7.2.Market size and forecast
4.7.3.Market analysis, by country
CHAPTER 5:NUTRACEUTICALS INGREDIENTS MARKET, BY FORM
5.1.Overview
5.1.1.Market size and forecast
5.2.Dry
5.2.1.Key market trends, growth factors, and opportunities
5.2.2.Market size and forecast
5.2.3.Market analysis, by country
5.3.Liquid
5.3.1.Key market trends, growth factors, and opportunities
5.3.2.Market size and forecast
5.3.3.Market analysis, by country
CHAPTER 6:NUTRACEUTICALS INGREDIENTS MARKET, BY APPLICATION
6.1.Overview
6.1.1.Market size and forecast
6.2.Dietary supplements
6.2.1.Key market trends, growth factors, and opportunities
6.2.2.Market size and forecast
6.2.3.Market analysis, by country
6.3.Functional food and beverage
6.3.1.Key market trends, growth factors, and opportunities
6.3.2.Market size and forecast
6.3.3.Market analysis, by country
6.4.Animal nutrition
6.4.1.Key market trends, growth factors, and opportunities
6.4.2.Market size and forecast
6.4.3.Market analysis, by country
6.5.Others
6.5.1.Key market trends, growth factors, and opportunities
6.5.2.Market size and forecast
6.5.3.Market analysis, by country
CHAPTER 7:NUTRACEUTICALS INGREDIENTS MARKET, BY REGION
7.1.Overview
7.1.1.Market size and forecast
7.2.North America
7.2.1.Key market trends, growth factors, and opportunities
7.2.2.Market size and forecast, by type
7.2.2.1.Market size and forecast, by sub-type
7.2.3.Market size and forecast, by form
7.2.4.Market size and forecast, by application
7.2.5.Market size and forecast, by country
7.2.5.1.U.S.
7.2.5.1.1.Market size and forecast, by type
7.2.5.1.2.Market size and forecast, by form
7.2.5.1.3.Market size and forecast, by application
7.2.5.2.Canada
7.2.5.2.1.Market size and forecast, by type
7.2.5.2.2.Market size and forecast, by form
7.2.5.2.3.Market size and forecast, by application
7.2.5.3.Mexico
7.2.5.3.1.Market size and forecast, by type
7.2.5.3.2.Market size and forecast, by form
7.2.5.3.3.Market size and forecast, by application
7.3.Europe
7.3.1.Key market trends, growth factors, and opportunities
7.3.2.Market size and forecast, by type
7.3.2.1.Market size and forecast, by sub-type
7.3.3.Market size and forecast, by form
7.3.4.Market size and forecast, by application
7.3.5.Market size and forecast, by country
7.3.5.1.UK
7.3.5.1.1.Market size and forecast, by type
7.3.5.1.2.Market size and forecast, by form
7.3.5.1.3.Market size and forecast, by application
7.3.5.2.Finland
7.3.5.2.1.Market size and forecast, by type
7.3.5.2.2.Market size and forecast, by form
7.3.5.2.3.Market size and forecast, by application
7.3.5.3.Spain
7.3.5.3.1.Market size and forecast, by type
7.3.5.3.2.Market size and forecast, by form
7.3.5.3.3.Market size and forecast, by application
7.3.5.4.Germany
7.3.5.4.1.Market size and forecast, by type
7.3.5.4.2.Market size and forecast, by form
7.3.5.4.3.Market size and forecast, by application
7.3.5.5.France
7.3.5.5.1.Market size and forecast, by type
7.3.5.5.2.Market size and forecast, by form
7.3.5.5.3.Market size and forecast, by application
7.3.5.6.Italy
7.3.5.6.1.Market size and forecast, by type
7.3.5.6.2.Market size and forecast, by form
7.3.5.6.3.Market size and forecast, by application
7.3.5.7.Rest of Europe
7.3.5.7.1.Market size and forecast, by type
7.3.5.7.2.Market size and forecast, by form
7.3.5.7.3.Market size and forecast, by application
7.4.Asia-Pacific
7.4.1.Key market trends, growth factors, and opportunities
7.4.2.Market size and forecast, by type
7.4.2.1.Market size and forecast, by sub-type
7.4.3.Market size and forecast, by form
7.4.4.Market size and forecast, by application
7.4.5.Market size and forecast, by country
7.4.5.1.China
7.4.5.1.1.Market size and forecast, by type
7.4.5.1.2.Market size and forecast, by form
7.4.5.1.3.Market size and forecast, by application
7.4.5.2.Japan
7.4.5.2.1.Market size and forecast, by type
7.4.5.2.2.Market size and forecast, by form
7.4.5.2.3.Market size and forecast, by application
7.4.5.3.India
7.4.5.3.1.Market size and forecast, by type
7.4.5.3.2.Market size and forecast, by form
7.4.5.3.3.Market size and forecast, by application
7.4.5.4.South Korea
7.4.5.4.1.Market size and forecast, by type
7.4.5.4.2.Market size and forecast, by form
7.4.5.4.3.Market size and forecast, by application
7.4.5.5.Australia
7.4.5.5.1.Market size and forecast, by type
7.4.5.5.2.Market size and forecast, by form
7.4.5.5.3.Market size and forecast, by application
7.4.5.6.New Zealand
7.4.5.6.1.Market size and forecast, by type
7.4.5.6.2.Market size and forecast, by form
7.4.5.6.3.Market size and forecast, by application
7.4.5.7.Rest of Asia-Pacific
7.4.5.7.1.Market size and forecast, by type
7.4.5.7.2.Market size and forecast, by form
7.4.5.7.3.Market size and forecast, by application
7.5.LAMEA
7.5.1.Key market trends, growth factors, and opportunities
7.5.2.Market size and forecast, by type
7.5.2.1.Market size and forecast, by sub-type
7.5.3.Market size and forecast, by form
7.5.4.Market size and forecast, by application
7.5.5.Market size and forecast, by country
7.5.5.1.Brazil
7.5.5.1.1.Market size and forecast, by type
7.5.5.1.2.Market size and forecast, by form
7.5.5.1.3.Market size and forecast, by application
7.5.5.2.South Africa
7.5.5.2.1.Market size and forecast, by type
7.5.5.2.2.Market size and forecast, by form
7.5.5.2.3.Market size and forecast, by application
7.5.5.3.Saudi Arabia
7.5.5.3.1.Market size and forecast, by type
7.5.5.3.2.Market size and forecast, by nature
7.5.5.3.3.Market size and forecast, by application
7.5.5.4.Rest of LAMEA
7.5.5.4.1.Market size and forecast, by type
7.5.5.4.2.Market size and forecast, by form
7.5.5.4.3.Market size and forecast, by application
CHAPTER 8:COMPETITION LANDSCAPE
8.1.Competitive dashboard
8.2.Competitive heat map
8.3.Product mapping
8.4.Top winning strategies
8.5.Top Player Positioning
CHAPTER 9:COMPANY PROFILES
9.1.AMWAY CORPORATION (AMWAY)
9.1.1.Company overview
9.1.2.Key Executives
9.1.3.Company snapshot
9.1.4.Product portfolio
9.1.5.Key strategic moves and developments
9.2.AOR INC
9.2.1.Company overview
9.2.2.Key executives
9.2.3.Company snapshot
9.2.4.Operating business segments
9.2.5.Product portfolio
9.3.ARCHER DANIELS MIDLAND COMPANY
9.3.1.Company overview
9.3.2.Key executive
9.3.3.Company snapshot
9.3.4.Operating business segments
9.3.5.Product portfolio
9.3.6.R&D expenditure
9.3.7.Business performance
9.3.8.Key strategic moves and developments
9.4.CARGILL, INC.
9.4.1.Company overview
9.4.2.Key executives
9.4.3.Company snapshot
9.4.4.Operating business segments
9.4.5.Product portfolio
9.4.6.Business performance
9.4.7.Key strategic moves and developments
9.5.DANONE
9.5.1.Company overview
9.5.2.Key Executives
9.5.3.Company snapshot
9.5.4.Operating business segments
9.5.5.Product portfolio
9.5.6.Business performance
9.5.7.Key strategic moves and developments
9.6.E.I.D PARRY LTD
9.6.1.Company overview
9.6.2.Key executives
9.6.3.Company snapshot
9.6.4.Operating business segments
9.6.5.Product portfolio
9.6.6.Business performance
9.7.GENERAL MILLS INC
9.7.1.Company overview
9.7.2.Key executives
9.7.3.Company snapshot
9.7.4.Operating business segments
9.7.5.Product portfolio
9.7.6.R&D expenditure
9.7.7.Business performance
9.7.8.Key strategic moves and developments
9.7.9.Key Innovations and its Impact Over the Market
9.8.HERBALIFE INTERNATIONAL OF AMERICA INC.
9.8.1.Company overview
9.8.2.Key Executives
9.8.3.Company snapshot
9.8.4.Product portfolio
9.8.5.Business performance
9.8.6.Key strategic moves and developments
9.9.INNOPHOS
9.9.1.Company overview
9.9.2.Key executives
9.9.3.Company snapshot
9.9.4.Operating business segments
9.9.5.Product portfolio
9.10.KONINKLIJKE DSM N.V.
9.10.1.Company overview
9.10.2.Key executive
9.10.3.Company snapshot
9.10.4.Operating business segments
9.10.5.Product portfolio
9.10.6.R&D expenditure
9.10.7.Business performance
9.10.8.Key strategic moves and developments
9.11.MATSUN NUTRITION
9.11.1.Company overview
9.11.2.Key executives
9.11.3.Company snapshot
9.11.4.Operating business segments
9.11.5.Product portfolio
9.12.MEAD JOHNSON NUTRITION
9.12.1.Company overview
9.12.2.Key executives
9.12.3.Company snapshot
9.12.4.Operating business segments
9.12.5.Product portfolio
9.12.6.Key Innovations and its Impact Over the Market
9.13.NATROL INC
9.13.1.Company overview
9.13.2.Key executives
9.13.3.Company snapshot
9.13.4.Operating business segments
9.13.5.Product portfolio
9.14.NESTLE S.A.
9.14.1.Company overview
9.14.2.Key Executives
9.14.3.Company snapshot
9.14.4.Operating business segments
9.14.5.Product portfolio
9.14.6.R&D Expenditure
9.14.7.Business performance
9.14.8.Key strategic moves and developments
9.15.VALENSA INTERNATIONAL
9.15.1.Company overview
9.15.2.Key executives
9.15.3.Company snapshot
9.15.4.Operating business segments
9.15.5.Product portfolio
LIST OF TABLES
TABLE 01.GLOBAL NUTRACEUTICALS INGREDIENTS MARKET BY TYPE, 2021–2031 ($MILLION)
TABLE 02.PROBIOTICS MARKET, BY REGION, 2021–2031 ($MILLION)
TABLE 03.VITAMINS MARKET, BY REGION, 2021–2031 ($MILLION)
TABLE 04.MINERALS MARKET, BY REGION, 2021–2031 ($MILLION)
TABLE 05.PROTEINS MARKET, BY REGION, 2021–2031 ($MILLION)
TABLE 06.GLOBAL PROTEINS NUTRACEUTICALS INGREDIENTS MARKET, BY SUB-TYPE, 2021–2031 ($MILLION)
TABLE 07.PLANT PROTEINS MARKET, BY REGION, 2021–2031 ($MILLION)
TABLE 08.ANIMAL PROTEINS MARKET, BY REGION, 2021–2031 ($MILLION)
TABLE 09.DIETARY FIBERS MARKET, BY REGION, 2021–2031 ($MILLION)
TABLE 10.OTHERS MARKET, BY REGION, 2021–2031 ($MILLION)
TABLE 11.GLOBAL NUTRACEUTICALS INGREDIENTS MARKET, BY FORM, 2021–2031 ($MILLION)
TABLE 12.DRY NUTRACEUTICALS INGREDIENTS MARKET, BY REGION, 2021–2031 ($MILLION)
TABLE 13.LIQUID NUTRACEUTICALS INGREDIENTS MARKET, BY REGION, 2021–2031 ($MILLION)
TABLE 14.GLOBAL NUTRACEUTICALS INGREDIENTS MARKET, BY APPLICATION, 2021–2031 ($MILLION)
TABLE 15.DIETARY SUPPLEMENTS NUTRACEUTICALS INGREDIENTS MARKET, BY REGION, 2021–2031 ($MILLION)
TABLE 16.FUNCTIONAL FOOD AND BEVERAGE NUTRACEUTICALS INGREDIENTS MARKET, BY REGION, 2021–2031 ($MILLION)
TABLE 17.ANIMAL NUTRITION NUTRACEUTICALS INGREDIENTS MARKET, BY REGION, 2021–2031 ($MILLION)
TABLE 18.OTHERS MARKET, BY REGION, 2021–2031 ($MILLION)
TABLE 19.NUTRACEUTICALS INGREDIENTS MARKET, BY REGION, 2021–2031 ($MILLION)
TABLE 20.NORTH AMERICA NUTRACEUTICALS INGREDIENTS MARKET, BY TYPE, 2021–2031 ($MILLION)
TABLE 21.NORTH AMERICA PROTEINS NUTRACEUTICALS INGREDIENTS MARKET, BY SUB-TYPE, 2021–2031 ($MILLION)
TABLE 22.NORTH AMERICA NUTRACEUTICALS INGREDIENTS MARKET, BY FORM, 2021–2031 ($MILLION)
TABLE 23.NORTH AMERICA NUTRACEUTICALS INGREDIENTS MARKET, BY APPLICATION, 2021–2031 ($MILLION)
TABLE 24.NORTH AMERICA NUTRACEUTICALS INGREDIENTS MARKET, BY COUNTRY, 2021–2031 ($MILLION)
TABLE 25.U.S. NUTRACEUTICALS INGREDIENTS MARKET, BY TYPE, 2021–2031 ($MILLION)
TABLE 26.U.S. NUTRACEUTICALS INGREDIENTS MARKET, BY FORM, 2021–2031 ($MILLION)
TABLE 27.U.S. NUTRACEUTICALS INGREDIENTS MARKET, BY APPLICATION, 2021–2031 ($MILLION)
TABLE 28.CANADA NUTRACEUTICALS INGREDIENTS MARKET, BY TYPE, 2021–2031 ($MILLION)
TABLE 29.CANADA NUTRACEUTICALS INGREDIENTS MARKET, BY FORM, 2021–2031 ($MILLION)
TABLE 30.CANADA NUTRACEUTICALS INGREDIENTS MARKET, BY APPLICATION, 2021–2031 ($MILLION)
TABLE 31.MEXICO NUTRACEUTICALS INGREDIENTS MARKET, BY TYPE, 2021–2031 ($MILLION)
TABLE 32.MEXICO NUTRACEUTICALS INGREDIENTS MARKET, BY FORM, 2021–2031 ($MILLION)
TABLE 33.MEXICO NUTRACEUTICALS INGREDIENTS MARKET, BY APPLICATION, 2021–2031 ($MILLION)
TABLE 34.EUROPE NUTRACEUTICALS INGREDIENTS MARKET, BY TYPE, 2021–2031 ($MILLION)
TABLE 35.EUROPE PROTEINS NUTRACEUTICALS INGREDIENTS MARKET, BY SUB-TYPE, 2021–2031 ($MILLION)
TABLE 36.EUROPE NUTRACEUTICALS INGREDIENTS MARKET, BY FORM, 2021–2031 ($MILLION)
TABLE 37.EUROPE NUTRACEUTICALS INGREDIENTS MARKET, BY APPLICATION, 2021–2031 ($MILLION)
TABLE 38.EUROPE NUTRACEUTICALS INGREDIENTS MARKET, BY COUNTRY, 2021–2031 ($MILLION)
TABLE 39.UK NUTRACEUTICALS INGREDIENTS MARKET, BY TYPE, 2021–2031 ($MILLION)
TABLE 40.UK NUTRACEUTICALS INGREDIENTS MARKET, BY FORM, 2021–2031 ($MILLION)
TABLE 41.UK NUTRACEUTICALS INGREDIENTS MARKET, BY APPLICATION, 2021–2031 ($MILLION)
TABLE 42.FINLAND NUTRACEUTICALS INGREDIENTS MARKET, BY TYPE, 2021–2031 ($MILLION)
TABLE 43.FINLAND NUTRACEUTICALS INGREDIENTS MARKET, BY FORM, 2021–2031 ($MILLION)
TABLE 44.FINLAND NUTRACEUTICALS INGREDIENTS MARKET, BY APPLICATION, 2021–2031 ($MILLION)
TABLE 45.SPAIN NUTRACEUTICALS INGREDIENTS MARKET, BY TYPE, 2021–2031 ($MILLION)
TABLE 46.SPAIN NUTRACEUTICALS INGREDIENTS MARKET, BY FORM, 2021–2031 ($MILLION)
TABLE 47.SPAIN NUTRACEUTICALS INGREDIENTS MARKET, BY APPLICATION, 2021–2031 ($MILLION)
TABLE 48.GERMANY NUTRACEUTICALS INGREDIENTS MARKET, BY TYPE, 2021–2031 ($MILLION)
TABLE 49.GERMANY NUTRACEUTICALS INGREDIENTS MARKET, BY FORM, 2021–2031 ($MILLION)
TABLE 50.GERMANY NUTRACEUTICALS INGREDIENTS MARKET, BY APPLICATION, 2021–2031 ($MILLION)
TABLE 51.FRANCE NUTRACEUTICALS INGREDIENTS MARKET, BY TYPE, 2021–2031 ($MILLION)
TABLE 52.FRANCE NUTRACEUTICALS INGREDIENTS MARKET, BY FORM, 2021–2031 ($MILLION)
TABLE 53.FRANCE NUTRACEUTICALS INGREDIENTS MARKET, BY APPLICATION, 2021–2031 ($MILLION)
TABLE 54.ITALY NUTRACEUTICALS INGREDIENTS MARKET, BY TYPE, 2021–2031 ($MILLION)
TABLE 55.ITALY NUTRACEUTICALS INGREDIENTS MARKET, BY FORM, 2021–2031 ($MILLION)
TABLE 56.ITALY NUTRACEUTICALS INGREDIENTS MARKET, BY APPLICATION, 2021–2031 ($MILLION)
TABLE 57.REST OF EUROPE NUTRACEUTICALS INGREDIENTS MARKET, BY TYPE, 2021–2031 ($MILLION)
TABLE 58.REST OF EUROPE NUTRACEUTICALS INGREDIENTS MARKET, BY FORM, 2021–2031 ($MILLION)
TABLE 59.REST OF EUROPE NUTRACEUTICALS INGREDIENTS MARKET, BY APPLICATION, 2021–2031 ($MILLION)
TABLE 60.ASIA-PACIFIC NUTRACEUTICALS INGREDIENTS MARKET, BY TYPE, 2021–2031 ($MILLION)
TABLE 61.ASIA-PACIFIC PROTEINS NUTRACEUTICALS INGREDIENTS MARKET, BY SUB-TYPE, 2021–2031 ($MILLION)
TABLE 62.ASIA-PACIFIC NUTRACEUTICALS INGREDIENTS MARKET, BY FORM, 2021–2031 ($MILLION)
TABLE 63.ASIA-PACIFIC NUTRACEUTICALS INGREDIENTS MARKET, BY APPLICATION, 2021–2031 ($MILLION)
TABLE 64.ASIA-PACIFIC NUTRACEUTICALS INGREDIENTS MARKET, BY COUNTRY, 2021–2031 ($MILLION)
TABLE 65.CHINA NUTRACEUTICALS INGREDIENTS MARKET, BY TYPE, 2021–2031 ($MILLION)
TABLE 66.CHINA NUTRACEUTICALS INGREDIENTS MARKET, BY FORM, 2021–2031 ($MILLION)
TABLE 67.CHINA NUTRACEUTICALS INGREDIENTS MARKET, BY APPLICATION, 2021–2031 ($MILLION)
TABLE 68.JAPAN NUTRACEUTICALS INGREDIENTS MARKET, BY TYPE, 2021–2031 ($MILLION)
TABLE 69.JAPAN NUTRACEUTICALS INGREDIENTS MARKET, BY FORM, 2021–2031 ($MILLION)
TABLE 70.JAPAN NUTRACEUTICALS INGREDIENTS MARKET, BY APPLICATION, 2021–2031 ($MILLION)
TABLE 71.INDIA NUTRACEUTICALS INGREDIENTS MARKET, BY TYPE, 2021–2031 ($MILLION)
TABLE 72.INDIA NUTRACEUTICALS INGREDIENTS MARKET, BY FORM, 2021–2031 ($MILLION)
TABLE 73.INDIA NUTRACEUTICALS INGREDIENTS MARKET, BY APPLICATION, 2021–2031 ($MILLION)
TABLE 74.SOUTH KOREA NUTRACEUTICALS INGREDIENTS MARKET, BY TYPE, 2021–2031 ($MILLION)
TABLE 75.SOUTH KOREA NUTRACEUTICALS INGREDIENTS MARKET, BY FORM, 2021–2031 ($MILLION)
TABLE 76.SOUTH KOREA NUTRACEUTICALS INGREDIENTS MARKET, BY APPLICATION, 2021–2031 ($MILLION)
TABLE 77.AUSTRALIA NUTRACEUTICALS INGREDIENTS MARKET, BY TYPE, 2021–2031 ($MILLION)
TABLE 78.AUSTRALIA NUTRACEUTICALS INGREDIENTS MARKET, BY FORM, 2021–2031 ($MILLION)
TABLE 79.AUSTRALIA NUTRACEUTICALS INGREDIENTS MARKET, BY APPLICATION, 2021–2031 ($MILLION)
TABLE 80.NEW ZEALAND NUTRACEUTICALS INGREDIENTS MARKET, BY TYPE, 2021–2031 ($MILLION)
TABLE 81.NEW ZEALAND NUTRACEUTICALS INGREDIENTS MARKET, BY FORM, 2021–2031 ($MILLION)
TABLE 82.NEW ZEALAND NUTRACEUTICALS INGREDIENTS MARKET, BY APPLICATION, 2021–2031 ($MILLION)
TABLE 83.REST OF ASIA-PACIFIC NUTRACEUTICALS INGREDIENTS MARKET, BY TYPE, 2021–2031 ($MILLION)
TABLE 84.REST OF ASIA-PACIFIC NUTRACEUTICALS INGREDIENTS MARKET, BY FORM, 2021–2031 ($MILLION)
TABLE 85.REST OF ASIA-PACIFIC NUTRACEUTICALS INGREDIENTS MARKET, BY APPLICATION, 2021–2031 ($MILLION)
TABLE 86.LAMEA NUTRACEUTICALS INGREDIENTS MARKET, BY TYPE, 2021–2031 ($MILLION)
TABLE 87.LAMEA PROTEINS NUTRACEUTICALS INGREDIENTS MARKET, BY SUB-TYPE, 2021–2031 ($MILLION)
TABLE 88.LAMEA NUTRACEUTICALS INGREDIENTS MARKET, BY FORM, 2021–2031 ($MILLION)
TABLE 89.LAMEA NUTRACEUTICALS INGREDIENTS MARKET, BY APPLICATION, 2021–2031 ($MILLION)
TABLE 90.LAMEA NUTRACEUTICALS INGREDIENTS MARKET, BY COUNTRY, 2021–2031 ($MILLION)
TABLE 91.BRAZIL NUTRACEUTICALS INGREDIENTS MARKET, BY TYPE, 2021–2031 ($MILLION)
TABLE 92.BRAZIL NUTRACEUTICALS INGREDIENTS MARKET, BY FORM, 2021–2031 ($MILLION)
TABLE 93.BRAZIL NUTRACEUTICALS INGREDIENTS MARKET, BY APPLICATION, 2021–2031 ($MILLION)
TABLE 94.SOUTH AFRICA NUTRACEUTICALS INGREDIENTS MARKET, BY TYPE, 2021–2031 ($MILLION)
TABLE 95.SOUTH AFRICA NUTRACEUTICALS INGREDIENTS MARKET, BY FORM, 2021–2031 ($MILLION)
TABLE 96.SOUTH AFRICA NUTRACEUTICALS INGREDIENTS MARKET, BY APPLICATION, 2021–2031 ($MILLION)
TABLE 97.SAUDI ARABIA NUTRACEUTICALS INGREDIENTS MARKET, BY TYPE, 2021–2031 ($MILLION)
TABLE 98.SAUDI ARABIA NUTRACEUTICALS INGREDIENTS MARKET, BY END-USER, 2021–2031 ($MILLION)
TABLE 99.SAUDI ARABIA NUTRACEUTICALS INGREDIENTS MARKET, BY APPLICATION, 2021–2031 ($MILLION)
TABLE 100.REST OF LAMEA NUTRACEUTICALS INGREDIENTS MARKET, BY TYPE, 2021–2031 ($MILLION)
TABLE 101.REST OF LAMEA NUTRACEUTICALS INGREDIENTS MARKET, BY FORM, 2021–2031 ($MILLION)
TABLE 102.REST OF LAMEA NUTRACEUTICALS INGREDIENTS MARKET, BY APPLICATION, 2021–2031 ($MILLION)
TABLE 103.AMWAY: KEY EXECUTIVES
TABLE 104.AMWAY: COMPANY SNAPSHOT
TABLE 105.AMWAY: PRODUCT PORTFOLIO
TABLE 106.AOR INC: KEY EXECUTIVES
TABLE 107.AOR INC: COMPANY SNAPSHOT
TABLE 108.AOR INC: OPERATING SEGMENTS
TABLE 109.AOR INC: PRODUCT PORTFOLIO
TABLE 110.ARCHER DANIELS MIDLAND COMPANY: KEY EXECUTIVE
TABLE 111.ARCHER DANIELS MIDLAND COMPANY: COMPANY SNAPSHOT
TABLE 112.ARCHER DANIELS MIDLAND COMPANY: OPERATING SEGMENTS
TABLE 113.ARCHER DANIELS MIDLAND COMPANY: PRODUCT PORTFOLIO
TABLE 114.ARCHER DANIELS MIDLAND COMPANY: R&D EXPENDITURE, 2019-2021 ($MILLION)
TABLE 115.ARCHER DANIELS MIDLAND COMPANY: NET SALES, 2019-2021 ($MILLION)
TABLE 116.CARGILL, INC.: KEY EXECUTIVES
TABLE 117.CARGILL, INC.: COMPANY SNAPSHOT
TABLE 118.CARGILL, INC.: OPERATING SEGMENTS
TABLE 119.CARGILL, INC..: PRODUCT PORTFOLIO
TABLE 120.CARGILL, INC.: NET SALES, 2019-2021 ($MILLION)
TABLE 121.DANONE: KEY EXECUTIVES
TABLE 122.DANONE: COMPANY SNAPSHOT
TABLE 123.DANONE: OPERATING SEGMENTS
TABLE 124.DANONE: PRODUCT PORTFOLIO
TABLE 125.DANONE: NET SALES, 2019–2021 ($MILLION)
TABLE 126.E.I.D PARRY: KEY EXECUTIVES
TABLE 127.E.I.D PARRY: COMPANY SNAPSHOT
TABLE 128.E.I.D PARRY: OPERATING SEGMENTS
TABLE 129.E.I.D PARRY: PRODUCT PORTFOLIO
TABLE 130.E.I.D PARRY: NET SALES, 2019-2021 ($MILLION)
TABLE 131.GENERAL MILLS INC: KEY EXECUTIVES
TABLE 132.GENERAL MILLS INC: COMPANY SNAPSHOT
TABLE 133.GENERAL MILLS INC: OPERATING SEGMENTS
TABLE 134.GENERAL MILLS INC: PRODUCT PORTFOLIO
TABLE 135.GENERAL MILLS INC: R&D EXPENDITURE, 2019–2021 ($MILLION)
TABLE 136.GENERAL MILLS INC: NET SALES, 2019–2021 ($MILLION)
TABLE 137.HERBALIFE INTERNATIONAL OF AMERICA, INC.: KEY EXECUTIVES
TABLE 138.HERBALIFE INTERNATIONAL OF AMERICA, INC.: COMPANY SNAPSHOT
TABLE 139.HERBALIFE INTERNATIONAL OF AMERICA, INC: PRODUCT PORTFOLIO
TABLE 140.HERBALIFE INTERNATIONAL OF AMERICA, INC: NET SALES, 2019–2021 ($MILLION)
TABLE 141.INNOPHOS: KEY EXECUTIVES
TABLE 142.INNOPHOS: COMPANY SNAPSHOT
TABLE 143.INNOPHOS: OPERATING SEGMENTS
TABLE 144.INNOPHOS: PRODUCT PORTFOLIO
TABLE 145.KONINKLIJKE DSM N.V.: KEY EXECUTIVE
TABLE 146.KONINKLIJKE DSM N.V.: COMPANY SNAPSHOT
TABLE 147.KONINKLIJKE DSM N.V.: OPERATING SEGMENTS
TABLE 148.KONINKLIJKE DSM N.V.: PRODUCT PORTFOLIO
TABLE 149.KONINKLIJKE DSM N.V.: R&D EXPENDITURE, 2019-2021 ($MILLION)
TABLE 150.KONINKLIJKE DSM N.V.: NET SALES, 2019-2021 ($MILLION)
TABLE 151.MATSUN NUTRITION: KEY EXECUTIVES
TABLE 152.MATSUN NUTRITION: COMPANY SNAPSHOT
TABLE 153.MATSUN NUTRITION: OPERATING SEGMENTS
TABLE 154.MATSUN NUTRITION: PRODUCT PORTFOLIO
TABLE 155.MEAD JOHNSON NUTRITION: KEY EXECUTIVES
TABLE 156.MEAD JOHNSON NUTRITION: COMPANY SNAPSHOT
TABLE 157.MEAD JOHNSON NUTRITION: OPERATING SEGMENTS
TABLE 158.MEAD JOHNSON NUTRITION: OPERATING SEGMENTS
TABLE 159.NATROL INC: KEY EXECUTIVES
TABLE 160.NATROL INC: COMPANY SNAPSHOT
TABLE 161.NATROL INC: OPERATING SEGMENTS
TABLE 162.NATROL INC: OPERATING SEGMENTS
TABLE 163.NESTLE S.A.: KEY EXECUTIVES
TABLE 164.NESTLE S.A.: COMPANY SNAPSHOT
TABLE 165.NESTLE S.A.: OPERATING SEGMENTS
TABLE 166.NESTLE S.A.: PRODUCT PORTFOLIO
TABLE 167.NESTLE S.A.: R&D EXPENDITURE, 2019–2021 ($MILLION)
TABLE 168.NESTLE S.A.: NET SALES, 2019–2021 ($MILLION)
TABLE 169.VALENSA INTERNATIONAL: KEY EXECUTIVES
TABLE 170.VALENSA INTERNATIONAL: COMPANY SNAPSHOT
TABLE 171.VALENSA INTERNATIONAL: OPERATING SEGMENTS
TABLE 172.VALENSA INTERNATIONAL: OPERATING SEGMENTS
LIST OF FIGURES
FIGURE 01.KEY MARKET SEGMENTS
FIGURE 02.NUTRACEUTICAL INGREDIENTS MARKET SNAPSHOT, 2021–2031
FIGURE 03.TOP INVESTMENT POCKETS
FIGURE 04.MODERATE BARGAINING POWER OF SUPPLIERS
FIGURE 05.HIGH BARGAINING POWER OF BUYERS
FIGURE 06.MODERATE THREAT OF NEW ENTRANTS
FIGURE 07.LOW THREAT OF SUBSTITUTES
FIGURE 08.MODERATE INTENSITY OF COMPETITIVE RIVALRY
FIGURE 09.GLOBAL NUTRACEUTICAL INGREDIENTS MARKET: DRIVERS, RESTRAINTS, AND OPPORTUNITIES, 2021–2030
FIGURE 10.VALUE CHAIN ANALYSIS
FIGURE 11.INDUSTRY PAIN-POINT ANALYSIS
FIGURE 12.MARKET SHARE ANALYSIS, BY TYPE, 2021-2031
FIGURE 13.MARKET SHARE ANALYSIS, BY NATURE, 2021-2031
FIGURE 14.MARKET SHARE ANALYSIS, BY APPLICATION, 2021-2031
FIGURE 15.MARKET SHARE ANALYSIS, BY REGION, 2021-2031
FIGURE 16.NUTRACEUTICALS INGREDIENTS MARKET SHARE, BY TYPE, 2022–2031
FIGURE 17.COMPARATIVE SHARE ANALYSIS OF PROBIOTICS NUTRACEUTICALS INGREDIENTS MARKET ($MILLION), BY COUNTRY, 2021 & 2031 (%)
FIGURE 18.COMPARATIVE SHARE ANALYSIS OF VITAMINS MARKET ($MILLION), BY COUNTRY, 2021 & 2031 (%)
FIGURE 19.COMPARATIVE SHARE ANALYSIS OF MINERALS MARKET ($MILLION), BY COUNTRY, 2021 & 2031 (%)
FIGURE 20.COMPARATIVE SHARE ANALYSIS OF PROTEINS NUTRACEUTICALS INGREDIENTSMARKET ($MILLION), BY COUNTRY, 2021 & 2031 (%)
FIGURE 21.COMPARATIVE SHARE ANALYSIS OF DIETARY FIBERS MARKET ($MILLION), BY COUNTRY, 2021 & 2031 (%)
FIGURE 22.COMPARATIVE SHARE ANALYSIS OF OTHERS MARKET ($MILLION), BY COUNTRY, 2021 & 2031 (%)
FIGURE 23.NUTRACEUTICALS INGREDIENTS MARKET SHARE, BY FORM, 2021–2031
FIGURE 24.COMPARATIVE SHARE ANALYSIS OF DRY NUTRACEUTICALS INGREDIENTS MARKET ($MILLION), BY COUNTRY, 2021 & 2031 (%)
FIGURE 25.COMPARATIVE SHARE ANALYSIS OF LIQUID NUTRACEUTICALS INGREDIENTS MARKET ($MILLION), BY COUNTRY, 2021 & 2031 (%)
FIGURE 26.NUTRACEUTICALS INGREDIENTS MARKET SHARE, BY APPLICATION, 2021–2031
FIGURE 27.COMPARATIVE SHARE ANALYSIS OF DIETARY SUPPLEMENTS NUTRACEUTICALS INGREDIENTS MARKET ($MILLION), BY COUNTRY, 2021 & 2031 (%)
FIGURE 28.COMPARATIVE SHARE ANALYSIS OF FUNCTIONAL FOOD AND BEVERAGE NUTRACEUTICALS INGREDIENTS MARKET ($MILLION), BY COUNTRY, 2021 & 2031 (%)
FIGURE 29.COMPARATIVE SHARE ANALYSIS OF ANIMAL NUTRITION NUTRACEUTICALS INGREDIENTS MARKET ($MILLION), BY COUNTRY, 2021 & 2031 (%)
FIGURE 30.COMPARATIVE SHARE ANALYSIS OF OTHERS MARKET ($MILLION), BY COUNTRY, 2021 & 2031 (%)
FIGURE 31.NUTRACEUTICALS INGREDIENTS MARKET SHARE, BY REGION, 2021–2031
FIGURE 32.U.S. NUTRACEUTICALS INGREDIENTS MARKET REVENUE, 2021–2031 ($MILLION)
FIGURE 33.CANADA NUTRACEUTICALS INGREDIENTS MARKET REVENUE, 2021–2031 ($MILLION)
FIGURE 34.MEXICO NUTRACEUTICALS INGREDIENTS MARKET REVENUE, 2021–2031 ($MILLION)
FIGURE 35.UK NUTRACEUTICALS INGREDIENTS MARKET REVENUE, 2021–2031 ($MILLION)
FIGURE 36.FINLAND NUTRACEUTICALS INGREDIENTS MARKET REVENUE, 2021–2031 ($MILLION)
FIGURE 37.SPAIN NUTRACEUTICALS INGREDIENTS MARKET REVENUE, 2021–2031 ($MILLION)
FIGURE 38.GERMANY NUTRACEUTICALS INGREDIENTS MARKET REVENUE, 2021–2031 ($MILLION)
FIGURE 39.FRANCE NUTRACEUTICALS INGREDIENTS MARKET REVENUE, 2021–2031 ($MILLION)
FIGURE 40.ITALY NUTRACEUTICALS INGREDIENTS MARKET REVENUE, 2021–2031 ($MILLION)
FIGURE 41.REST OF EUROPE NUTRACEUTICALS INGREDIENTS MARKET REVENUE, 2021–2031 ($MILLION)
FIGURE 42.CHINA NUTRACEUTICALS INGREDIENTS MARKET REVENUE, 2021–2031 ($MILLION)
FIGURE 43.JAPAN NUTRACEUTICALS INGREDIENTS MARKET REVENUE, 2021–2031 ($MILLION)
FIGURE 44.INDIA NUTRACEUTICALS INGREDIENTS MARKET REVENUE, 2021–2031 ($MILLION)
FIGURE 45.SOUTH KOREA NUTRACEUTICALS INGREDIENTS MARKET REVENUE, 2021–2031 ($MILLION)
FIGURE 46.AUSTRALIA NUTRACEUTICALS INGREDIENTS MARKET REVENUE, 2021–2031 ($MILLION)
FIGURE 47.NEW ZEALAND NUTRACEUTICALS INGREDIENTS MARKET REVENUE, 2021–2031 ($MILLION)
FIGURE 48.REST OF ASIA-PACIFIC NUTRACEUTICALS INGREDIENTS MARKET REVENUE, 2021–2031 ($MILLION)
FIGURE 49.BRAZIL NUTRACEUTICALS INGREDIENTS MARKET REVENUE, 2021–2031 ($MILLION)
FIGURE 50.SOUTH AFRICA NUTRACEUTICALS INGREDIENTS MARKET REVENUE, 2021–2031 ($MILLION)
FIGURE 51.SAUDI ARABIA NUTRACEUTICALS INGREDIENTS MARKET REVENUE, 2021–2031 ($MILLION)
FIGURE 52.REST OF LAMEA NUTRACEUTICALS INGREDIENTS MARKET REVENUE, 2021–2031 ($MILLION)
FIGURE 53.COMPETITIVE DASHBOARD OF TOP 10 KEY PLAYERS
FIGURE 54.COMPETITIVE HEATMAP OF TOP 10 KEY PLAYERS
FIGURE 55.PRODUCT MAPPING OF TOP 10 KEY PLAYERS
FIGURE 56.TOP WINNING STRATEGIES, BY YEAR, 2019–2022
FIGURE 57.TOP WINNING STRATEGIES, BY DEVELOPMENT, 2019–2022 (%)
FIGURE 58.TOP WINNING STRATEGIES, BY COMPANY, 2019–2022
FIGURE 59.PLAYER POSITIONING OF TOP 10 KEY PLAYERS
FIGURE 60.ARCHER DANIELS MIDLAND COMPANY: R&D EXPENDITURE, 2019-2021 ($MILLION)
FIGURE 61.ARCHER DANIELS MIDLAND COMPANY: NET SALES, 2019-2021 ($MILLION)
FIGURE 62.ARCHER DANIELS MIDLAND COMPANY: REVENUE SHARE BY SEGMENT, 2021 (%)
FIGURE 63.ARCHER DANIELS MIDLAND COMPANY: REVENUE SHARE BY REGION, 2021 (%)
FIGURE 64.CARGILL, INC..: NET SALES, 2019-2021 ($MILLION)
FIGURE 65.DANONE: NET SALES, 2019–2021 ($MILLION)
FIGURE 66.DANONE: REVENUE SHARE BY SEGMENT, 2021 (%)
FIGURE 67.E.I.D PARRY: NET SALES, 2019-2021 ($MILLION)
FIGURE 68.GENERAL MILLS INC: R&D EXPENDITURE, 2019–2021 ($MILLION)
FIGURE 69.GENERAL MILLS INC: NET SALES, 2019–2021 ($MILLION)
FIGURE 70.GENERAL MILLS INC: REVENUE SHARE BY SEGMENT, 2021 (%)
FIGURE 71.GENERAL MILLS INC: REVENUE SHARE BY REGION, 2021 (%)
FIGURE 72.HERBALIFE INTERNATIONAL OF AMERICA, INC: NET SALES, 2019–2021 ($MILLION)
FIGURE 73.HERBALIFE INTERNATIONAL OF AMERICA, INC: REVENUE SHARE BY PRODUCT CATEGORY, 2021 (%)
FIGURE 74.HERBALIFE INTERNATIONAL OF AMERICA, INC: REVENUE SHARE BY REGION, 2021 (%)
FIGURE 75.KONINKLIJKE DSM N.V.: R&D EXPENDITURE, 2019-2021 ($MILLION)
FIGURE 76.KONINKLIJKE DSM N.V.: NET SALES, 2019-2021 ($MILLION)
FIGURE 77.KONINKLIJKE DSM N.V.: REVENUE SHARE BY SEGMENT, 2021 (%)
FIGURE 78.KONINKLIJKE DSM N.V.: REVENUE SHARE BY REGION, 2021 (%)
FIGURE 79.NESTLE S.A.: R&D EXPENDITURE, 2019–2021 ($MILLION)
FIGURE 80.NESTLE S.A.: NET SALES, 2019–2021 ($MILLION)
FIGURE 81.NESTLE S.A.: REVENUE SHARE BY SEGMENT, 2021 (%)
FIGURE 82.NESTLE S.A.: REVENUE SHARE BY REGION, 2021 (%)
The perspectives of the leading CXOs in the nutraceutical ingredients industry are presented in this section. The nutraceutical ingredients market is anticipated to be significantly influenced by the rising demand for functional foods and dietary supplements during the forecast period. A positive perspective toward medical nutrition in light of its growing use to treat cardiovascular disease and malnutrition is likely to stimulate the industry's expansion.
The CXOs further added that due to the widespread knowledge of the advantages of dietary fibers and minerals for maintaining physical health, these nutrients are expected to increase in popularity. While minerals help to increase the retention and passage of nutrients into cells and support blood clotting, among other tasks, fibers tend to facilitate better bowel movements while providing essential cleansing of internal organs. The nutraceutical ingredients market is also anticipated to grow in size due to the high adoption rates of herbal medicines among people around the world as a result of growing concerns about the potentially dangerous side effects of conventional pharmaceuticals during the forecast period.
It is anticipated that rising healthcare costs and an increase in the global elderly population will support the growth of the nutraceutical ingredients market. The enhanced health and wellness advantages that functional meals provide are primarily to blame for the extremely positive attitude that consumers have toward these items. A number of factors have contributed to the total growth, including the aging population, growing healthcare costs, changing lifestyles, food innovation, and expectations for higher prices.
A. The global nutraceutical ingredients market size was valued at $37,593.3 million in 2021, and is projected to reach $80,753.2 million by 2031, registering a CAGR of 8.1% from 2022 to 2031.
A. The forecast period in the nutraceutical ingredients market report is 2022 to 2031.
A. The base year calculated in the nutraceutical ingredients market report is 2021.
A. The top companies analyzed for global nutraceutical ingredients market report are Amway Corporation, AOR Inc., Archer Daniels Midland, Cargill Incorporated, Danone, EID Parry, General Mills, Herbalife International of America Inc., Innophos, Matsun Nutrition, Mead Johnson, Nestle SA, Natrol, Royal DSM, and Valensa International.
A. The probiotics segment is the most influential segment in the nutraceutical ingredients market report.
A. North America holds the maximum market share of the nutraceutical ingredients market.
A. The company profile has been selected on the basis of key developments such as partnership, product launch, merger and acquisition.
A. The market value of the nutraceutical ingredients market in 2021 was $37,593.3 million.
Start reading instantly.
This Report and over 66,805+ more Reports, Available with Avenue Library. T&C*.
Enterprise
License/PDF
Library
Membership
*Taxes/Fees, if applicable will be added during checkout. All prices in USD
To ensure high-level data integrity, accurate analysis, and impeccable forecasts
For complete satisfaction
On-demand customization of scope of the report to exactly meet your needs
Targeted market view to provide pertinent information and save time of readers
Get insights on topics that are crucial for your business. Stay abreast of your interest areas.
Get Industry Data AlertsTo ensure high-level data integrity, accurate analysis, and impeccable forecasts
For complete satisfaction
On-demand customization of scope of the report to exactly meet your needs
Targeted market view to provide pertinent information and save time of readers