 Market")
Optical Coherence Tomography (OCT) Market Research, 2031
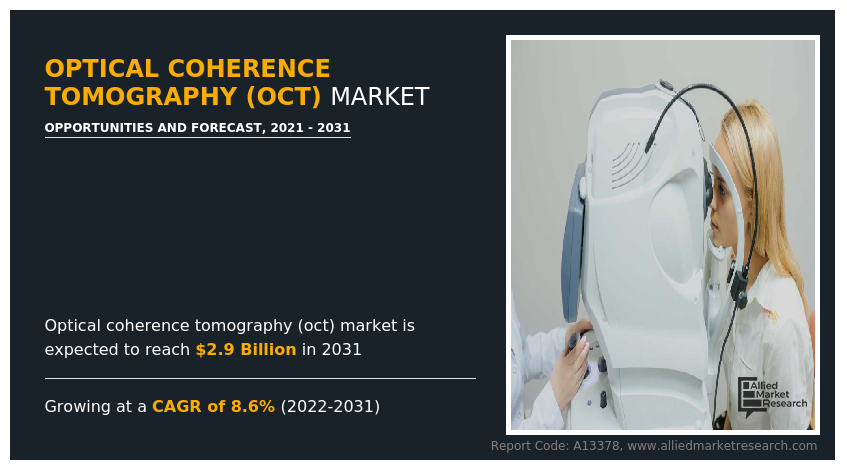
The global optical coherence tomography (oct) market size was valued at $1.2 billion in 2021 and is projected to reach $2.9 billion by 2031, growing at a CAGR of 8.6% from 2022 to 2031. Optical coherence tomography (OCT) is an imaging technique that uses low-coherence light to capture micrometer-resolution, two and three-dimensional images within optical scattering media such as biological tissue.
Optical coherence tomography typically uses light in the near-infrared spectral range which has a penetration depth of several hundred microns in tissue; thus, it is used to study deeper tissues present in the eyes, skin, and heart. Commercially available optical coherence tomography systems are employed in diverse applications, such as diagnostic imaging systems in ophthalmology and optometry where it can be used to obtain detailed images within the retina. Recently, they are being used in interventional cardiology to help diagnose coronary artery disease, and in dermatology to improve diagnosis.
Market Dynamics
The factors which drives the growth of optical coherence tomography market size include, rise in the launch of various optical coherence tomography (OCT) and the rise in investments for manufacturing advanced optical coherence tomography (OCT) by various key players across the glob. In addition, a rise in the adoption of optical coherence tomography (OCT) by hospitals and clinics is observed, owing to higher accurate results obtained which is expected to propel the growth of the OCT market.
Furthermore, the growth of the optical coherence tomography market size is a rise in a number of eye-related disorders and the use of advanced optical coherence tomography (OCT) for early detection of eye diseases. For instance, according to data of World Health Organization 2022, globally 2.2 billion people suffer from near or distant vision impairment. Thus, a rise in the number of eye-related disorders is expected to drive market growth. Along with the factors mentioned above, technological advancements in the field of optical coherence tomography (OCT) such as product development, enhance the diagnostic accuracy are also expected to aid in the growth of the OCT market.
Furthermore, various key players are adopting key strategies such as acquisition and expansion for advancements in optical coherence tomography (OCT)s and offer accurate monitoring devices. For instance, in July 2020, Topcon Healthcare, a leading provider of medical devices and software solutions for the global eye care community, announced today that it has acquired the Henson line of perimetry products, including the Henson 9000 and 7000, from Elektron Eye Technology (EET) of Cambridge, UK. The rise in incidence of cardiovascular diseases has resulted in a rise in demand for advanced optical coherence tomography (OCT) for imaging of coronary arteries, thereby significantly influencing the demand for the optical coherence tomography market. Various organizations along with the government are counselling physicians regarding optical coherence tomography (OCT) and its applications.
The demand for optical coherence tomography (OCT) is not only limited to developed countries but is also being witnessed in the developing countries, such as China, Brazil, and India, which fuels the growth of the market. Factors such as rise in adoption of optical coherence tomography (OCT), and rise in chronic disorders, further drive the growth of the market. Moreover, an increase in promotional activities by manufacturers and growth in awareness about optical coherence tomography (OCT) are expected to fuel their adoption in the near future. However, the high cost of optical coherence tomography (OCT) devices restrains the growth of the market. In addition, the absence of favorable reimbursement policies is also expected to constrain the growth of the optical coherence tomography market.
COVID-19 has disrupted workflows in the healthcare sector worldwide. The disease has forced a number of industries to shut their doors temporarily, including several sub-domains of health care. The pandemic reduced accessibility and patient attendance at outpatient medical visits, including preventive services such as screening of patients for various diseases such as eye disorders, cancers, and skin disorders. In addition, many ophthalmologists were not observing patients physically, owing to lockdown restrictions, thus optical coherence tomography (OCT) industry was hampered massively. Thus, COVID-19 negatively impacted optical coherence tomography market, owing to a smaller number of patients visits for diagnosis and monitoring of eye disorders. However, in 2021, the market recovered its growth owing to rise in number of patients visits for cardiovascular disease screening and eye disorders. Further, in 2022, the market experienced positive growth owing to rise in patient screening for eye disorders, skin related disorders, and cardiovascular diseases.
Segments Overview
The global optical coherence tomography (OCT) industry is segmented into type, technology, application, and region. By Type, the optical coherence tomographymarket is categorized into catheter-based OCT devices, handheld OCT devices and tabletop OCT devices. By Application, the market is categorized into ophthalmology, cardiovascular, and others. By End User the market is categorized into hospitals, clinics and others. Region wise, the market is analyzed across North America (the U.S., Canada, and Mexico), Europe (Germany, France, the UK, Italy, Spain, and rest of Europe), Asia-Pacific (Japan, China, Australia, India, South Korea, and rest of Asia-Pacific), and LAMEA (Brazil, South Africa, Saudi Arabia, and rest of LAMEA).
By Type
The market is categorized into catheter-based OCT devices, doppler OCT devices, handheld OCT devices, and tabletop OCT devices. The handheld OCT device segment accounted for the largest share in 2021, and is also expected to remain dominant during the optical coherence tomography market forecast, owing to rise in adoption of these devices as they allow high-resolution retinal imaging in infants & young children and help primary-care physicians in the early detection of retinal diseases including glaucoma, diabetic retinopathy, and macular degeneration.
 Market by Type")
By Application
The market is categorized into ophthalmology, cardiovascular, and others. The ophthalmology segment accounted for largest share in 2021, and is also expected to remain dominant during the forecast period, owing to increasing incidences of choroidal and retinal disorders, which results in rise in adoption of optical coherence tomography (OCT) device. The others segment is projected to register highest CAGR during the forecast period owing to rise in adoption of optical coherence tomography (OCT) devices for imaging and studying various diseases such as neurodegenerative diseases, cancer, skin diseases dentistry. In addition, availability of OCT devices for studying dermatology and oncology applications is anticipated to drive the optical coherence tomography market growth.
 Market by Application")
By End User
The market is categorized into hospitals, clinics and others. The hospitals segment accounted for the largest optical coherence tomography market share in 2021, and is expected to remain dominant during the forecast period owing to rise in number of patient admissions suffering from eye disorders in hospitals and availability of advanced optical coherence tomography (OCT).
 Market by End User")
By Region
Region wise, North America is expected to witness highest optical coherence tomography market share , owing to increase in adoption of advanced imaging system such as optical coherence tomography (OCT), rise in prevalence of eye disorders such as diabetic retinopathy and increase in number of key players offering advanced OCT devices, which is expected to drive the growth of optical coherence tomography (OCT) market. The upsurge in healthcare expenditure in the emerging economies is anticipated to offer lucrative opportunities for market expansion. However, Asia-Pacific is anticipated to witness notable growth, owing to increasing number of ocular and chronic diseases, increase in adoption of advanced diagnostic devices such as optical coherence tomography (OCT) and rise in investments for the development of advanced and portable OCT devices during the forecast period.
Asia-Pacific is expected to grow at the highest rate during the forecast period. The market growth in this region is attributable to the presence of key players in the region. Moreover, a rise in the adoption of optical coherence tomography (OCT) for cardiovascular imaging and dermatological applications is anticipated to contribute to the growth of the market. Further, with vast market demand for advanced optical coherence tomography (OCT) in India & China, wireless and advanced optical coherence tomography (OCT) such as handheld OCT devices are on rise, which is anticipated to contribute to the growth of the market. Asia-Pacific offers profitable opportunities for key players operating in the optical coherence tomography (OCT) market, thereby registering the fastest growth rate during the forecast period, owing to the growing infrastructure of industries, as well as the well-established presence of domestic companies in the region. In addition, the rise in contract manufacturing organizations within the region provides a great opportunity for new entrants in this region.
 Market by Region")
Competitive Analysis
Competitive analysis and profiles of the major players in the optical coherence tomography (OCT) market, such as Abbott Laboratories, Carl Zeiss Meditec Group, Danaher Corporation (Leica Microsystems), Metall Zug AG (HAAG-STREIT GROUP), Michelson Diagnostics Ltd., NIDEK CO., LTD, Novacam Technologies, Inc., OPTOPOL Technology Sp. z o.o., Thorlabs, Inc and Topcon Corporation., are provided in this report. Major players have adopted product launch, acquisition, expansion, and product development as key developmental strategies to improve products of the optical coherence tomography (OCT) market.
Acquisition in the optical coherence tomography market
- In July 2021, Topcon Corporation announced that it has acquired VISIA Imaging S.r.l, an ophthalmic device manufacturer headquartered in suburban Florence, Italy.
Recent product launch in the optical coherence tomography market
- In August 2020, Michelson Diagnostics Ltd. announced the launch of VivoTools, an advanced software suite for the analysis of VivoSight Dx OCT images.
Product development in the optical coherence tomography market
- In November 2020, Thorlabs announced that it has expanded its Swept Source OCT (SS-OCT) offering with the release of Atria systems centered at 1060 nm. These new systems, which integrate Thorlabs’ patented MEMS-VCSEL swept-wavelength technology, are available in 60 kHz (ATR206C1) and 200 kHz (ATR220C1) variants, including a version with an ultra-long imaging depth of 20 mm.
Key Benefits for Stakeholders
- This report provides a quantitative analysis of the market segments, current trends, estimations, and dynamics of the optical coherence tomography market analysis from 2021 to 2031 to identify the prevailing market opportunity.
- The market research is offered along with information related to key drivers, restraints, and opportunities.
- Porter's five forces analysis highlights the potency of buyers and suppliers to enable stakeholders make profit-oriented business decisions and strengthen their supplier-buyer network.
- In-depth analysis of the optical coherence tomography market segmentation assists to determine the prevailing market opportunities.
- Major countries in each region are mapped according to their revenue contribution to the global market.
- Market player positioning facilitates benchmarking and provides a clear understanding of the present position of the market players.
- The report includes the optical coherence tomography market analysis of the regional as well as global optical coherence tomography market trends, key players, market segments, application areas, and market growth strategies.
Optical Coherence Tomography (OCT) Market Report Highlights
| Aspects | Details |
| Market Size By 2031 | USD 2.9 billion |
| Growth Rate | CAGR of 8.6% |
| Forecast period | 2021 - 2031 |
| Report Pages | 265 |
| By Type |
|
| By Application |
|
| By End User |
|
| By Region |
|
| Key Market Players | Metall Zug AG, Michelson Diagnostics Ltd., Novacam Technologies, Inc., Danaher Corporation, OPTOPOL Technology Sp. z o.o., Thorlabs, Inc, NIDEK CO., LTD, Abbott Laboratories, Topcon Corporation, Carl Zeiss Meditec AG |
Analyst Review
Increase in demand for advanced optical coherence tomography (OCT) and rise in investments for portable and cost-effective optical coherence tomography (OCT) imaging, globally is expected to offer profitable opportunities for the expansion of the market. In addition, favorable government initiatives and higher spending for optical coherence tomography, have piqued the interest of several companies to develop optical coherence tomography.
The increase in adoption of optical coherence tomography for home care setting and private clinics is expected to boost the growth of the market. In addition, increasing burden of chronic diseases such as cancers, cardiovascular diseases and skin diseases across the globe has resulted rise in demand for portable and accurate optical coherence tomography (OCT) device, thus driving the growth of market. Further, geriatric people are prone to various chronic disorders, thus rise in number of geriatric population results in rise in demand of accurate diagnosis devices with advanced features for diagnosis and monitor disease progression, thereby driving the growth of market.
Furthermore, North America is expected to witness highest growth, in terms of revenue, owing to increase in adoption of advanced imaging system such as optical coherence tomography (OCT), rise in prevalence of eye disorders such as diabetic retinopathy and increase in number of key players offering advanced OCT devices, thus expected to drive the growth of optical coherence tomography (OCT) market. An upsurge in healthcare expenditure in the emerging economies is anticipated to offer lucrative opportunities for market expansion.
However, Asia-Pacific is anticipated to witness notable growth, owing to increasing number of ocular and chronic diseases, increase in adoption of advanced diagnostic devices such as optical coherence tomography (OCT) and rise in investments for development of advanced and portable OCT devices, is expected to drive the growth of market during the forecast period.
Optical coherence tomography (OCT) is an optical imaging technique, providing real-time two & three-dimensional images of biological tissues with micrometer resolution
The total market value of optical coherence tomography (OCT) market is $1244.16 million in 2021.
The market value of optical coherence tomography (OCT) market in 2031 is $2846.38 million
The forecast period for optical coherence tomography (OCT) market is 2022 to 2031
Top companies such as, Carl Zeiss Meditec Group, Thorlabs, Inc., NIDEK CO., LTD., and Metall Zug AG (HAAG-STREIT GROUP) held a high market position in 2021. These key players held a high market postion owing to the strong geographical foothold in North America, Europe, Asia-Pacific, and LAMEA.
The base year is 2021 in optical coherence tomography (OCT) market.
The major factor that fuels the growth of the optical coherence tomography (OCT) market are rise in adoption of this technique in diseases diagnosis, rise in new advancements and rise in research activities related to optical coherence tomography.
The handheld OCT device is the most influencing segment in optical coherence tomography (OCT) market rise in adoption of these devices, as it allows high-resolution retinal imaging in infants & young children and help primary-care physicians in the early detection of retinal diseases including glaucoma, diabetic retinopathy, and macular degeneration.
Loading Table Of Content...

