
Organic Eggs Market Summary
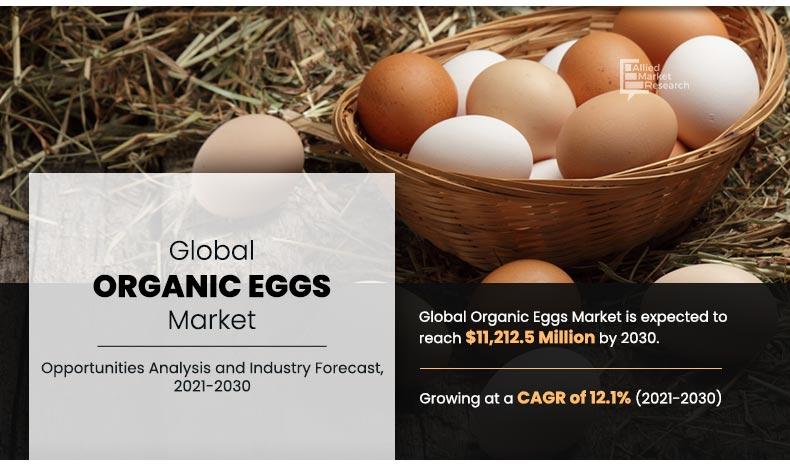
The organic eggs market size was valued at $3,414.7 million in 2020 and is estimated to reach $11,212.5 million by 2030, registering a CAGR of 12.1% from 2021 to 2030.
Key Market Trends and Insights
Region wise, North America generated the highest revenue in 2022.
The global organic eggs market share was dominated by the retail segment in 2020 and is expected to maintain its dominance in the upcoming years
The supermarket and hypermarket segment is expected to witness the highest growth during the forecast
Market Size & Forecast
- 2020 Market Size: USD 3,414.7 Million
- 2030 Projected Market Size: USD 11,212.5 Million
- Compound Annual Growth Rate (CAGR) (2021-2030): 12.1%
- North America: Generated the highest revenue in 2022
Organic eggs, also known as ‘free range eggs’ or ‘cage free eggs’. It is produced by feeding natural and organic feed to poultry. Organic eggs contain high nutrients with high source of omega 3 fatty acids as compare to the conventional eggs. This factor is expected to bolster the development of the global organic eggs market as compared to traditional and mass produced caged chicken eggs. According to USDA, organic eggs must come from chickens that are fed only organic feed. The Organic feed can be described as feed which is free of animal byproducts, synthetic fertilizers, pesticides and other chemical additives. Genetically modified foods should not used to feed chickens.
Increasing health awareness amongst consumers and increased focus on issues such as environment protection and animal welfare are the major trends associated with organic eggs. Growing demand for organic cosmetic and personal care products has considerably given rise for the growth of the organic eggs. No negative impact on skin, environment friendly and healthy skin are some of the benefits attributing for the growing demand for organic ingredient based.
Outbreak of COVID-19 has positively impacted the growth of the organic eggs market. According to Organic Trade Association (OTA), shoppers search for healthy, clean food to feed their at-home families, organic food is proving to be the food of choice for home. Growing consumption of healthy and functional food is majorly attributed for the growth of market in COVID-19 period and this growth is likely sustain during the forecast period.
By Application
Retail segment helds the major share of 75.5% in 2020
Segment Review
According to the organic eggs market analysis, the market segmented into application, distribution channel, size and region. On the basis of application, the market is categorized into retail, food processing, food service and others. On the basis of distribution channel, the market is segmented into, supermarket and hypermarket, e-commerce, convenience stores, bulk suppliers and others. By size, market is categorized into, extra-large and jumbo, medium and large and small. Region wise, it is analyzed across North America (the U.S., Canada, and Mexico), Europe (Germany, France, UK, Italy, Spain, Switzerland and Rest of Europe), Asia-Pacific (China, Japan, Australia, South Korea and Rest of Asia-Pacific), and LAMEA (Brazil, Argentina, Saudi Arabia, South Africa and Rest of LAMEA).
On the basis of application, the retail segment was the highest contributor to the market, with $2,579.6 million in 2020, and is estimated to reach $7,980.7 million by 2030, at a CAGR of 11.4% during the forecast period. Retail distribution is gaining popularity owing to the availability of broad range of consumer goods under a single roof. In addition, availability of ample parking space and convenient operation timings boost the sale of organic eggs through retail distribution channels. Growing awareness regarding the benefits of organic eggs such as promote good heart health, aid in weight management, helps in maintaining optimum eye health and functionality and promote healthy skin, has boosted the household consumption of the organic eggs. Moreover, increase in urbanization, rise in working class population, and competitive pricing boost the popularity of retail distribution in developed and developing economies. Thus, all these factors collectively contribute toward the organic eggs market growth.
By Distribution Channel
Supermarket and Hypermarket segment helds the major share of 40.5% in 2020
According to the organic eggs market trends, on the basis of distribution channel, the supermarket/hypermarket segment has highest share in global market. Growing urbanization and population density at metro cities are expected to boost the demand for supermarket/hypermarket. People considerably search for one stop shops for shopping where they can find everything for household purposes. Many big giant companies are actively investing in the hypermarket such as TATA Company, which is expected to push forward the growth of the market.
On the basis of size, in 2020, the small segment has gained lower share in global organic eggs market and is expected to grow at significant CAGR growth rate during the forecast period. Small organic eggs are not usually found in America supermarkets. These size eggs can suitably use for any processing or household consumption. These organic eggs are laid by chickens less than one year old. Because of their small size, the ratio between yolk and white is increased, making the yolk increase the flavor of your meal. Small eggs, or farmer's eggs, are prized by chefs because of the creamy taste when cooked. Thus, small eggs are majorly used in the premium cuisine food and luxury food items, thereby driving the growth of market through small segment during the forecast period.
By Size
Medium and Large segment helds the major share of 64.2% in 2020
According to the market opportunities. Region wise, Asia Pacific garnered a considerable share in market in 2020, and is expected to maintain it’s throughout organic eggs market forecast period. The market is expanding at a higher rate in emerging economies such as China and India due to rising awareness about the health benefits of the organic eggs as well as increase in income level. Due to the availability of large organic farmlands and organic eggs poultry farms in China and India, they are augmenting the growth of this market. In addition, South Korea is also an emerging country for the market and this is due to the increasing purchase power of consumers, increasing concerns about healthy food products, and upswing in living standard. Apart from this, the initiatives taken by the government such as loan facilities and low interest rate are helping this industry to grow.
Competitive Landscape
The players operating in the global organic eggs market have adopted various developmental strategies to expand their market share, increase profitability, and remain competitive in the market. The key players profiled in this report include Cal-Maine Foods Inc., Michael Foods Inc., LDC, Hickman’s Egg Ranch, Trillium Farm Holdings LLC, Plukon Food Group, Sisters Food Group, SUN DAILY, DQY Ecological and thehappyhensfarm.com.
By Region
North America region helds the major share of 49.2% in 2020
Key Benefits For Stakeholders
- The report provides a quantitative analysis of the current trends, estimations, and dynamics of the market size from 2020-2030 to identify the prevailing opportunities.
- Porter’s five forces analysis highlights the potency of buyers and suppliers to enable stakeholders to make profit-oriented business decisions and strengthen their supplier–buyer network.
- In-depth analysis and the organic eggs market segmentation and size assist to determine the prevailing organic eggs market opportunities.
- The major countries in each region are mapped according to their revenue contribution to the market share.
- The market player positioning segment facilitates benchmarking and provides a clear understanding of the present position of the market players in the organic eggs industry.
Organic Eggs Market Report Highlights
| Aspects | Details |
| By Application |
|
| By Distribution Channel |
|
| By Size |
|
| By Region |
|
| Key Market Players | Hickman’s Egg Ranch, Plukon Food Group, Cal-Maine Foods Inc., Michael Foods Inc., Trillium Farm Holdings LLC, Thehappyhensfarm.com, Sisters Food Group, SUN DAILY, DQY Ecological, LDC |
Analyst Review
This section provides the opinions of top-level CXOs in the organic eggs industry. According to them, rise in demand for innovative functional properties and new applications of organic eggs is among the major factors that boosts organic eggs consumption. A huge demand for organic egg white proteins in protein supplements has been noted during the recent past, which is anticipated to continue during the forecast period. Surge in inclination of food & beverage manufacturers toward functional ingredient having high nutritional content and enhanced performance is one of the main factors that drives the market growth. The demand for organic eggs in innovative food and other industrial applications have led the ingredient manufacturers to invest more in R&D activities to provide egg protein ingredients with superior functionalities for preparing or processing of innovative food & beverage products in the market. Growing demand for organic labaled packaged food and beverages products has been generating demand for organic protein, food addetives and ingredients from food processing industries, which in turn accelerate the growth of the organic eggs market.
As per the CXOs, Asia-Pacific is offering incremental growth opportunities for organic egg, and hence the market in the region is anticipated to grow at the highest CAGR. The introduction of new products made from organic ingredients is expected to disrupt the assumption that food and beverages sector using artificial ingredients or ingredients made from conventional farming. People in Asia Pacific region are increasingly adopting products with organic label to not to get affected by chemicals and artificial ingredients. That is many food and non-food processing industries are coming up with organic ingredient based products, which are being heavily demanded by the health-conscious people. Thus, demand for organic eggs is likley to grow faster during the forecast period.
The organic eggs market size was valued at $3,414.7 million in 2020 and is estimated to reach $11,212.5 million by 2030
The global Organic Eggs market is projected to grow at a compound annual growth rate of 12.1% from 2021 to 2030 $11,212.5 million by 2030
SUN DAILY, Plukon Food Group, DQY Ecological, Sisters Food Group, Thehappyhensfarm.com, Trillium Farm Holdings LLC, Cal-Maine Foods Inc., Michael Foods Inc., Hickman’s Egg Ranch, LDC
North America region helds the major share
Increase in consumer awareness about healthy diet, rise in demand for proteins as nutritional and functional ingredients, and several initiatives taken by government organizations to encourage organic poultry farming techniques drive the growth of the global organic eggs market
Loading Table Of Content...

