0
2022
Power Cable Market

Power Cable Market

by Distribution Type (Underground, Submarine, Overhead), by Voltage Rating (Up to 36 kV, 37 kV to 100 kV, 101 kV to 250 kV, 251 kV to 350 kV, 351 kV and Above), by End Use (Residential, Commercial, Industrial, Utilities): Global Opportunity Analysis and Industry Forecast, 2021-2031

Report Code: A05518
Dec 2022 | Pages: 270
Tables: 157
Charts: 62
  • Formats*:

  • pdf

    Single User License, Five User
    License & Enterprise User License

  • xls

    Data Pack Excel License

  • ppt

    It comes with the additional cost
    of $2500.00 contact sales.


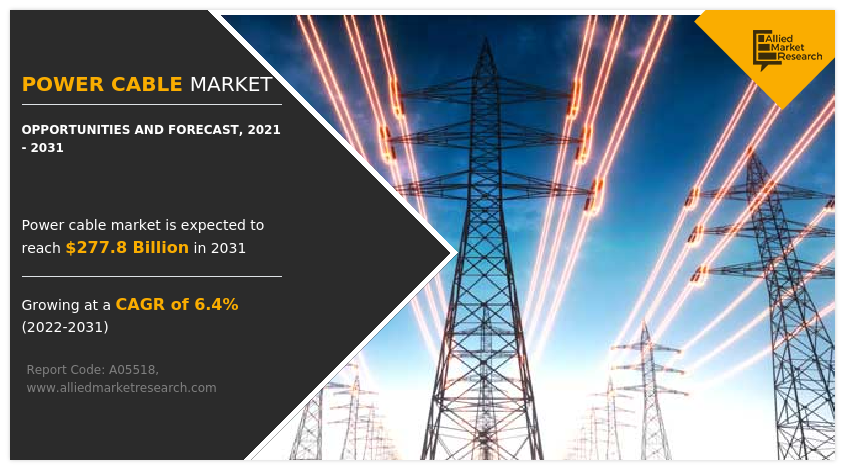
The global power cable market was valued at $148.6 billion in 2021 and is projected to reach $277.8 billion by 2031, growing at a CAGR of 6.4% from 2022 to 2031

According to Himanshu Jangra, Lead Analyst, Semiconductor and Electronics, at Allied Market Research, the power cable market is expected to showcase remarkable growth during the forecast period of 2022-2031. The report thoroughly examines the market size, power cable market trends, key market players, sales analysis, major driving factors, and key investment pockets. The report on the power cable industry provides an overview of the market as well as market definition and scope. The ongoing technological advancements and surge in demand for submarine power cables have an impact on market growth. Furthermore, the report provides a quantitative and qualitative analysis of the power cable market, as well as a breakdown of the pain points, value chain analysis, and key regulations.

A power cable is an electrical cable made up of one or more electrical conductors and is typically sheathed to keep it all together. The assembly is utilized for electrical power transfer. Power cables can be run overhead, buried in the ground, installed as permanent wiring inside buildings, or left exposed. NM-B (nonmetallic sheathed building cable) power cords are designed to be run within buildings and are bundled inside the thermoplastic sheathing.
COVID-19 has impacted both consumers and the economy. Cable manufacturing hubs have been temporarily shut down to limit the COVID-19 spread among individuals. This has majorly affected the supply chain of the power cable market by creating a shortage of materials and finished goods. Lack of business continuity has ensured a moderate negative impact on revenue and shareholder returns, which further results in financial disruptions in the market. In addition, the power cable is one of the most important components used across various applications and end users such as electric grid, housing, transportation, broadband, and others which saw a significant dip in the manufacturing process due to shutdown in factories. These factors are expected to moderately impact the demand and prices during the forecast period.

Power Cable Market

The power cable industry is expanding as a result of the increasing trend toward the production of renewable energy globally. Power cord demand is also boosted by an increase in the construction of new power grid infrastructure. For instance, the low availability of power grid infrastructure to transfer electricity is causing a number of developing countries to experience a surge in demand for power cord, hence, governments in these countries are focusing on building safe power grid infrastructure. 

In addition, the industry is witnessing growth due to the increased use of smart grids. The complexity of planning the deployment of power lines and the amount of time it takes for regulatory approvals are, however, expected to restrict market expansion during the forecast period. On the contrary, an upsurge in demand for power all over the world creates lucrative opportunities for the power cable market growth

Power Cable Market

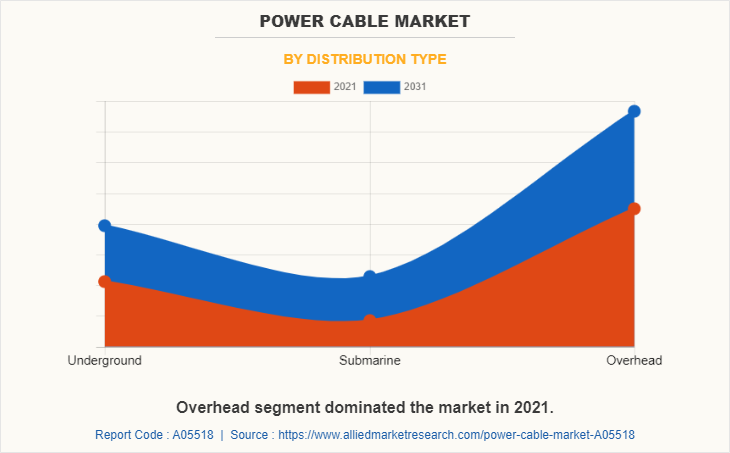
The power cable industry is segmented into Distribution Type, Voltage Rating, and End Use. On the basis of distribution type, the power cable industry is divided into the underground, submarine, and overhead. In 2021, the submarine segment dominated the market, in terms of revenue, and is expected to follow the same trend during the forecast period.
Power Cable Market

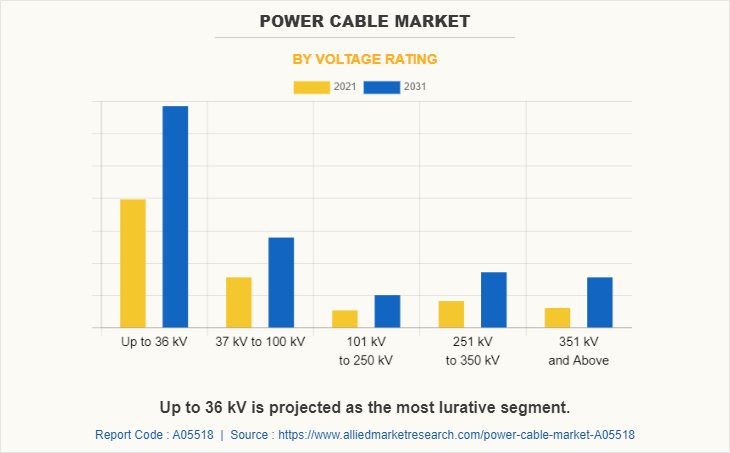
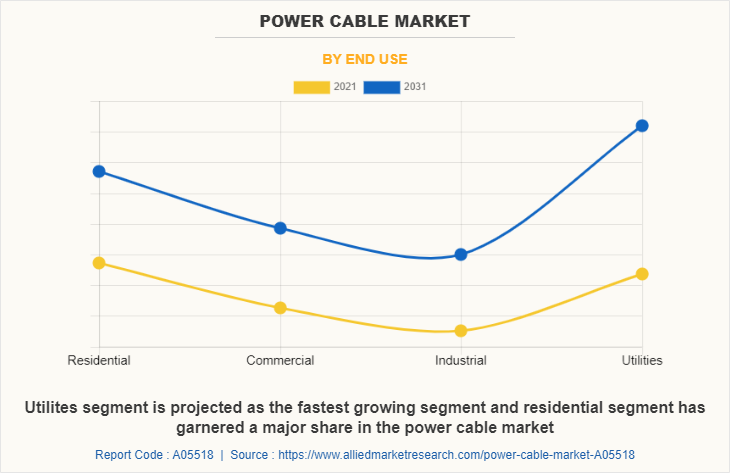
By voltage rating, the power cable market opportunity is segmented into Up to 36 kV, 37 kV to 100 kV, 101 kV to 250 kV, 251 kV to 350 kV, and 351 kV and above. The Up to 36 kV segment dominated the market in 2021, in terms of revenue, and is expected to dominate the market during the forecast period. According to the end user, the power cable market forecast is segmented into residential, commercial, industrial, and utilities. The residential segment accounted for a major share of the power cable market in 2021.
Power Cable Market

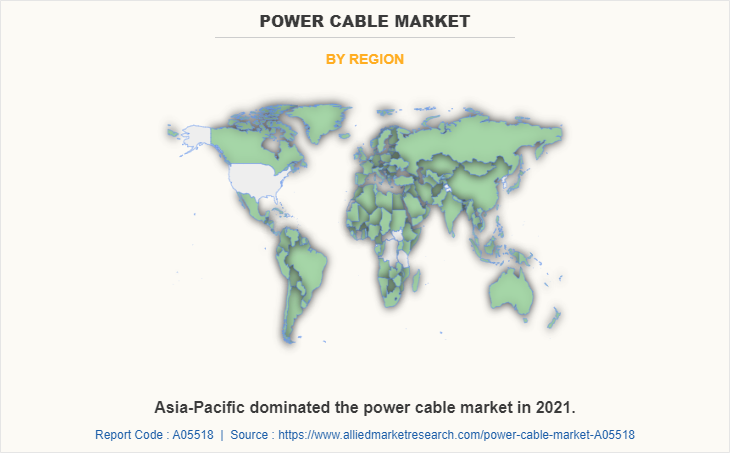
By region, the power cable market trends are analyzed across North America, Europe, Asia-Pacific, and LAMEA. North America is studied across into U.S., Mexico, and Canada, whereas Europe is into the UK, Spain, Germany, France, and the rest of Europe. The countries covered under Asia-Pacific are China, India, Japan, South Korea, and the rest of Asia-Pacific while LAMEA includes Latin America, the Middle East, and Africa. In addition, the report covers the country-wise cross-sectional analysis of the technology and connectors segments.
Power Cable Market

KEY SEGMENT 

By Distribution Type Analysis 

By distribution type, the market is segmented into underground, submarine, and overhead power cables. The submarine segment is expected to dominate the power cable industry during the forecast period. Underground cables have reduced transmission losses, and fewer likelihood of accidents, and they contribute to safety and pleasing aesthetics. Submarine cables are mostly utilized for high-power transmission between nations and states. 

By Voltage Rating Analysis 

By voltage rating, the power cable market share is segmented into up to 36 kV, 37 kV to 100 kV, 101 kV to 250 kV, 251 kV to 350 kV, and 351 kV and above. In recent years, the residential sector has expanded significantly because of rapid urbanization and population expansion. As a result, the sector's demand for power has increased, and new residential dwellings are now being built. In the upcoming years, sectors such as industrial, commercial, and others will also experience a significant increase due to the adoption of renewable energy, the building of new power plants, and the transition to smart grids. In addition, the development of offshore wind farms is expected to encourage the use of power cables with large power transmission capacities during the forecast period. 

COMPETITION ANALYSIS 

Competitive analysis and profiles of the major market players that have been provided in the report include ABB Ltd., Belden Incorporated, Encore Wire Corporation, Finolex Cables, KEI Industries Limited, LAPP North America, Nexans, NKT A/S, Prysmian Group, and TPC Wire & Cable Corp. These key players have adopted various strategies, such as product portfolio expansion, mergers & acquisitions, agreements, geographical expansion, and collaborations, to increase their market penetration and strengthen their foothold in the industry. 

Country Analysis  

Country-wise, the U.S. acquired a prime share in the North American power cable market size and is expected to grow at a significant CAGR during the forecast period of 2022-2031. The U.S., holds a dominant position in the North American power cable market, owing to the rise in the deployment of smart grid infrastructure to fulfill the demand for electricity.

Country-wise, the UK acquired a major share in Europe's power cable market in 2021, owing to the presence of prime players paired with the availability of advanced manufacturing facilities to develop sustainable power cables.

Country-wise, in Asia-Pacific, China dominated the power cable market for power cables owing to the continuous availability of cheap raw materials used to manufacture power cables.

TOP IMPACTING FACTORS 

Significant factors that impact the growth of power cables include the rise in the trend of renewable energy generation drives the growth of the power cable industry. In addition, an increase in the deployment of new power grid infrastructure boosts the growth in demand for power cables. For instance, the surge in the number of developing countries is experiencing limited availability of power grid infrastructure to transfer electricity; hence, governments in such countries are concentrating on establishing safe power grid infrastructure.  

Furthermore, the rise in the implementation of smart grids boosts the growth of the market. However, the complexity in deployment planning of power cables along with the delays in authorization from governments is projected to hamper the growth of the market during the forecast period. On the contrary, an upsurge in demand for power creates lucrative growth opportunities for the power cable market growth. 

IMPACT OF COVID-19 OUTBREAK ON THE POWER CABLE MARKET 

The electrical industry globally has been impacted by the spread of COVID-19 and improvements are expected to be completed in the upcoming years with more efficiency in order to make up for lost opportunities during lockdowns. 

HISTORICAL DATA & INFORMATION  

The power cable market outlook is highly competitive, owing to the strong presence of existing vendors. Vendors of the power cable industry with extensive technical and financial resources are expected to gain a competitive advantage over their competitors because they can cater to market demands. The competitive environment in this market is expected to increase as technological innovations, product extensions, and different strategies adopted by key vendors increase. 

KEY DEVELOPMENTS/ STRATEGIES  

ABB Ltd., Brugg Cables, Nexans, NKT A/S, and Prysmian Group are the top five companies holding a prime share in the power cable market. Top market players have adopted various strategies, such as acquisition, contract, collaboration, expansion, partnership, product launch, product development, and others to expand their foothold in the power cable industry. 

  • In November 2019, Nexans acquired a two-year agreement from MHI Vestas for Windlink cable kits. The contract holds for onshore wind turbines and covers Vestas installation around China, Europe, the U.S., and Brazil. The provided kits include medium voltage and low voltage cable kits from hubs close to Vestas operation. 

  • In January 2020, Nexans awarded a contract from SSE Renewables, a leading developer and operator of wind farms, to supply 800km of underground cables and 150 km of copper earth cables for the Viking Wind Farm in Scotland. 

  • In October 2020, ABB and Tan Thang Cement collaborated to integrate ABB Ability solutions such as ABB Ability System 800xA DCS, ABB Ability Knowledge Manager, and ABB Ability Expert Optimizer at Tan Thang’s new cement plant in Nghe An province, Vietnam. These digital solutions enable reliable electrical supply and optimize operational efficiency. 

  • In June 2021, Prysmian Group, the world leader in the energy and telecom cable systems industry, announced the finalization of the contract with SOO Green HVDC Link for the supply and installation of high-voltage direct current cable systems. The 2,100-megawatt interregional project, which is regarded as the first piece of a national clean energy grid, will interconnect the two biggest energy markets in the U.S. and provide plentiful, inexpensive renewable energy to major population centers from Chicago to the mid-Atlantic region. 

  • In November 2021, Prysmian Group, the world leader in the energy and telecom cable systems industry was awarded a contract by Terna Rete Italia S.p.A. for the new submarine cable connection between the island of Elba and the Italian mainland (Piombino). An HVAC 132 kV three-core power cable with XLPE insulation and single-wire armoring is being designed, supplied, installed, and then put into service between the power plants in Piombino and Elba island along a 34-kilometer undersea route and a 3-kilometer land route as part of this project. 

  • In January 2022, a Limited Notice to Proceed (LNTP) has been signed by Prysmian Group, the global market leader in energy and telecom cable systems, for the provision of power cables as part of a significant HVDC undersea cable project in the Middle East, estimated to cost $245.247 million. Four HVDC 320 kV single-core cables with XLPE insulation are being designed, supplied, assembled, and tested as part of the project to connect the Al Mirfa onshore converter station to Al Ghallan, an artificial offshore island in the Arabian Gulf off the coast of Abu Dhabi in the United Arab Emirates. 

  • In July 2022, the Champlain Hudson Power Express 400 kV high-voltage direct current transmission line in the U.S. is now being designed, manufactured, and installed by NKT under a contract that was recently signed with its project partner CHPE LLC. The contract is crucial for NKT because it allows it to use its vast expertise and experience in DC technology to support the transition to renewable energy in North America and expand its market position

Key Benefits For Stakeholders

  • This report provides a quantitative analysis of the market segments, current trends, estimations, and dynamics of the power cable market analysis from 2021 to 2031 to identify the prevailing power cable market opportunities.
  • Market research is offered along with information related to key drivers, restraints, and opportunities.
  • Porter's five forces analysis highlights buyers' and suppliers' potency to enable stakeholders to make profit-oriented business decisions and strengthen their supplier-buyer network.
  • An in-depth analysis of the power cable market segmentation assists in determining the prevailing market opportunities.
  • Major countries in each region are mapped according to their revenue contribution to the global market.
  • Market player positioning facilitates benchmarking and provides a clear understanding of the present position of the market players.
  • The report includes an analysis of regional and global power cable market trends, key players, market segments, application areas, and market growth strategies.

Power Cable Market Report Highlights

Aspects Details
Market Size By 2031 USD 277.8 billion
Growth Rate CAGR of 6.4%
Forecast period 2021 - 2031
Report Pages 270
By Distribution Type
  • Submarine
  • Overhead
  • Underground
By Voltage Rating
  • Up to 36 kV
  • 37 kV to 100 kV
  • 101 kV to 250 kV
  • 251 kV to 350 kV
  • 351 kV and Above
By End Use
  • Residential
  • Commercial
  • Industrial
  • Utilities
By Region
  • North America  (U.S., Canada, Mexico)
  • Europe  (UK, Germany, France, Russia, Rest of Europe)
  • Asia-Pacific  (China, Japan, India, South Korea, Rest of Asia-Pacific)
  • LAMEA  (Latin America, Middle East, Africa)
Key Market Players TPC Wire & Cable Corp, KEI Industries Ltd., Polycab India Ltd, LAPP North America, Belden Incorporated, Brugg Cables, Nexans S.A., NKT A/S, FINOLEX CABLES LIMITED, Prysmian Group (General Cable), ABB Ltd, Encore Wire Corporation, Riyadh Cables Group Company
 
  • CHAPTER 1:INTRODUCTION

    • 1.1.Report description

    • 1.2.Key market segments

    • 1.3.Key benefits to the stakeholders

    • 1.4.Research Methodology

      • 1.4.1.Secondary research

      • 1.4.2.Primary research

      • 1.4.3.Analyst tools and models

  • CHAPTER 2:EXECUTIVE SUMMARY

    • 2.1.Key findings of the study

    • 2.2.CXO Perspective

  • CHAPTER 3:MARKET OVERVIEW

    • 3.1.Market definition and scope

    • 3.2.Key findings

      • 3.2.1.Top investment pockets

    • 3.3.Porter’s five forces analysis

    • 3.4.Top player positioning

    • 3.5.Market dynamics

      • 3.5.1.Drivers

      • 3.5.2.Restraints

      • 3.5.3.Opportunities

    • 3.6.COVID-19 Impact Analysis on the market

  • CHAPTER 4: POWER CABLE MARKET, BY DISTRIBUTION TYPE

    • 4.1 Overview

      • 4.1.1 Market size and forecast

    • 4.2 Underground

      • 4.2.1 Key market trends, growth factors and opportunities

      • 4.2.2 Market size and forecast, by region

      • 4.2.3 Market share analysis by country

    • 4.3 Submarine

      • 4.3.1 Key market trends, growth factors and opportunities

      • 4.3.2 Market size and forecast, by region

      • 4.3.3 Market share analysis by country

    • 4.4 Overhead

      • 4.4.1 Key market trends, growth factors and opportunities

      • 4.4.2 Market size and forecast, by region

      • 4.4.3 Market share analysis by country

  • CHAPTER 5: POWER CABLE MARKET, BY VOLTAGE RATING

    • 5.1 Overview

      • 5.1.1 Market size and forecast

    • 5.2 Up to 36 kV

      • 5.2.1 Key market trends, growth factors and opportunities

      • 5.2.2 Market size and forecast, by region

      • 5.2.3 Market share analysis by country

    • 5.3 37 kV to 100 kV

      • 5.3.1 Key market trends, growth factors and opportunities

      • 5.3.2 Market size and forecast, by region

      • 5.3.3 Market share analysis by country

    • 5.4 101 kV to 250 kV

      • 5.4.1 Key market trends, growth factors and opportunities

      • 5.4.2 Market size and forecast, by region

      • 5.4.3 Market share analysis by country

    • 5.5 251 kV to 350 kV

      • 5.5.1 Key market trends, growth factors and opportunities

      • 5.5.2 Market size and forecast, by region

      • 5.5.3 Market share analysis by country

    • 5.6 351 kV and Above

      • 5.6.1 Key market trends, growth factors and opportunities

      • 5.6.2 Market size and forecast, by region

      • 5.6.3 Market share analysis by country

  • CHAPTER 6: POWER CABLE MARKET, BY END USE

    • 6.1 Overview

      • 6.1.1 Market size and forecast

    • 6.2 Residential

      • 6.2.1 Key market trends, growth factors and opportunities

      • 6.2.2 Market size and forecast, by region

      • 6.2.3 Market share analysis by country

    • 6.3 Commercial

      • 6.3.1 Key market trends, growth factors and opportunities

      • 6.3.2 Market size and forecast, by region

      • 6.3.3 Market share analysis by country

    • 6.4 Industrial

      • 6.4.1 Key market trends, growth factors and opportunities

      • 6.4.2 Market size and forecast, by region

      • 6.4.3 Market share analysis by country

    • 6.5 Utilities

      • 6.5.1 Key market trends, growth factors and opportunities

      • 6.5.2 Market size and forecast, by region

      • 6.5.3 Market share analysis by country

  • CHAPTER 7: POWER CABLE MARKET, BY REGION

    • 7.1 Overview

      • 7.1.1 Market size and forecast

    • 7.2 North America

      • 7.2.1 Key trends and opportunities

      • 7.2.2 North America Market size and forecast, by Distribution Type

      • 7.2.3 North America Market size and forecast, by Voltage Rating

      • 7.2.4 North America Market size and forecast, by End Use

      • 7.2.5 North America Market size and forecast, by country

        • 7.2.5.1 U.S.
          • 7.2.5.1.1 Key market trends, growth factors and opportunities
          • 7.2.5.1.2 Market size and forecast, by Distribution Type
          • 7.2.5.1.3 Market size and forecast, by Voltage Rating
          • 7.2.5.1.4 Market size and forecast, by End Use
        • 7.2.5.2 Canada
          • 7.2.5.2.1 Key market trends, growth factors and opportunities
          • 7.2.5.2.2 Market size and forecast, by Distribution Type
          • 7.2.5.2.3 Market size and forecast, by Voltage Rating
          • 7.2.5.2.4 Market size and forecast, by End Use
        • 7.2.5.3 Mexico
          • 7.2.5.3.1 Key market trends, growth factors and opportunities
          • 7.2.5.3.2 Market size and forecast, by Distribution Type
          • 7.2.5.3.3 Market size and forecast, by Voltage Rating
          • 7.2.5.3.4 Market size and forecast, by End Use
    • 7.3 Europe

      • 7.3.1 Key trends and opportunities

      • 7.3.2 Europe Market size and forecast, by Distribution Type

      • 7.3.3 Europe Market size and forecast, by Voltage Rating

      • 7.3.4 Europe Market size and forecast, by End Use

      • 7.3.5 Europe Market size and forecast, by country

        • 7.3.5.1 UK
          • 7.3.5.1.1 Key market trends, growth factors and opportunities
          • 7.3.5.1.2 Market size and forecast, by Distribution Type
          • 7.3.5.1.3 Market size and forecast, by Voltage Rating
          • 7.3.5.1.4 Market size and forecast, by End Use
        • 7.3.5.2 Germany
          • 7.3.5.2.1 Key market trends, growth factors and opportunities
          • 7.3.5.2.2 Market size and forecast, by Distribution Type
          • 7.3.5.2.3 Market size and forecast, by Voltage Rating
          • 7.3.5.2.4 Market size and forecast, by End Use
        • 7.3.5.3 France
          • 7.3.5.3.1 Key market trends, growth factors and opportunities
          • 7.3.5.3.2 Market size and forecast, by Distribution Type
          • 7.3.5.3.3 Market size and forecast, by Voltage Rating
          • 7.3.5.3.4 Market size and forecast, by End Use
        • 7.3.5.4 Russia
          • 7.3.5.4.1 Key market trends, growth factors and opportunities
          • 7.3.5.4.2 Market size and forecast, by Distribution Type
          • 7.3.5.4.3 Market size and forecast, by Voltage Rating
          • 7.3.5.4.4 Market size and forecast, by End Use
        • 7.3.5.5 Rest of Europe
          • 7.3.5.5.1 Key market trends, growth factors and opportunities
          • 7.3.5.5.2 Market size and forecast, by Distribution Type
          • 7.3.5.5.3 Market size and forecast, by Voltage Rating
          • 7.3.5.5.4 Market size and forecast, by End Use
    • 7.4 Asia-Pacific

      • 7.4.1 Key trends and opportunities

      • 7.4.2 Asia-Pacific Market size and forecast, by Distribution Type

      • 7.4.3 Asia-Pacific Market size and forecast, by Voltage Rating

      • 7.4.4 Asia-Pacific Market size and forecast, by End Use

      • 7.4.5 Asia-Pacific Market size and forecast, by country

        • 7.4.5.1 China
          • 7.4.5.1.1 Key market trends, growth factors and opportunities
          • 7.4.5.1.2 Market size and forecast, by Distribution Type
          • 7.4.5.1.3 Market size and forecast, by Voltage Rating
          • 7.4.5.1.4 Market size and forecast, by End Use
        • 7.4.5.2 Japan
          • 7.4.5.2.1 Key market trends, growth factors and opportunities
          • 7.4.5.2.2 Market size and forecast, by Distribution Type
          • 7.4.5.2.3 Market size and forecast, by Voltage Rating
          • 7.4.5.2.4 Market size and forecast, by End Use
        • 7.4.5.3 India
          • 7.4.5.3.1 Key market trends, growth factors and opportunities
          • 7.4.5.3.2 Market size and forecast, by Distribution Type
          • 7.4.5.3.3 Market size and forecast, by Voltage Rating
          • 7.4.5.3.4 Market size and forecast, by End Use
        • 7.4.5.4 South Korea
          • 7.4.5.4.1 Key market trends, growth factors and opportunities
          • 7.4.5.4.2 Market size and forecast, by Distribution Type
          • 7.4.5.4.3 Market size and forecast, by Voltage Rating
          • 7.4.5.4.4 Market size and forecast, by End Use
        • 7.4.5.5 Rest of Asia-Pacific
          • 7.4.5.5.1 Key market trends, growth factors and opportunities
          • 7.4.5.5.2 Market size and forecast, by Distribution Type
          • 7.4.5.5.3 Market size and forecast, by Voltage Rating
          • 7.4.5.5.4 Market size and forecast, by End Use
    • 7.5 LAMEA

      • 7.5.1 Key trends and opportunities

      • 7.5.2 LAMEA Market size and forecast, by Distribution Type

      • 7.5.3 LAMEA Market size and forecast, by Voltage Rating

      • 7.5.4 LAMEA Market size and forecast, by End Use

      • 7.5.5 LAMEA Market size and forecast, by country

        • 7.5.5.1 Latin America
          • 7.5.5.1.1 Key market trends, growth factors and opportunities
          • 7.5.5.1.2 Market size and forecast, by Distribution Type
          • 7.5.5.1.3 Market size and forecast, by Voltage Rating
          • 7.5.5.1.4 Market size and forecast, by End Use
        • 7.5.5.2 Middle East
          • 7.5.5.2.1 Key market trends, growth factors and opportunities
          • 7.5.5.2.2 Market size and forecast, by Distribution Type
          • 7.5.5.2.3 Market size and forecast, by Voltage Rating
          • 7.5.5.2.4 Market size and forecast, by End Use
        • 7.5.5.3 Africa
          • 7.5.5.3.1 Key market trends, growth factors and opportunities
          • 7.5.5.3.2 Market size and forecast, by Distribution Type
          • 7.5.5.3.3 Market size and forecast, by Voltage Rating
          • 7.5.5.3.4 Market size and forecast, by End Use
  • CHAPTER 8: COMPANY LANDSCAPE

    • 8.1. Introduction

    • 8.2. Top winning strategies

    • 8.3. Product Mapping of Top 10 Player

    • 8.4. Competitive Dashboard

    • 8.5. Competitive Heatmap

    • 8.6. Key developments

  • CHAPTER 9: COMPANY PROFILES

    • 9.1 Encore Wire Corporation

      • 9.1.1 Company overview

      • 9.1.2 Company snapshot

      • 9.1.3 Operating business segments

      • 9.1.4 Product portfolio

      • 9.1.5 Business performance

      • 9.1.6 Key strategic moves and developments

    • 9.2 brugg cables

      • 9.2.1 Company overview

      • 9.2.2 Company snapshot

      • 9.2.3 Operating business segments

      • 9.2.4 Product portfolio

      • 9.2.5 Business performance

      • 9.2.6 Key strategic moves and developments

    • 9.3 Belden Incorporated

      • 9.3.1 Company overview

      • 9.3.2 Company snapshot

      • 9.3.3 Operating business segments

      • 9.3.4 Product portfolio

      • 9.3.5 Business performance

      • 9.3.6 Key strategic moves and developments

    • 9.4 LAPP North America

      • 9.4.1 Company overview

      • 9.4.2 Company snapshot

      • 9.4.3 Operating business segments

      • 9.4.4 Product portfolio

      • 9.4.5 Business performance

      • 9.4.6 Key strategic moves and developments

    • 9.5 TPC Wire & Cable Corp

      • 9.5.1 Company overview

      • 9.5.2 Company snapshot

      • 9.5.3 Operating business segments

      • 9.5.4 Product portfolio

      • 9.5.5 Business performance

      • 9.5.6 Key strategic moves and developments

    • 9.6 ABB Ltd

      • 9.6.1 Company overview

      • 9.6.2 Company snapshot

      • 9.6.3 Operating business segments

      • 9.6.4 Product portfolio

      • 9.6.5 Business performance

      • 9.6.6 Key strategic moves and developments

    • 9.7 Nexans S.A.

      • 9.7.1 Company overview

      • 9.7.2 Company snapshot

      • 9.7.3 Operating business segments

      • 9.7.4 Product portfolio

      • 9.7.5 Business performance

      • 9.7.6 Key strategic moves and developments

    • 9.8 Prysmian Group(general cable)

      • 9.8.1 Company overview

      • 9.8.2 Company snapshot

      • 9.8.3 Operating business segments

      • 9.8.4 Product portfolio

      • 9.8.5 Business performance

      • 9.8.6 Key strategic moves and developments

    • 9.9 Riyadh Cables Group Company

      • 9.9.1 Company overview

      • 9.9.2 Company snapshot

      • 9.9.3 Operating business segments

      • 9.9.4 Product portfolio

      • 9.9.5 Business performance

      • 9.9.6 Key strategic moves and developments

    • 9.10 FINOLEX CABLES LIMITED

      • 9.10.1 Company overview

      • 9.10.2 Company snapshot

      • 9.10.3 Operating business segments

      • 9.10.4 Product portfolio

      • 9.10.5 Business performance

      • 9.10.6 Key strategic moves and developments

    • 9.11 nkt

      • 9.11.1 Company overview

      • 9.11.2 Company snapshot

      • 9.11.3 Operating business segments

      • 9.11.4 Product portfolio

      • 9.11.5 Business performance

      • 9.11.6 Key strategic moves and developments

    • 9.12 KEI Industries Ltd

      • 9.12.1 Company overview

      • 9.12.2 Company snapshot

      • 9.12.3 Operating business segments

      • 9.12.4 Product portfolio

      • 9.12.5 Business performance

      • 9.12.6 Key strategic moves and developments

    • 9.13 Polycab India Ltd

      • 9.13.1 Company overview

      • 9.13.2 Company snapshot

      • 9.13.3 Operating business segments

      • 9.13.4 Product portfolio

      • 9.13.5 Business performance

      • 9.13.6 Key strategic moves and developments

  • LIST OF TABLES

  • TABLE 1. GLOBAL POWER CABLE MARKET, BY DISTRIBUTION TYPE, 2021-2031 (REVENUE, $MILLION)
    TABLE 2. POWER CABLE MARKET FOR UNDERGROUND, BY REGION, 2021-2031 (REVENUE, $MILLION)
    TABLE 3. POWER CABLE MARKET FOR UNDERGROUND, BY COUNTRY, 2021-2031 (REVENUE, $MILLION)
    TABLE 4. POWER CABLE MARKET FOR SUBMARINE, BY REGION, 2021-2031 (REVENUE, $MILLION)
    TABLE 5. POWER CABLE MARKET FOR SUBMARINE, BY COUNTRY, 2021-2031 (REVENUE, $MILLION)
    TABLE 6. POWER CABLE MARKET FOR OVERHEAD, BY REGION, 2021-2031 (REVENUE, $MILLION)
    TABLE 7. POWER CABLE MARKET FOR OVERHEAD, BY COUNTRY, 2021-2031 (REVENUE, $MILLION)
    TABLE 8. GLOBAL POWER CABLE MARKET, BY VOLTAGE RATING, 2021-2031 (REVENUE, $MILLION)
    TABLE 9. POWER CABLE MARKET FOR UP TO 36 KV, BY REGION, 2021-2031 (REVENUE, $MILLION)
    TABLE 10. POWER CABLE MARKET FOR UP TO 36 KV, BY COUNTRY, 2021-2031 (REVENUE, $MILLION)
    TABLE 11. POWER CABLE MARKET FOR 37 KV TO 100 KV, BY REGION, 2021-2031 (REVENUE, $MILLION)
    TABLE 12. POWER CABLE MARKET FOR 37 KV TO 100 KV, BY COUNTRY, 2021-2031 (REVENUE, $MILLION)
    TABLE 13. POWER CABLE MARKET FOR 101 KV TO 250 KV, BY REGION, 2021-2031 (REVENUE, $MILLION)
    TABLE 14. POWER CABLE MARKET FOR 101 KV TO 250 KV, BY COUNTRY, 2021-2031 (REVENUE, $MILLION)
    TABLE 15. POWER CABLE MARKET FOR 251 KV TO 350 KV, BY REGION, 2021-2031 (REVENUE, $MILLION)
    TABLE 16. POWER CABLE MARKET FOR 251 KV TO 350 KV, BY COUNTRY, 2021-2031 (REVENUE, $MILLION)
    TABLE 17. POWER CABLE MARKET FOR 351 KV AND ABOVE, BY REGION, 2021-2031 (REVENUE, $MILLION)
    TABLE 18. POWER CABLE MARKET FOR 351 KV AND ABOVE, BY COUNTRY, 2021-2031 (REVENUE, $MILLION)
    TABLE 19. GLOBAL POWER CABLE MARKET, BY END USE, 2021-2031 (REVENUE, $MILLION)
    TABLE 20. POWER CABLE MARKET FOR RESIDENTIAL, BY REGION, 2021-2031 (REVENUE, $MILLION)
    TABLE 21. POWER CABLE MARKET FOR RESIDENTIAL, BY COUNTRY, 2021-2031 (REVENUE, $MILLION)
    TABLE 22. POWER CABLE MARKET FOR COMMERCIAL, BY REGION, 2021-2031 (REVENUE, $MILLION)
    TABLE 23. POWER CABLE MARKET FOR COMMERCIAL, BY COUNTRY, 2021-2031 (REVENUE, $MILLION)
    TABLE 24. POWER CABLE MARKET FOR INDUSTRIAL, BY REGION, 2021-2031 (REVENUE, $MILLION)
    TABLE 25. POWER CABLE MARKET FOR INDUSTRIAL, BY COUNTRY, 2021-2031 (REVENUE, $MILLION)
    TABLE 26. POWER CABLE MARKET FOR UTILITIES, BY REGION, 2021-2031 (REVENUE, $MILLION)
    TABLE 27. POWER CABLE MARKET FOR UTILITIES, BY COUNTRY, 2021-2031 (REVENUE, $MILLION)
    TABLE 28. POWER CABLE MARKET, BY REGION, 2021-2031 (REVENUE, $MILLION)
    TABLE 29. NORTH AMERICA POWER CABLE MARKET, BY DISTRIBUTION TYPE, 2021-2031 (REVENUE, $MILLION)
    TABLE 30. NORTH AMERICA POWER CABLE MARKET, BY VOLTAGE RATING, 2021-2031 (REVENUE, $MILLION)
    TABLE 31. NORTH AMERICA POWER CABLE MARKET, BY END USE, 2021-2031 (REVENUE, $MILLION)
    TABLE 32. NORTH AMERICA POWER CABLE MARKET, BY COUNTRY, 2021-2031 (REVENUE, $MILLION)
    TABLE 33. U.S. POWER CABLE MARKET, BY DISTRIBUTION TYPE, 2021-2031 (REVENUE, $MILLION)
    TABLE 34. U.S. POWER CABLE MARKET, BY VOLTAGE RATING, 2021-2031 (REVENUE, $MILLION)
    TABLE 35. U.S. POWER CABLE MARKET, BY END USE, 2021-2031 (REVENUE, $MILLION)
    TABLE 36. CANADA POWER CABLE MARKET, BY DISTRIBUTION TYPE, 2021-2031 (REVENUE, $MILLION)
    TABLE 37. CANADA POWER CABLE MARKET, BY VOLTAGE RATING, 2021-2031 (REVENUE, $MILLION)
    TABLE 38. CANADA POWER CABLE MARKET, BY END USE, 2021-2031 (REVENUE, $MILLION)
    TABLE 39. MEXICO POWER CABLE MARKET, BY DISTRIBUTION TYPE, 2021-2031 (REVENUE, $MILLION)
    TABLE 40. MEXICO POWER CABLE MARKET, BY VOLTAGE RATING, 2021-2031 (REVENUE, $MILLION)
    TABLE 41. MEXICO POWER CABLE MARKET, BY END USE, 2021-2031 (REVENUE, $MILLION)
    TABLE 42. EUROPE POWER CABLE MARKET, BY DISTRIBUTION TYPE, 2021-2031 (REVENUE, $MILLION)
    TABLE 43. EUROPE POWER CABLE MARKET, BY VOLTAGE RATING, 2021-2031 (REVENUE, $MILLION)
    TABLE 44. EUROPE POWER CABLE MARKET, BY END USE, 2021-2031 (REVENUE, $MILLION)
    TABLE 45. EUROPE POWER CABLE MARKET, BY COUNTRY, 2021-2031 (REVENUE, $MILLION)
    TABLE 46. UK POWER CABLE MARKET, BY DISTRIBUTION TYPE, 2021-2031 (REVENUE, $MILLION)
    TABLE 47. UK POWER CABLE MARKET, BY VOLTAGE RATING, 2021-2031 (REVENUE, $MILLION)
    TABLE 48. UK POWER CABLE MARKET, BY END USE, 2021-2031 (REVENUE, $MILLION)
    TABLE 49. GERMANY POWER CABLE MARKET, BY DISTRIBUTION TYPE, 2021-2031 (REVENUE, $MILLION)
    TABLE 50. GERMANY POWER CABLE MARKET, BY VOLTAGE RATING, 2021-2031 (REVENUE, $MILLION)
    TABLE 51. GERMANY POWER CABLE MARKET, BY END USE, 2021-2031 (REVENUE, $MILLION)
    TABLE 52. FRANCE POWER CABLE MARKET, BY DISTRIBUTION TYPE, 2021-2031 (REVENUE, $MILLION)
    TABLE 53. FRANCE POWER CABLE MARKET, BY VOLTAGE RATING, 2021-2031 (REVENUE, $MILLION)
    TABLE 54. FRANCE POWER CABLE MARKET, BY END USE, 2021-2031 (REVENUE, $MILLION)
    TABLE 55. RUSSIA POWER CABLE MARKET, BY DISTRIBUTION TYPE, 2021-2031 (REVENUE, $MILLION)
    TABLE 56. RUSSIA POWER CABLE MARKET, BY VOLTAGE RATING, 2021-2031 (REVENUE, $MILLION)
    TABLE 57. RUSSIA POWER CABLE MARKET, BY END USE, 2021-2031 (REVENUE, $MILLION)
    TABLE 58. REST OF EUROPE POWER CABLE MARKET, BY DISTRIBUTION TYPE, 2021-2031 (REVENUE, $MILLION)
    TABLE 59. REST OF EUROPE POWER CABLE MARKET, BY VOLTAGE RATING, 2021-2031 (REVENUE, $MILLION)
    TABLE 60. REST OF EUROPE POWER CABLE MARKET, BY END USE, 2021-2031 (REVENUE, $MILLION)
    TABLE 61. ASIA-PACIFIC POWER CABLE MARKET, BY DISTRIBUTION TYPE, 2021-2031 (REVENUE, $MILLION)
    TABLE 62. ASIA-PACIFIC POWER CABLE MARKET, BY VOLTAGE RATING, 2021-2031 (REVENUE, $MILLION)
    TABLE 63. ASIA-PACIFIC POWER CABLE MARKET, BY END USE, 2021-2031 (REVENUE, $MILLION)
    TABLE 64. ASIA-PACIFIC POWER CABLE MARKET, BY COUNTRY, 2021-2031 (REVENUE, $MILLION)
    TABLE 65. CHINA POWER CABLE MARKET, BY DISTRIBUTION TYPE, 2021-2031 (REVENUE, $MILLION)
    TABLE 66. CHINA POWER CABLE MARKET, BY VOLTAGE RATING, 2021-2031 (REVENUE, $MILLION)
    TABLE 67. CHINA POWER CABLE MARKET, BY END USE, 2021-2031 (REVENUE, $MILLION)
    TABLE 68. JAPAN POWER CABLE MARKET, BY DISTRIBUTION TYPE, 2021-2031 (REVENUE, $MILLION)
    TABLE 69. JAPAN POWER CABLE MARKET, BY VOLTAGE RATING, 2021-2031 (REVENUE, $MILLION)
    TABLE 70. JAPAN POWER CABLE MARKET, BY END USE, 2021-2031 (REVENUE, $MILLION)
    TABLE 71. INDIA POWER CABLE MARKET, BY DISTRIBUTION TYPE, 2021-2031 (REVENUE, $MILLION)
    TABLE 72. INDIA POWER CABLE MARKET, BY VOLTAGE RATING, 2021-2031 (REVENUE, $MILLION)
    TABLE 73. INDIA POWER CABLE MARKET, BY END USE, 2021-2031 (REVENUE, $MILLION)
    TABLE 74. SOUTH KOREA POWER CABLE MARKET, BY DISTRIBUTION TYPE, 2021-2031 (REVENUE, $MILLION)
    TABLE 75. SOUTH KOREA POWER CABLE MARKET, BY VOLTAGE RATING, 2021-2031 (REVENUE, $MILLION)
    TABLE 76. SOUTH KOREA POWER CABLE MARKET, BY END USE, 2021-2031 (REVENUE, $MILLION)
    TABLE 77. REST OF ASIA-PACIFIC POWER CABLE MARKET, BY DISTRIBUTION TYPE, 2021-2031 (REVENUE, $MILLION)
    TABLE 78. REST OF ASIA-PACIFIC POWER CABLE MARKET, BY VOLTAGE RATING, 2021-2031 (REVENUE, $MILLION)
    TABLE 79. REST OF ASIA-PACIFIC POWER CABLE MARKET, BY END USE, 2021-2031 (REVENUE, $MILLION)
    TABLE 80. LAMEA POWER CABLE MARKET, BY DISTRIBUTION TYPE, 2021-2031 (REVENUE, $MILLION)
    TABLE 81. LAMEA POWER CABLE MARKET, BY VOLTAGE RATING, 2021-2031 (REVENUE, $MILLION)
    TABLE 82. LAMEA POWER CABLE MARKET, BY END USE, 2021-2031 (REVENUE, $MILLION)
    TABLE 83. LAMEA POWER CABLE MARKET, BY COUNTRY, 2021-2031 (REVENUE, $MILLION)
    TABLE 84. LATIN AMERICA POWER CABLE MARKET, BY DISTRIBUTION TYPE, 2021-2031 (REVENUE, $MILLION)
    TABLE 85. LATIN AMERICA POWER CABLE MARKET, BY VOLTAGE RATING, 2021-2031 (REVENUE, $MILLION)
    TABLE 86. LATIN AMERICA POWER CABLE MARKET, BY END USE, 2021-2031 (REVENUE, $MILLION)
    TABLE 87. MIDDLE EAST POWER CABLE MARKET, BY DISTRIBUTION TYPE, 2021-2031 (REVENUE, $MILLION)
    TABLE 88. MIDDLE EAST POWER CABLE MARKET, BY VOLTAGE RATING, 2021-2031 (REVENUE, $MILLION)
    TABLE 89. MIDDLE EAST POWER CABLE MARKET, BY END USE, 2021-2031 (REVENUE, $MILLION)
    TABLE 90. AFRICA POWER CABLE MARKET, BY DISTRIBUTION TYPE, 2021-2031 (REVENUE, $MILLION)
    TABLE 91. AFRICA POWER CABLE MARKET, BY VOLTAGE RATING, 2021-2031 (REVENUE, $MILLION)
    TABLE 92. AFRICA POWER CABLE MARKET, BY END USE, 2021-2031 (REVENUE, $MILLION)
    TABLE 93.ENCORE WIRE CORPORATION: COMPANY SNAPSHOT
    TABLE 94.ENCORE WIRE CORPORATION: OPERATING SEGMENTS
    TABLE 95.ENCORE WIRE CORPORATION: PRODUCT PORTFOLIO
    TABLE 96.ENCORE WIRE CORPORATION: NET SALES
    TABLE 97.ENCORE WIRE CORPORATION: KEY STRATERGIES
    TABLE 98.BRUGG CABLES: COMPANY SNAPSHOT
    TABLE 99.BRUGG CABLES: OPERATING SEGMENTS
    TABLE 100.BRUGG CABLES: PRODUCT PORTFOLIO
    TABLE 101.BRUGG CABLES: NET SALES
    TABLE 102.BRUGG CABLES: KEY STRATERGIES
    TABLE 103.BELDEN INCORPORATED: COMPANY SNAPSHOT
    TABLE 104.BELDEN INCORPORATED: OPERATING SEGMENTS
    TABLE 105.BELDEN INCORPORATED: PRODUCT PORTFOLIO
    TABLE 106.BELDEN INCORPORATED: NET SALES
    TABLE 107.BELDEN INCORPORATED: KEY STRATERGIES
    TABLE 108.LAPP NORTH AMERICA: COMPANY SNAPSHOT
    TABLE 109.LAPP NORTH AMERICA: OPERATING SEGMENTS
    TABLE 110.LAPP NORTH AMERICA: PRODUCT PORTFOLIO
    TABLE 111.LAPP NORTH AMERICA: NET SALES
    TABLE 112.LAPP NORTH AMERICA: KEY STRATERGIES
    TABLE 113.TPC WIRE & CABLE CORP: COMPANY SNAPSHOT
    TABLE 114.TPC WIRE & CABLE CORP: OPERATING SEGMENTS
    TABLE 115.TPC WIRE & CABLE CORP: PRODUCT PORTFOLIO
    TABLE 116.TPC WIRE & CABLE CORP: NET SALES
    TABLE 117.TPC WIRE & CABLE CORP: KEY STRATERGIES
    TABLE 118.ABB LTD: COMPANY SNAPSHOT
    TABLE 119.ABB LTD: OPERATING SEGMENTS
    TABLE 120.ABB LTD: PRODUCT PORTFOLIO
    TABLE 121.ABB LTD: NET SALES
    TABLE 122.ABB LTD: KEY STRATERGIES
    TABLE 123.NEXANS S.A.: COMPANY SNAPSHOT
    TABLE 124.NEXANS S.A.: OPERATING SEGMENTS
    TABLE 125.NEXANS S.A.: PRODUCT PORTFOLIO
    TABLE 126.NEXANS S.A.: NET SALES
    TABLE 127.NEXANS S.A.: KEY STRATERGIES
    TABLE 128.PRYSMIAN GROUP(GENERAL CABLE): COMPANY SNAPSHOT
    TABLE 129.PRYSMIAN GROUP(GENERAL CABLE): OPERATING SEGMENTS
    TABLE 130.PRYSMIAN GROUP(GENERAL CABLE): PRODUCT PORTFOLIO
    TABLE 131.PRYSMIAN GROUP(GENERAL CABLE): NET SALES
    TABLE 132.PRYSMIAN GROUP(GENERAL CABLE): KEY STRATERGIES
    TABLE 133.RIYADH CABLES GROUP COMPANY: COMPANY SNAPSHOT
    TABLE 134.RIYADH CABLES GROUP COMPANY: OPERATING SEGMENTS
    TABLE 135.RIYADH CABLES GROUP COMPANY: PRODUCT PORTFOLIO
    TABLE 136.RIYADH CABLES GROUP COMPANY: NET SALES
    TABLE 137.RIYADH CABLES GROUP COMPANY: KEY STRATERGIES
    TABLE 138.FINOLEX CABLES LIMITED: COMPANY SNAPSHOT
    TABLE 139.FINOLEX CABLES LIMITED: OPERATING SEGMENTS
    TABLE 140.FINOLEX CABLES LIMITED: PRODUCT PORTFOLIO
    TABLE 141.FINOLEX CABLES LIMITED: NET SALES
    TABLE 142.FINOLEX CABLES LIMITED: KEY STRATERGIES
    TABLE 143.NKT: COMPANY SNAPSHOT
    TABLE 144.NKT: OPERATING SEGMENTS
    TABLE 145.NKT: PRODUCT PORTFOLIO
    TABLE 146.NKT: NET SALES
    TABLE 147.NKT: KEY STRATERGIES
    TABLE 148.KEI INDUSTRIES LTD: COMPANY SNAPSHOT
    TABLE 149.KEI INDUSTRIES LTD: OPERATING SEGMENTS
    TABLE 150.KEI INDUSTRIES LTD: PRODUCT PORTFOLIO
    TABLE 151.KEI INDUSTRIES LTD: NET SALES
    TABLE 152.KEI INDUSTRIES LTD: KEY STRATERGIES
    TABLE 153.POLYCAB INDIA LTD: COMPANY SNAPSHOT
    TABLE 154.POLYCAB INDIA LTD: OPERATING SEGMENTS
    TABLE 155.POLYCAB INDIA LTD: PRODUCT PORTFOLIO
    TABLE 156.POLYCAB INDIA LTD: NET SALES
    TABLE 157.POLYCAB INDIA LTD: KEY STRATERGIES
  • LIST OF FIGURES

  • FIGURE 1.POWER CABLE MARKET SEGMENTATION
    FIGURE 2.POWER CABLE MARKET,2021-2031
    FIGURE 3.POWER CABLE MARKET,2021-2031
    FIGURE 4. TOP INVESTMENT POCKETS, BY REGION
    FIGURE 5.PORTER FIVE-1
    FIGURE 6.PORTER FIVE-2
    FIGURE 7.PORTER FIVE-3
    FIGURE 8.PORTER FIVE-4
    FIGURE 9.PORTER FIVE-5
    FIGURE 10.TOP PLAYER POSITIONING
    FIGURE 11.POWER CABLE MARKET:DRIVERS, RESTRAINTS AND OPPORTUNITIES
    FIGURE 12.POWER CABLE MARKET,BY DISTRIBUTION TYPE,2021(%)
    FIGURE 13.COMPARATIVE SHARE ANALYSIS OF UNDERGROUND POWER CABLE MARKET,2021-2031(%)
    FIGURE 14.COMPARATIVE SHARE ANALYSIS OF SUBMARINE POWER CABLE MARKET,2021-2031(%)
    FIGURE 15.COMPARATIVE SHARE ANALYSIS OF OVERHEAD POWER CABLE MARKET,2021-2031(%)
    FIGURE 16.POWER CABLE MARKET,BY VOLTAGE RATING,2021(%)
    FIGURE 17.COMPARATIVE SHARE ANALYSIS OF UP TO 36 KV POWER CABLE MARKET,2021-2031(%)
    FIGURE 18.COMPARATIVE SHARE ANALYSIS OF 37 KV TO 100 KV POWER CABLE MARKET,2021-2031(%)
    FIGURE 19.COMPARATIVE SHARE ANALYSIS OF 101 KV TO 250 KV POWER CABLE MARKET,2021-2031(%)
    FIGURE 20.COMPARATIVE SHARE ANALYSIS OF 251 KV TO 350 KV POWER CABLE MARKET,2021-2031(%)
    FIGURE 21.COMPARATIVE SHARE ANALYSIS OF 351 KV AND ABOVE POWER CABLE MARKET,2021-2031(%)
    FIGURE 22.POWER CABLE MARKET,BY END USE,2021(%)
    FIGURE 23.COMPARATIVE SHARE ANALYSIS OF RESIDENTIAL POWER CABLE MARKET,2021-2031(%)
    FIGURE 24.COMPARATIVE SHARE ANALYSIS OF COMMERCIAL POWER CABLE MARKET,2021-2031(%)
    FIGURE 25.COMPARATIVE SHARE ANALYSIS OF INDUSTRIAL POWER CABLE MARKET,2021-2031(%)
    FIGURE 26.COMPARATIVE SHARE ANALYSIS OF UTILITIES POWER CABLE MARKET,2021-2031(%)
    FIGURE 27.POWER CABLE MARKET BY REGION,2021
    FIGURE 28.U.S. POWER CABLE MARKET,2021-2031($MILLION)
    FIGURE 29.CANADA POWER CABLE MARKET,2021-2031($MILLION)
    FIGURE 30.MEXICO POWER CABLE MARKET,2021-2031($MILLION)
    FIGURE 31.UK POWER CABLE MARKET,2021-2031($MILLION)
    FIGURE 32.GERMANY POWER CABLE MARKET,2021-2031($MILLION)
    FIGURE 33.FRANCE POWER CABLE MARKET,2021-2031($MILLION)
    FIGURE 34.RUSSIA POWER CABLE MARKET,2021-2031($MILLION)
    FIGURE 35.REST OF EUROPE POWER CABLE MARKET,2021-2031($MILLION)
    FIGURE 36.CHINA POWER CABLE MARKET,2021-2031($MILLION)
    FIGURE 37.JAPAN POWER CABLE MARKET,2021-2031($MILLION)
    FIGURE 38.INDIA POWER CABLE MARKET,2021-2031($MILLION)
    FIGURE 39.SOUTH KOREA POWER CABLE MARKET,2021-2031($MILLION)
    FIGURE 40.REST OF ASIA-PACIFIC POWER CABLE MARKET,2021-2031($MILLION)
    FIGURE 41.LATIN AMERICA POWER CABLE MARKET,2021-2031($MILLION)
    FIGURE 42.MIDDLE EAST POWER CABLE MARKET,2021-2031($MILLION)
    FIGURE 43.AFRICA POWER CABLE MARKET,2021-2031($MILLION)
    FIGURE 44. TOP WINNING STRATEGIES, BY YEAR
    FIGURE 45. TOP WINNING STRATEGIES, BY DEVELOPMENT
    FIGURE 46. TOP WINNING STRATEGIES, BY COMPANY
    FIGURE 47.PRODUCT MAPPING OF TOP 10 PLAYERS
    FIGURE 48.COMPETITIVE DASHBOARD
    FIGURE 49.COMPETITIVE HEATMAP OF TOP 10 KEY PLAYERS
    FIGURE 50.ENCORE WIRE CORPORATION.: NET SALES ($MILLION)
    FIGURE 51.BRUGG CABLES.: NET SALES ($MILLION)
    FIGURE 52.BELDEN INCORPORATED.: NET SALES ($MILLION)
    FIGURE 53.LAPP NORTH AMERICA.: NET SALES ($MILLION)
    FIGURE 54.TPC WIRE & CABLE CORP.: NET SALES ($MILLION)
    FIGURE 55.ABB LTD.: NET SALES ($MILLION)
    FIGURE 56.NEXANS S.A..: NET SALES ($MILLION)
    FIGURE 57.PRYSMIAN GROUP(GENERAL CABLE).: NET SALES ($MILLION)
    FIGURE 58.RIYADH CABLES GROUP COMPANY.: NET SALES ($MILLION)
    FIGURE 59.FINOLEX CABLES LIMITED.: NET SALES ($MILLION)
    FIGURE 60.NKT.: NET SALES ($MILLION)
    FIGURE 61.KEI INDUSTRIES LTD.: NET SALES ($MILLION)
    FIGURE 62.POLYCAB INDIA LTD.: NET SALES ($MILLION)


The power cable market is projected to depict prominent growth during the forecast period, owing to various factors, such as a rise in the trend of renewable energy generation and an increase in the deployment of new power grid infrastructure. Moreover, the surge in the implementation of smart grids boosts the growth of the market during the forecast period. However, the complexity in deployment planning of power cables along with the delays in authorization from governments is projected to hamper the growth of the market during the forecast period. On the contrary, an upsurge in demand for power all over the world creates lucrative growth opportunities for market growth.

Vendors operating in the market are offering advanced power cables due to the competition. Also, the rise in investment trends among the various countries for the development and transmission of green energy fuels the growth of the market. For instance, in June 2021, Prysmian Group, the world leader in the energy and telecom cable systems industry, announced the finalization of the contract with SOO Green HVDC Link for the supply and installation of high-voltage direct current cable systems. The 2,100-megawatt interregional project, which is regarded as the first piece of a national clean energy grid, will interconnect the two biggest energy markets in the U.S. and provide plentiful, inexpensive renewable energy to major population centers from Chicago to the mid-Atlantic region.

Various leading manufacturers such as ABB Ltd., Belden Incorporated, Encore Wire Corporation, Finolex Cables, KEI Industries Limited, LAPP North America, Nexans, NKT A/S, Prysmian Group and TPC Wire & Cable Corp occupy a prominent revenue share in the power cable market.

PURCHASE OPTIONS

Call or Email us

U.S.-Canada Toll-free: +1-800-792-5285
Int'l : +1-503-894-6022
Europe : +44-845-528-1300
Email : help@alliedmarketresearch.com
 
FREQUENTLY ASKED QUESTIONS?

A. Asia-Pacific is the largest regional market for Power Cables.

A. The residential segment is leading the power cable market in 2021.

A. The power cable market was valued at $148.58 billion in 2021, and is projected to reach $277.80 billion by 2031, registering a CAGR of 6.4% from 2022 to 2031

A. An increase in the deployment of new power grid infrastructure boosts the growth in demand for power cables and is expected to drive market growth.

A. BB Ltd, Brugg Cables, Nexans, NKT A/S, and Prysmian Group are the top five companies holding a prime share in the Power cable market

Looking for Customization?

 Customization Request

Have a Question?

 Speak with Analyst

Any Confusion?

 Inquire Before Buying

Have a glance of the Report

  Request Sample
RELATED TAGS

Purchase Full Report of
Power Cable Market

Start reading instantly.
This Report and over 67,404+ more Reports, Available with Avenue Library. T&C*.

  • Online Only
  • $3,570
  • Online cloud access only
  • Restricted print, copy, paste & download
  • Read only
  • Free industry update
    (Within 180 days)
  • Free report update in next update cycle
    (Dec 2023 - Dec 2024)
  • Data Pack
  • $3,840
  • Restricted to one authorized user
  • One print only
  • Available in
    Excel
  • Free industry update
    (Within 180 days)
  •   Free report update in next update cycle
    (Dec 2023 - Dec 2024)
  • Single User
  • $5,730
  • Restricted to one authorized user
  • One print only
  • Available in
    PDF
  • Free industry update
    (Within 180 days)
  •   Free report update in next update cycle
    (Dec 2023 - Dec 2024)
  • Five Users
  • $6,450
  • Limited to five authorized users
  • Print upto five copies
  • Available in
    PDF
  • Free industry update
    (Within 180 days)
  •   Free report update in next update cycle
    (Dec 2023 - Dec 2024)
  • Enterprise
    License/PDF

  • $9,600
  • Unlimited
    within
    company/enterprise
  • Available in Excel & PDF
  • Free industry update
    (Within 180 days)
  •   Free report update in next update cycle
    (Dec 2023 - Dec 2024)
  • Library
    Membership

  • $999 $ 1,175
    Per User/ Per month/ Billed annually
  • Published Content
    E-access
  • Company Profiles
    E-access
  • Newly Added Content Access
  • 10 PDF
    Downloads
  • 5 Excel Data
    Pack Downloads
  • 250 Company Profiles PDF Downloads
  • Buy Now

*Taxes/Fees, if applicable will be added during checkout. All prices in USD

RELATED REPORTS
 

Why Allied Market Research?


Infallible Methodology

To ensure high-level data integrity, accurate analysis, and impeccable forecasts

Analyst Support

For complete satisfaction

Customization

On-demand customization of scope of the report to exactly meet your needs

TARGETED MARKET VIEW

Targeted market view to provide pertinent information and save time of readers

Get fresh content delivered

Get insights on topics that are crucial for your business. Stay abreast of your interest areas.

Get Industry Data Alerts

Why Allied Market Research?

Infallible Methodology

To ensure high-level data integrity, accurate analysis, and impeccable forecasts

Analyst Support

For complete satisfaction

Customization

On-demand customization of scope of the report to exactly meet your needs

TARGETED MARKET VIEW

Targeted market view to provide pertinent information and save time of readers