
Protease Market Summary
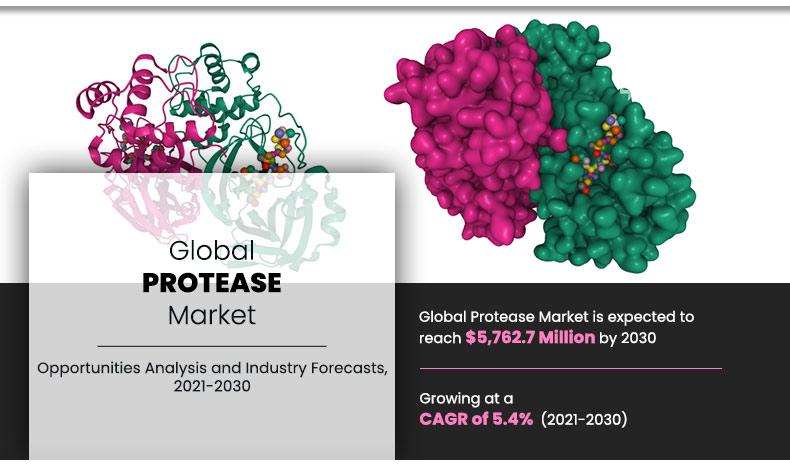
The global protease market size was valued at $3,454.3 million in 2020, and is projected to reach $5,762.7 million by 2030, registering a CAGR of 5.4% from 2021 to 2030. The global market is expected to witness a significant demand during the forecast period, owing to rise in applications in the pharmaceutical industry for its therapeutic benefits such as anticancer, antimicrobial, and anti-inflammation.
Key Market Trends and Insights
Region wise, North America generated the highest revenue in 2020.
The global protease market share was dominated by the microbes segment in 2020 and is expected to maintain its dominance in the upcoming years
The plant-based protein segment is expected to witness the highest growth during the forecast
Market Size & Forecast
- 2020 Market Size: USD 3,454.3 Million
- 2030 Projected Market Size: USD 5,762.7 Million
- Compound Annual Growth Rate (CAGR) (2021-2030): 5.4%
- North America: Generated the highest revenue in 2020
Proteases are used in production of various drugs for treatment of digestive disorders, cardiovascular diseases, and chronic pains. Furthermore, stain removal property of protease has significantly led to rise in adoption in production of laundry detergents across the globe. Therapeutics and nutritional benefits of protease enzymes has resulted in rise in demand for protease in the foods and beverages industry for adding flavor, texture, and extension of shelf life of foods and beverages. Thus, surge in use of protease drives the global protease market growth.
Protease enzymes also have huge application in the leather and wool processing industry. Chemical processing of leather leads to emission of hazardous gases and unpleasant smell that can also lead to death. Protease enzymes are eco-friendly substitutes to chemicals used in the leather processing. Furthermore, rise in adoption of protease in industrial waste management, photographic industry, and silk degumming is expected to boost growth of the global protease market forecast.
Segment Review
According to the protease market analysis, the global market is segmented bon the basis of source, application, and region. By source, the market is categorized into plants, animals, and microbes. Further, on the basis of application, the market is segmented into foods & beverages, pharmaceuticals, animal feed, soap & detergents, and others. Region-wise, the market is analyzed across North America (the U.S., Canada, and Mexico), Europe (Germany, France, Italy, the UK, Spain, and rest of Europe), Asia-Pacific (China, Japan, India, South Korea, Australia, and rest of Asia-Pacific), and LAMEA (Brazil, South Africa, Saudi Arabia, and rest of LAMEA).
By Source
Microbes segment held the major share of 62.6% in 2020
As per the protease market trends, on the basis of source, the global market was dominated by the microbes segment in 2020. This is attributed to rise in production of protease from microbes. Production of protease at industrial level is possible by using microbial sources and huge level production helps in meeting the demand for proteases across various industries. Higher yield, cost-effectiveness, easy gene manipulation, and less time consumption are some of the most unique features of microbial proteases that makes them perfectly suitable for various applications.
On the basis of application, the protease market was dominated by the soap & detergents segment, which garnered about 43.3% of the market share in 2020. Stain removal property of protease has made its useful in production of detergents. Growth in health consciousness and rise in consumer awareness regarding hygiene and cleanliness is expected to fuel demand for soaps & detergents, which fuel growth of the market.
By Application
Soap & Detergents segment held the major share of 43.3% in 2020
Region wise, Asia-Pacific is projected to be the fastest-growing market. Presence of huge population, rise in disposable income, growth in awareness regarding cleanliness, and rise in burden of diseases are the prominent factors that are expected to fuel demand for detergents and various pharmaceutical drugs in the region. This is expected to surge demand for protease in the manufacturing of detergents and medicines. Furthermore, rise in demand for foods & beverages in the region is further expected to boost growth of the protease market in the future.
Competitive Landscape
Key market players operating in the protease market are constantly involved in various developmental strategies such as new product launches, partnerships, and acquisition & mergers to gain competitive advantage over others and exploit the prevailing market opportunities. Key players profiled in this report include Advanced Enzyme Technologies, Amano Enzyme, Inc., Associated British Foods Plc, BASF SE, Biocatalysts Ltd., Dyadic International, Inc., E.I. Du Pont De Nemours and Company, Koninklijke DSM N.V., Novozymes A/S, and Specialty Enzymes & Probiotics.
By Region
North America held the major share of 35.6% in 2020
Key Benefits For Stakeholders
- The report provides a quantitative analysis of the current market trends, estimations, and dynamics of the market size from 2020 to 2030 to identify the prevailing opportunities.
- Porter’s five forces analysis highlights the potency of buyers and suppliers to enable stakeholders to make profit-oriented business decisions and strengthen their supplier–buyer network.
- In-depth analysis and the market size and segmentation assist to determine the prevailing protease market opportunities.
- The major countries in each region are mapped according to their revenue contribution to the market.
- The market player positioning segment facilitates benchmarking and provides a clear understanding of the present position of the market players in the protease industry.
Protease Market Report Highlights
| Aspects | Details |
| By Source |
|
| By Application |
|
| By Region |
|
Analyst Review
In recent years, owing to their numerous functional properties, protease enzymes have been highly employed in various industries such as pharmaceuticals & biotechnology, food, textiles, and biofuels. In the food industry, protease not only improves food quality but also accelerates reaction specificity. For instance, protease enzymes help in conversion of protein and prolong shelf life of products. In addition, they possess properties such as food softening and staleness inhibition, which makes them ideal for use in foods & beverages and other industries.
Surge in number of patients suffering from chronic disease leads to high demand for effective pharmaceuticals, which acts as the major driving factor for the global protease market. Other factors such as increase in adoption of protease, rise in digestive disorders, and wide applications of protease enzymes across several industry verticals are expected to have a significant impact on the market growth. The overall increase in consumption of functional foods & beverages (which contain enzymes) and rise in healthcare expenditures in developing regions is projected to have a positive impact on the market growth.
Use of protease enzymes is the highest in North America, owing to technological advancements and recovering American economy, which has led to increase in healthcare expenditures in the region. However, the Asia-Pacific protease market is expected to grow at a significant rate, owing to increase in healthcare facilities and growth in manufacturing base, especially in Japan, India, and China.
The global protease market size was valued at $3,454.3 million in 2020, and is projected to reach $5,762.7 million by 2030
The global Protease market is projected to grow at a compound annual growth rate of 5.4%, from 2021 to 2030 $5,762.7 million by 2030
Key players profiled in this report include Advanced Enzyme Technologies, Amano Enzyme, Inc., Associated British Foods Plc, BASF SE, Biocatalysts Ltd., Dyadic International, Inc., E.I. Du Pont De Nemours and Company, Koninklijke DSM N.V., Novozymes A/S, and Specialty Enzymes & Probiotics.
Region wise, Asia-Pacific is projected to be the fastest-growing market
Rise in demand from foods & beverages industry, increase in preference regarding healthy and nutritional food, growth in demand from soap & detergents industry, and surge in applications in the pharmaceuticals industry drive the growth of the global protease market.
Loading Table Of Content...

