0
New
New
2023
Smart Poles Market

Smart Poles Market

by Type of Hardware (Lighting Lamp, Pole Bracket and Pole Body, Communication Device, Controller, Others), by Products (Hardware, Software, Services), by Installation (New Installation, Retrofit), by Application (Highways and Roadways, Public Places, Railways and Harbors): Global Opportunity Analysis and Industry Forecast, 2021-2031

Report Code: A08459
Mar 2023 | Pages: 280
Tables: 138
Charts: 60
  • Formats*:

  • pdf

    Single User License, Five User
    License & Enterprise User License

  • xls

    Data Pack Excel License

  • ppt

    It comes with the additional cost
    of $2500.00 contact sales.


Smart Poles Market Research, 2031

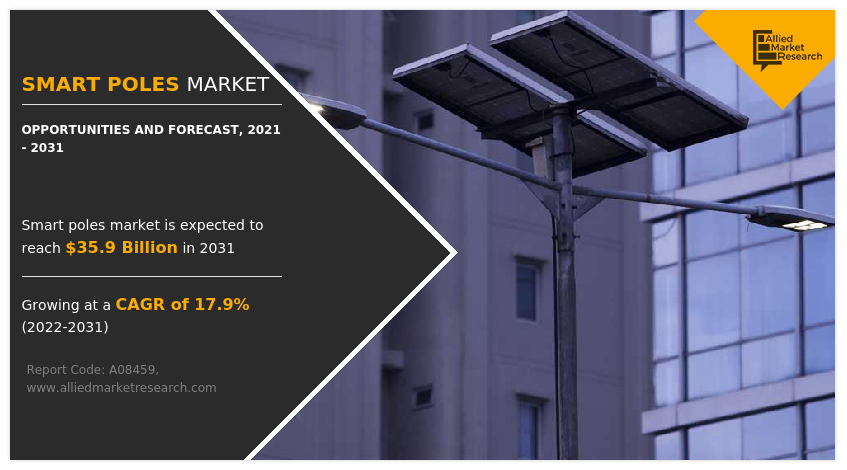
The global smart poles market was valued at $7.1 billion in 2021, and is projected to reach $35.9 billion by 2031, growing at a CAGR of 17.9% from 2022 to 2031. Smart poles are becoming more popular due to their multi-functionality. Smart poles are an essential component of the smart city infrastructure, which aims to make cities more efficient, sustainable, and safer. They are designed to support the development of smart cities by providing a network of infrastructure that can support the integration of advanced technologies such as 5G, IoT, and AI.
The COVID-19 pandemic has brought significant economic losses as a result of the shutdown of many businesses. Supply chain disruptions, the closing of manufacturing facilities, and a global economic recession has ultimately reduced the need for smart poles. For instance, in the construction sector, many construction projects were delayed or canceled as a result of a lack of manpower and raw materials. Thus, the market for smart poles was significantly impacted by the COVID-19 outbreak.

Smart Poles Market

There is a rise in the need for a well-established, resilient infrastructure for proper traffic management, as well as an increase in the use of connected devices and cutting-edge technologies. Smart poles, also known as intelligent light poles, can provide primary illumination as well as sophisticated features such as intelligent lights, communication devices, cameras, weather monitoring systems, announcement speakers, signs, and an optional EV charger. Smart poles are commonly used in essential sites such as public spaces, roadways, highways, harbors, and railways, as well as by many state governments to provide Wi-Fi connectivity to their citizens.

However, countries with limited resources are unable to employ smart pole solutions due to the high cost of establishing the 5G smart pole, Internet of Things (IoT), and artificial intelligence (AI) systems. This factor is expected to hamper the smart poles market growth. The cost of transforming existing infrastructure serves as a constraint for governments to retain large-scale investments. Though smarter infrastructure reduces operating costs and increases energy efficiency, upfront costs are a significant obstacle to the market growth.

Smart light pole can be an integral part of smart city infrastructure. With the increase in smart city initiatives across the globe, the demand for smart poles is likely to increase. With the rise in the need for efficient and sustainable urban infrastructure, governments and municipal corporations are investing in smart city projects. All these factors are projected to lead to an increase in demand for smart poles in the upcoming years. The increase in smart city initiatives and the adoption of smart poles is anticipated to create significant opportunities for the smart poles market players.

The key players profiled in this smart poles industry report include Philips Lighting Holding B.V., GE Lighting Co. Ltd, Hubbell Incorporated, Cree, Inc., Eaton Corporation, Acuity Brands, Sunna Design, Mobile Pro Systems, Goldspar Australia Pty Ltd., and Virtual Extension Ltd.

The smart poles market analysis report is segmented on the basis of type of hardware, products, installation, application, and region. By type of hardware, it is classified into lighting lamp, pole bracket and pole body, communication device, controller, and others. By products, it is classified into hardware, software, and services. By installation, it is classified into new installation and retrofit. By application, it is classified into highways and roadways, public places, and railways and harbors. By region, the market is analyzed across North America, Europe, Asia-Pacific, and LAMEA.

The smart poles market is segmented into Type of Hardware, Installation, Products and Application.
Smart Poles Market

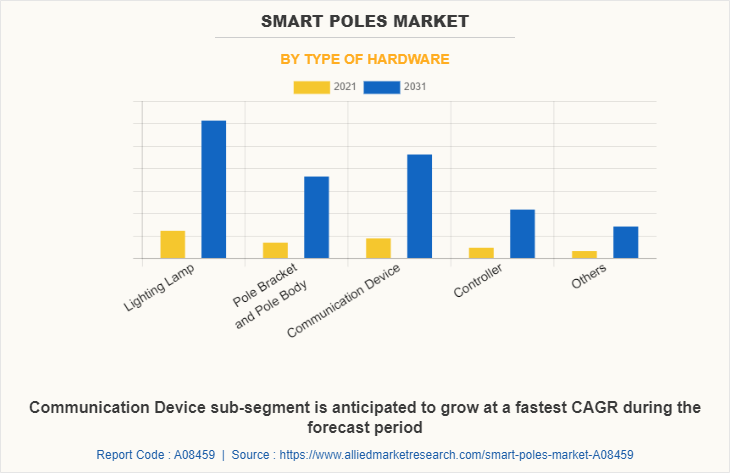
By type of hardware, the lighting lamp sub-segment dominated the market in 2021. The lighting lamp market is highly fragmented, with numerous producers launching lamps of various sizes. The lighting in smart poles is an important feature that provides illumination for pedestrians and drivers, enhances public safety, and reduces energy consumption through intelligent control systems. The driver of the lighting lamp segment in smart poles is an electronic circuit that regulates the power supply to the lighting system, which is essential for their optimal performance and longevity. These are predicted to be the major factors affecting the smart poles market size during the forecast period.
Smart Poles Market

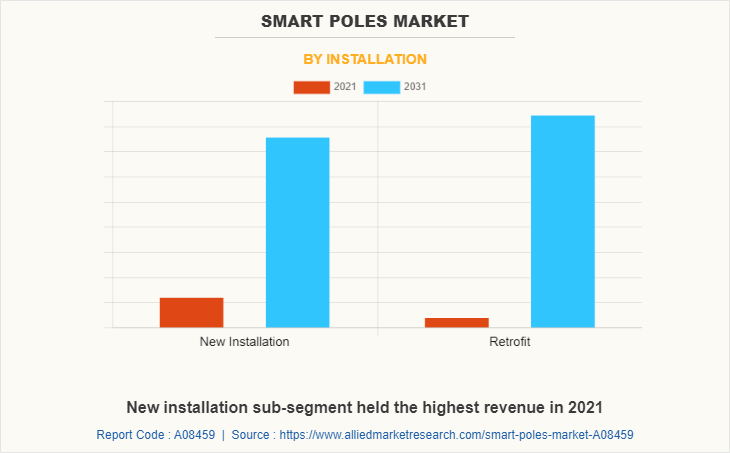
By installation, the retrofit sub-segment dominated the global smart poles market share in 2021. Retrofit smart poles perform an essential role in addressing the problem of urban air pollution since they can monitor a variety of environmental parameters, such as particulate matter concentrations, temperature, and humidity, to provide a comprehensive picture of an area's overall air quality. Such applications of retrofit smart poles are estimated to drive the growth for the sub-segment during the forecast period.
Smart Poles Market

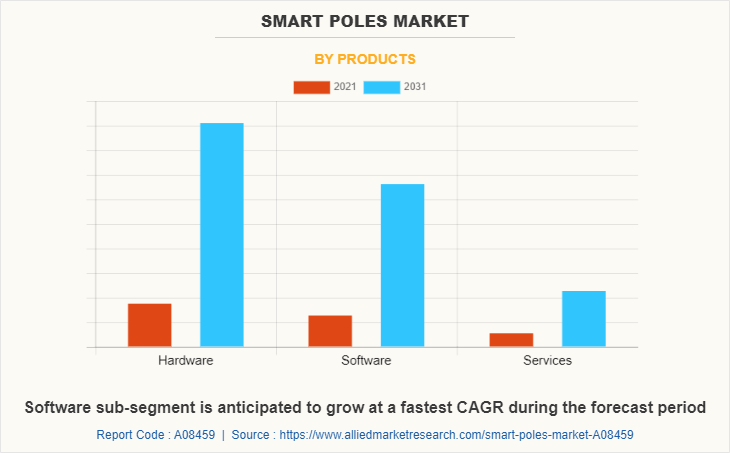
By products, the hardware sub-segment dominated the global smart poles market share in 2021. The hardware segment of the smart poles market includes the physical components and devices that allow the poles to function as intelligent and connected devices. Many smart poles installed across the world are equipped with cameras and air quality sensors to monitor growing pollution levels. Several mobile technology companies are collaborating with alternative energy system suppliers to develop and market efficient poles that support video analytics, intelligent lighting, and Wi-Fi access points. Such collaborations help to create opportunities for camera and air quality sensor manufacturers to produce unique solutions for smart poles. These factors are expected to increase the demand for the hardware segment in the upcoming years.
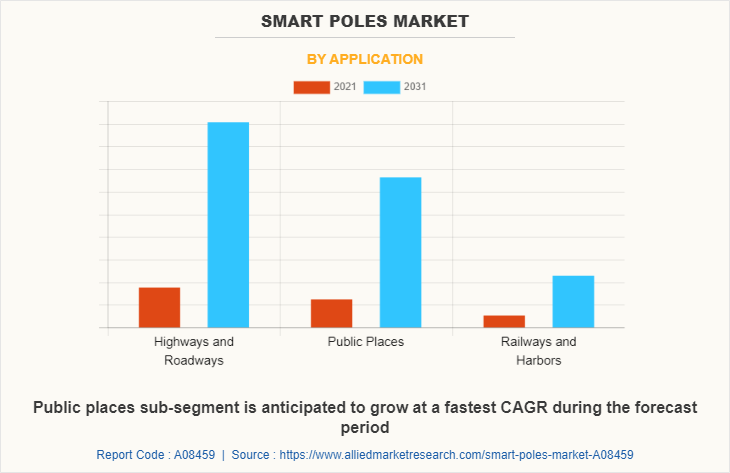
Smart Poles Market

By application, the new installation sub-segment dominated the global smart poles market share in 2021. There is a rise in government activities towards the construction of smart poles in industrialized nations such as the U.S., the UK, France, and Germany. Furthermore, industry participants such as ELKO EP, E.ON SE, and Signify Holdings are focusing on the development of smart poles equipped with security cameras, air quality sensors, and optional electric car chargers.
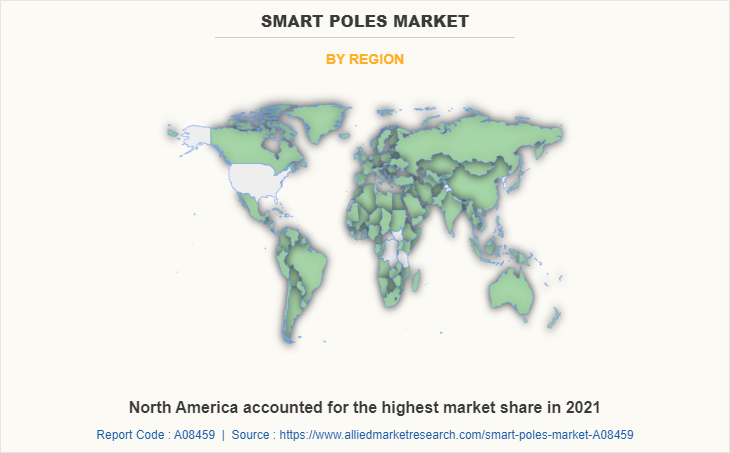
Smart Poles Market

By region, North America dominated the global market in 2021. The smart poles demand in countries, namely the U.S. and Canada, are growing rapidly as they can cut down on energy expenditures. The system appears to be primarily driven by the falling cost of LED lights and the excellent return on investment (ROI) from smart lighting. The development of smart poles system is also being aided by numerous amenities including Wi-Fi connectivity, electric vehicle charging stations, and pollution monitors. The demand is rising owing to some of its features such as real-time monitoring and daylight-saving time. The increase in implementation of connected streetlights in the region is expected to boost the market growth. Several areas in the U.S. have taken steps to install AI-powered smart poles to help citizens and business owners in emergency circumstances.

Impact of COVID-19 on the Global Smart Poles Industry

  • Nearly the entire world has been impacted by COVID-19, which has severely disrupted economic and healthcare systems. Governments were forced to take measures such as lockdowns, travel restrictions, and social distancing due to the pandemic. These steps were taken by governments around the world to control the spread of the virus and reduce the number of fatalities.
  • The outbreak of the COVID-19 pandemic has caused a global economic slowdown. The operations of various construction and development projects were also affected, putting the growth of the smart pole market at risk. To halt the spread of the virus, the governments of the U.S. and China, for example, had to put a halt to construction and infrastructure activities during the pandemic. However, as limitations are eased throughout the globe, the market is expected to grow significantly during the forecast period.
  • For example, the crisis that brought Silicon Valley dangerously close to total closure made it difficult to fulfill the requirements of the development of smart cities and hindered strategic management and planning by the government and other stakeholders.
  • The establishment of new smart pole projects has been hampered by the global economic slump since the healthcare industry received the majority of government funding as a result of the COVID-19 virus's quick spread, which has had a significant negative impact on the market.

Key Benefits For Stakeholders

  • This report provides a quantitative analysis of the market segments, current trends, estimations, and dynamics of the smart poles market overviews from 2021 to 2031 to identify the prevailing smart poles market opportunities.
  • The market research is offered along with information related to key drivers, restraints, and opportunities.
  • Porter's five forces analysis highlights the potency of buyers and suppliers to enable stakeholders make profit-oriented business decisions and strengthen their supplier-buyer network.
  • In-depth analysis of the smart poles market segmentation assists to determine the prevailing market opportunities.
  • Major countries in each region are mapped according to their revenue contribution to the global market.
  • Market player positioning facilitates benchmarking and provides a clear understanding of the present position of the market players.
  • The report includes the analysis of the regional as well as global smart poles market trends, key players, market segments, application areas, and market growth strategies.

Smart Poles Market Report Highlights

Aspects Details
Market Size By 2031 USD 35.9 billion
Growth Rate CAGR of 17.9%
Forecast period 2021 - 2031
Report Pages 280
By Type of Hardware
  • Lighting Lamp
  • Pole Bracket and Pole Body
  • Communication Device
  • Controller
  • Others
By Installation
  • New Installation
  • Retrofit
By Products
  • Hardware
  • Software
  • Services
By Application
  • Highways and Roadways
  • Public Places
  • Railways and Harbors
By Region
  • North America  (U.S., Canada, Mexico)
  • Europe  (UK, Germany, France, Spain, Italy, Rest of Europe)
  • Asia-Pacific  (China, India, Japan, South Korea, Australia, Rest of Asia-Pacific)
  • LAMEA  (Brazil, Saudi Arabia, UAE, South Africa, Rest of LAMEA)
Key Market Players Philips Lighting Holding B.V., Acuity Brands, Inc., GE Lighting Co. Ltd, Hubbell Incorporated, Goldspar Australia Pty Ltd., Virtual Extension Ltd., Cree, Inc., Mobile Pro Systems, Sunna Design, Eaton Corporation
 
  • CHAPTER 1: INTRODUCTION

    • 1.1. Report description

    • 1.2. Key market segments

    • 1.3. Key benefits to the stakeholders

    • 1.4. Research Methodology

      • 1.4.1. Primary research

      • 1.4.2. Secondary research

      • 1.4.3. Analyst tools and models

  • CHAPTER 2: EXECUTIVE SUMMARY

    • 2.1. CXO Perspective

  • CHAPTER 3: MARKET OVERVIEW

    • 3.1. Market definition and scope

    • 3.2. Key findings

      • 3.2.1. Top impacting factors

      • 3.2.2. Top investment pockets

    • 3.3. Porter’s five forces analysis

    • 3.4. Market dynamics

      • 3.4.1. Drivers

      • 3.4.2. Restraints

      • 3.4.3. Opportunities

    • 3.5. COVID-19 Impact Analysis on the market

    • 3.6. Key Regulation Analysis

    • 3.7. Market Share Analysis

    • 3.8. Patent Landscape

    • 3.9. Regulatory Guidelines

    • 3.10. Value Chain Analysis

  • CHAPTER 4: SMART POLES MARKET, BY TYPE OF HARDWARE

    • 4.1. Overview

      • 4.1.1. Market size and forecast

    • 4.2. Lighting Lamp

      • 4.2.1. Key market trends, growth factors and opportunities

      • 4.2.2. Market size and forecast, by region

      • 4.2.3. Market share analysis by country

    • 4.3. Pole Bracket and Pole Body

      • 4.3.1. Key market trends, growth factors and opportunities

      • 4.3.2. Market size and forecast, by region

      • 4.3.3. Market share analysis by country

    • 4.4. Communication Device

      • 4.4.1. Key market trends, growth factors and opportunities

      • 4.4.2. Market size and forecast, by region

      • 4.4.3. Market share analysis by country

    • 4.5. Controller

      • 4.5.1. Key market trends, growth factors and opportunities

      • 4.5.2. Market size and forecast, by region

      • 4.5.3. Market share analysis by country

    • 4.6. Others

      • 4.6.1. Key market trends, growth factors and opportunities

      • 4.6.2. Market size and forecast, by region

      • 4.6.3. Market share analysis by country

  • CHAPTER 5: SMART POLES MARKET, BY PRODUCTS

    • 5.1. Overview

      • 5.1.1. Market size and forecast

    • 5.2. Hardware

      • 5.2.1. Key market trends, growth factors and opportunities

      • 5.2.2. Market size and forecast, by region

      • 5.2.3. Market share analysis by country

    • 5.3. Software

      • 5.3.1. Key market trends, growth factors and opportunities

      • 5.3.2. Market size and forecast, by region

      • 5.3.3. Market share analysis by country

    • 5.4. Services

      • 5.4.1. Key market trends, growth factors and opportunities

      • 5.4.2. Market size and forecast, by region

      • 5.4.3. Market share analysis by country

  • CHAPTER 6: SMART POLES MARKET, BY INSTALLATION

    • 6.1. Overview

      • 6.1.1. Market size and forecast

    • 6.2. New Installation

      • 6.2.1. Key market trends, growth factors and opportunities

      • 6.2.2. Market size and forecast, by region

      • 6.2.3. Market share analysis by country

    • 6.3. Retrofit

      • 6.3.1. Key market trends, growth factors and opportunities

      • 6.3.2. Market size and forecast, by region

      • 6.3.3. Market share analysis by country

  • CHAPTER 7: SMART POLES MARKET, BY APPLICATION

    • 7.1. Overview

      • 7.1.1. Market size and forecast

    • 7.2. Highways and Roadways

      • 7.2.1. Key market trends, growth factors and opportunities

      • 7.2.2. Market size and forecast, by region

      • 7.2.3. Market share analysis by country

    • 7.3. Public Places

      • 7.3.1. Key market trends, growth factors and opportunities

      • 7.3.2. Market size and forecast, by region

      • 7.3.3. Market share analysis by country

    • 7.4. Railways and Harbors

      • 7.4.1. Key market trends, growth factors and opportunities

      • 7.4.2. Market size and forecast, by region

      • 7.4.3. Market share analysis by country

  • CHAPTER 8: SMART POLES MARKET, BY REGION

    • 8.1. Overview

      • 8.1.1. Market size and forecast By Region

    • 8.2. North America

      • 8.2.1. Key trends and opportunities

      • 8.2.2. Market size and forecast, by Type of Hardware

      • 8.2.3. Market size and forecast, by Products

      • 8.2.4. Market size and forecast, by Installation

      • 8.2.5. Market size and forecast, by Application

      • 8.2.6. Market size and forecast, by country

        • 8.2.6.1. U.S.
          • 8.2.6.1.1. Key market trends, growth factors and opportunities
          • 8.2.6.1.2. Market size and forecast, by Type of Hardware
          • 8.2.6.1.3. Market size and forecast, by Products
          • 8.2.6.1.4. Market size and forecast, by Installation
          • 8.2.6.1.5. Market size and forecast, by Application
        • 8.2.6.2. Canada
          • 8.2.6.2.1. Key market trends, growth factors and opportunities
          • 8.2.6.2.2. Market size and forecast, by Type of Hardware
          • 8.2.6.2.3. Market size and forecast, by Products
          • 8.2.6.2.4. Market size and forecast, by Installation
          • 8.2.6.2.5. Market size and forecast, by Application
        • 8.2.6.3. Mexico
          • 8.2.6.3.1. Key market trends, growth factors and opportunities
          • 8.2.6.3.2. Market size and forecast, by Type of Hardware
          • 8.2.6.3.3. Market size and forecast, by Products
          • 8.2.6.3.4. Market size and forecast, by Installation
          • 8.2.6.3.5. Market size and forecast, by Application
    • 8.3. Europe

      • 8.3.1. Key trends and opportunities

      • 8.3.2. Market size and forecast, by Type of Hardware

      • 8.3.3. Market size and forecast, by Products

      • 8.3.4. Market size and forecast, by Installation

      • 8.3.5. Market size and forecast, by Application

      • 8.3.6. Market size and forecast, by country

        • 8.3.6.1. UK
          • 8.3.6.1.1. Key market trends, growth factors and opportunities
          • 8.3.6.1.2. Market size and forecast, by Type of Hardware
          • 8.3.6.1.3. Market size and forecast, by Products
          • 8.3.6.1.4. Market size and forecast, by Installation
          • 8.3.6.1.5. Market size and forecast, by Application
        • 8.3.6.2. Germany
          • 8.3.6.2.1. Key market trends, growth factors and opportunities
          • 8.3.6.2.2. Market size and forecast, by Type of Hardware
          • 8.3.6.2.3. Market size and forecast, by Products
          • 8.3.6.2.4. Market size and forecast, by Installation
          • 8.3.6.2.5. Market size and forecast, by Application
        • 8.3.6.3. France
          • 8.3.6.3.1. Key market trends, growth factors and opportunities
          • 8.3.6.3.2. Market size and forecast, by Type of Hardware
          • 8.3.6.3.3. Market size and forecast, by Products
          • 8.3.6.3.4. Market size and forecast, by Installation
          • 8.3.6.3.5. Market size and forecast, by Application
        • 8.3.6.4. Spain
          • 8.3.6.4.1. Key market trends, growth factors and opportunities
          • 8.3.6.4.2. Market size and forecast, by Type of Hardware
          • 8.3.6.4.3. Market size and forecast, by Products
          • 8.3.6.4.4. Market size and forecast, by Installation
          • 8.3.6.4.5. Market size and forecast, by Application
        • 8.3.6.5. Italy
          • 8.3.6.5.1. Key market trends, growth factors and opportunities
          • 8.3.6.5.2. Market size and forecast, by Type of Hardware
          • 8.3.6.5.3. Market size and forecast, by Products
          • 8.3.6.5.4. Market size and forecast, by Installation
          • 8.3.6.5.5. Market size and forecast, by Application
        • 8.3.6.6. Rest of Europe
          • 8.3.6.6.1. Key market trends, growth factors and opportunities
          • 8.3.6.6.2. Market size and forecast, by Type of Hardware
          • 8.3.6.6.3. Market size and forecast, by Products
          • 8.3.6.6.4. Market size and forecast, by Installation
          • 8.3.6.6.5. Market size and forecast, by Application
    • 8.4. Asia-Pacific

      • 8.4.1. Key trends and opportunities

      • 8.4.2. Market size and forecast, by Type of Hardware

      • 8.4.3. Market size and forecast, by Products

      • 8.4.4. Market size and forecast, by Installation

      • 8.4.5. Market size and forecast, by Application

      • 8.4.6. Market size and forecast, by country

        • 8.4.6.1. China
          • 8.4.6.1.1. Key market trends, growth factors and opportunities
          • 8.4.6.1.2. Market size and forecast, by Type of Hardware
          • 8.4.6.1.3. Market size and forecast, by Products
          • 8.4.6.1.4. Market size and forecast, by Installation
          • 8.4.6.1.5. Market size and forecast, by Application
        • 8.4.6.2. India
          • 8.4.6.2.1. Key market trends, growth factors and opportunities
          • 8.4.6.2.2. Market size and forecast, by Type of Hardware
          • 8.4.6.2.3. Market size and forecast, by Products
          • 8.4.6.2.4. Market size and forecast, by Installation
          • 8.4.6.2.5. Market size and forecast, by Application
        • 8.4.6.3. Japan
          • 8.4.6.3.1. Key market trends, growth factors and opportunities
          • 8.4.6.3.2. Market size and forecast, by Type of Hardware
          • 8.4.6.3.3. Market size and forecast, by Products
          • 8.4.6.3.4. Market size and forecast, by Installation
          • 8.4.6.3.5. Market size and forecast, by Application
        • 8.4.6.4. South Korea
          • 8.4.6.4.1. Key market trends, growth factors and opportunities
          • 8.4.6.4.2. Market size and forecast, by Type of Hardware
          • 8.4.6.4.3. Market size and forecast, by Products
          • 8.4.6.4.4. Market size and forecast, by Installation
          • 8.4.6.4.5. Market size and forecast, by Application
        • 8.4.6.5. Australia
          • 8.4.6.5.1. Key market trends, growth factors and opportunities
          • 8.4.6.5.2. Market size and forecast, by Type of Hardware
          • 8.4.6.5.3. Market size and forecast, by Products
          • 8.4.6.5.4. Market size and forecast, by Installation
          • 8.4.6.5.5. Market size and forecast, by Application
        • 8.4.6.6. Rest of Asia-Pacific
          • 8.4.6.6.1. Key market trends, growth factors and opportunities
          • 8.4.6.6.2. Market size and forecast, by Type of Hardware
          • 8.4.6.6.3. Market size and forecast, by Products
          • 8.4.6.6.4. Market size and forecast, by Installation
          • 8.4.6.6.5. Market size and forecast, by Application
    • 8.5. LAMEA

      • 8.5.1. Key trends and opportunities

      • 8.5.2. Market size and forecast, by Type of Hardware

      • 8.5.3. Market size and forecast, by Products

      • 8.5.4. Market size and forecast, by Installation

      • 8.5.5. Market size and forecast, by Application

      • 8.5.6. Market size and forecast, by country

        • 8.5.6.1. Brazil
          • 8.5.6.1.1. Key market trends, growth factors and opportunities
          • 8.5.6.1.2. Market size and forecast, by Type of Hardware
          • 8.5.6.1.3. Market size and forecast, by Products
          • 8.5.6.1.4. Market size and forecast, by Installation
          • 8.5.6.1.5. Market size and forecast, by Application
        • 8.5.6.2. Saudi Arabia
          • 8.5.6.2.1. Key market trends, growth factors and opportunities
          • 8.5.6.2.2. Market size and forecast, by Type of Hardware
          • 8.5.6.2.3. Market size and forecast, by Products
          • 8.5.6.2.4. Market size and forecast, by Installation
          • 8.5.6.2.5. Market size and forecast, by Application
        • 8.5.6.3. UAE
          • 8.5.6.3.1. Key market trends, growth factors and opportunities
          • 8.5.6.3.2. Market size and forecast, by Type of Hardware
          • 8.5.6.3.3. Market size and forecast, by Products
          • 8.5.6.3.4. Market size and forecast, by Installation
          • 8.5.6.3.5. Market size and forecast, by Application
        • 8.5.6.4. South Africa
          • 8.5.6.4.1. Key market trends, growth factors and opportunities
          • 8.5.6.4.2. Market size and forecast, by Type of Hardware
          • 8.5.6.4.3. Market size and forecast, by Products
          • 8.5.6.4.4. Market size and forecast, by Installation
          • 8.5.6.4.5. Market size and forecast, by Application
        • 8.5.6.5. Rest of LAMEA
          • 8.5.6.5.1. Key market trends, growth factors and opportunities
          • 8.5.6.5.2. Market size and forecast, by Type of Hardware
          • 8.5.6.5.3. Market size and forecast, by Products
          • 8.5.6.5.4. Market size and forecast, by Installation
          • 8.5.6.5.5. Market size and forecast, by Application
  • CHAPTER 9: COMPETITIVE LANDSCAPE

    • 9.1. Introduction

    • 9.2. Top winning strategies

    • 9.3. Product Mapping of Top 10 Player

    • 9.4. Competitive Dashboard

    • 9.5. Competitive Heatmap

    • 9.6. Top player positioning, 2021

  • CHAPTER 10: COMPANY PROFILES

    • 10.1. Philips Lighting Holding B.V.

      • 10.1.1. Company overview

      • 10.1.2. Key Executives

      • 10.1.3. Company snapshot

    • 10.2. GE Lighting Co. Ltd

      • 10.2.1. Company overview

      • 10.2.2. Key Executives

      • 10.2.3. Company snapshot

    • 10.3. Hubbell Incorporated

      • 10.3.1. Company overview

      • 10.3.2. Key Executives

      • 10.3.3. Company snapshot

    • 10.4. Cree, Inc.

      • 10.4.1. Company overview

      • 10.4.2. Key Executives

      • 10.4.3. Company snapshot

    • 10.5. Eaton Corporation

      • 10.5.1. Company overview

      • 10.5.2. Key Executives

      • 10.5.3. Company snapshot

    • 10.6. Acuity Brands, Inc.

      • 10.6.1. Company overview

      • 10.6.2. Key Executives

      • 10.6.3. Company snapshot

    • 10.7. Sunna Design

      • 10.7.1. Company overview

      • 10.7.2. Key Executives

      • 10.7.3. Company snapshot

    • 10.8. Mobile Pro Systems

      • 10.8.1. Company overview

      • 10.8.2. Key Executives

      • 10.8.3. Company snapshot

    • 10.9. Goldspar Australia Pty Ltd.

      • 10.9.1. Company overview

      • 10.9.2. Key Executives

      • 10.9.3. Company snapshot

    • 10.10. Virtual Extension Ltd.

      • 10.10.1. Company overview

      • 10.10.2. Key Executives

      • 10.10.3. Company snapshot

  • LIST OF TABLES

  • TABLE 01. GLOBAL SMART POLES MARKET, BY TYPE OF HARDWARE, 2021-2031 ($MILLION)
    TABLE 02. SMART POLES MARKET FOR LIGHTING LAMP, BY REGION, 2021-2031 ($MILLION)
    TABLE 03. SMART POLES MARKET FOR POLE BRACKET AND POLE BODY, BY REGION, 2021-2031 ($MILLION)
    TABLE 04. SMART POLES MARKET FOR COMMUNICATION DEVICE, BY REGION, 2021-2031 ($MILLION)
    TABLE 05. SMART POLES MARKET FOR CONTROLLER, BY REGION, 2021-2031 ($MILLION)
    TABLE 06. SMART POLES MARKET FOR OTHERS, BY REGION, 2021-2031 ($MILLION)
    TABLE 07. GLOBAL SMART POLES MARKET, BY PRODUCTS, 2021-2031 ($MILLION)
    TABLE 08. SMART POLES MARKET FOR HARDWARE, BY REGION, 2021-2031 ($MILLION)
    TABLE 09. SMART POLES MARKET FOR SOFTWARE, BY REGION, 2021-2031 ($MILLION)
    TABLE 10. SMART POLES MARKET FOR SERVICES, BY REGION, 2021-2031 ($MILLION)
    TABLE 11. GLOBAL SMART POLES MARKET, BY INSTALLATION, 2021-2031 ($MILLION)
    TABLE 12. SMART POLES MARKET FOR NEW INSTALLATION, BY REGION, 2021-2031 ($MILLION)
    TABLE 13. SMART POLES MARKET FOR RETROFIT, BY REGION, 2021-2031 ($MILLION)
    TABLE 14. GLOBAL SMART POLES MARKET, BY APPLICATION, 2021-2031 ($MILLION)
    TABLE 15. SMART POLES MARKET FOR HIGHWAYS AND ROADWAYS, BY REGION, 2021-2031 ($MILLION)
    TABLE 16. SMART POLES MARKET FOR PUBLIC PLACES, BY REGION, 2021-2031 ($MILLION)
    TABLE 17. SMART POLES MARKET FOR RAILWAYS AND HARBORS, BY REGION, 2021-2031 ($MILLION)
    TABLE 18. SMART POLES MARKET, BY REGION, 2021-2031 ($MILLION)
    TABLE 19. NORTH AMERICA SMART POLES MARKET, BY TYPE OF HARDWARE, 2021-2031 ($MILLION)
    TABLE 20. NORTH AMERICA SMART POLES MARKET, BY PRODUCTS, 2021-2031 ($MILLION)
    TABLE 21. NORTH AMERICA SMART POLES MARKET, BY INSTALLATION, 2021-2031 ($MILLION)
    TABLE 22. NORTH AMERICA SMART POLES MARKET, BY APPLICATION, 2021-2031 ($MILLION)
    TABLE 23. NORTH AMERICA SMART POLES MARKET, BY COUNTRY, 2021-2031 ($MILLION)
    TABLE 24. U.S. SMART POLES MARKET, BY TYPE OF HARDWARE, 2021-2031 ($MILLION)
    TABLE 25. U.S. SMART POLES MARKET, BY PRODUCTS, 2021-2031 ($MILLION)
    TABLE 26. U.S. SMART POLES MARKET, BY INSTALLATION, 2021-2031 ($MILLION)
    TABLE 27. U.S. SMART POLES MARKET, BY APPLICATION, 2021-2031 ($MILLION)
    TABLE 28. CANADA SMART POLES MARKET, BY TYPE OF HARDWARE, 2021-2031 ($MILLION)
    TABLE 29. CANADA SMART POLES MARKET, BY PRODUCTS, 2021-2031 ($MILLION)
    TABLE 30. CANADA SMART POLES MARKET, BY INSTALLATION, 2021-2031 ($MILLION)
    TABLE 31. CANADA SMART POLES MARKET, BY APPLICATION, 2021-2031 ($MILLION)
    TABLE 32. MEXICO SMART POLES MARKET, BY TYPE OF HARDWARE, 2021-2031 ($MILLION)
    TABLE 33. MEXICO SMART POLES MARKET, BY PRODUCTS, 2021-2031 ($MILLION)
    TABLE 34. MEXICO SMART POLES MARKET, BY INSTALLATION, 2021-2031 ($MILLION)
    TABLE 35. MEXICO SMART POLES MARKET, BY APPLICATION, 2021-2031 ($MILLION)
    TABLE 36. EUROPE SMART POLES MARKET, BY TYPE OF HARDWARE, 2021-2031 ($MILLION)
    TABLE 37. EUROPE SMART POLES MARKET, BY PRODUCTS, 2021-2031 ($MILLION)
    TABLE 38. EUROPE SMART POLES MARKET, BY INSTALLATION, 2021-2031 ($MILLION)
    TABLE 39. EUROPE SMART POLES MARKET, BY APPLICATION, 2021-2031 ($MILLION)
    TABLE 40. EUROPE SMART POLES MARKET, BY COUNTRY, 2021-2031 ($MILLION)
    TABLE 41. UK SMART POLES MARKET, BY TYPE OF HARDWARE, 2021-2031 ($MILLION)
    TABLE 42. UK SMART POLES MARKET, BY PRODUCTS, 2021-2031 ($MILLION)
    TABLE 43. UK SMART POLES MARKET, BY INSTALLATION, 2021-2031 ($MILLION)
    TABLE 44. UK SMART POLES MARKET, BY APPLICATION, 2021-2031 ($MILLION)
    TABLE 45. GERMANY SMART POLES MARKET, BY TYPE OF HARDWARE, 2021-2031 ($MILLION)
    TABLE 46. GERMANY SMART POLES MARKET, BY PRODUCTS, 2021-2031 ($MILLION)
    TABLE 47. GERMANY SMART POLES MARKET, BY INSTALLATION, 2021-2031 ($MILLION)
    TABLE 48. GERMANY SMART POLES MARKET, BY APPLICATION, 2021-2031 ($MILLION)
    TABLE 49. FRANCE SMART POLES MARKET, BY TYPE OF HARDWARE, 2021-2031 ($MILLION)
    TABLE 50. FRANCE SMART POLES MARKET, BY PRODUCTS, 2021-2031 ($MILLION)
    TABLE 51. FRANCE SMART POLES MARKET, BY INSTALLATION, 2021-2031 ($MILLION)
    TABLE 52. FRANCE SMART POLES MARKET, BY APPLICATION, 2021-2031 ($MILLION)
    TABLE 53. SPAIN SMART POLES MARKET, BY TYPE OF HARDWARE, 2021-2031 ($MILLION)
    TABLE 54. SPAIN SMART POLES MARKET, BY PRODUCTS, 2021-2031 ($MILLION)
    TABLE 55. SPAIN SMART POLES MARKET, BY INSTALLATION, 2021-2031 ($MILLION)
    TABLE 56. SPAIN SMART POLES MARKET, BY APPLICATION, 2021-2031 ($MILLION)
    TABLE 57. ITALY SMART POLES MARKET, BY TYPE OF HARDWARE, 2021-2031 ($MILLION)
    TABLE 58. ITALY SMART POLES MARKET, BY PRODUCTS, 2021-2031 ($MILLION)
    TABLE 59. ITALY SMART POLES MARKET, BY INSTALLATION, 2021-2031 ($MILLION)
    TABLE 60. ITALY SMART POLES MARKET, BY APPLICATION, 2021-2031 ($MILLION)
    TABLE 61. REST OF EUROPE SMART POLES MARKET, BY TYPE OF HARDWARE, 2021-2031 ($MILLION)
    TABLE 62. REST OF EUROPE SMART POLES MARKET, BY PRODUCTS, 2021-2031 ($MILLION)
    TABLE 63. REST OF EUROPE SMART POLES MARKET, BY INSTALLATION, 2021-2031 ($MILLION)
    TABLE 64. REST OF EUROPE SMART POLES MARKET, BY APPLICATION, 2021-2031 ($MILLION)
    TABLE 65. ASIA-PACIFIC SMART POLES MARKET, BY TYPE OF HARDWARE, 2021-2031 ($MILLION)
    TABLE 66. ASIA-PACIFIC SMART POLES MARKET, BY PRODUCTS, 2021-2031 ($MILLION)
    TABLE 67. ASIA-PACIFIC SMART POLES MARKET, BY INSTALLATION, 2021-2031 ($MILLION)
    TABLE 68. ASIA-PACIFIC SMART POLES MARKET, BY APPLICATION, 2021-2031 ($MILLION)
    TABLE 69. ASIA-PACIFIC SMART POLES MARKET, BY COUNTRY, 2021-2031 ($MILLION)
    TABLE 70. CHINA SMART POLES MARKET, BY TYPE OF HARDWARE, 2021-2031 ($MILLION)
    TABLE 71. CHINA SMART POLES MARKET, BY PRODUCTS, 2021-2031 ($MILLION)
    TABLE 72. CHINA SMART POLES MARKET, BY INSTALLATION, 2021-2031 ($MILLION)
    TABLE 73. CHINA SMART POLES MARKET, BY APPLICATION, 2021-2031 ($MILLION)
    TABLE 74. INDIA SMART POLES MARKET, BY TYPE OF HARDWARE, 2021-2031 ($MILLION)
    TABLE 75. INDIA SMART POLES MARKET, BY PRODUCTS, 2021-2031 ($MILLION)
    TABLE 76. INDIA SMART POLES MARKET, BY INSTALLATION, 2021-2031 ($MILLION)
    TABLE 77. INDIA SMART POLES MARKET, BY APPLICATION, 2021-2031 ($MILLION)
    TABLE 78. JAPAN SMART POLES MARKET, BY TYPE OF HARDWARE, 2021-2031 ($MILLION)
    TABLE 79. JAPAN SMART POLES MARKET, BY PRODUCTS, 2021-2031 ($MILLION)
    TABLE 80. JAPAN SMART POLES MARKET, BY INSTALLATION, 2021-2031 ($MILLION)
    TABLE 81. JAPAN SMART POLES MARKET, BY APPLICATION, 2021-2031 ($MILLION)
    TABLE 82. SOUTH KOREA SMART POLES MARKET, BY TYPE OF HARDWARE, 2021-2031 ($MILLION)
    TABLE 83. SOUTH KOREA SMART POLES MARKET, BY PRODUCTS, 2021-2031 ($MILLION)
    TABLE 84. SOUTH KOREA SMART POLES MARKET, BY INSTALLATION, 2021-2031 ($MILLION)
    TABLE 85. SOUTH KOREA SMART POLES MARKET, BY APPLICATION, 2021-2031 ($MILLION)
    TABLE 86. AUSTRALIA SMART POLES MARKET, BY TYPE OF HARDWARE, 2021-2031 ($MILLION)
    TABLE 87. AUSTRALIA SMART POLES MARKET, BY PRODUCTS, 2021-2031 ($MILLION)
    TABLE 88. AUSTRALIA SMART POLES MARKET, BY INSTALLATION, 2021-2031 ($MILLION)
    TABLE 89. AUSTRALIA SMART POLES MARKET, BY APPLICATION, 2021-2031 ($MILLION)
    TABLE 90. REST OF ASIA-PACIFIC SMART POLES MARKET, BY TYPE OF HARDWARE, 2021-2031 ($MILLION)
    TABLE 91. REST OF ASIA-PACIFIC SMART POLES MARKET, BY PRODUCTS, 2021-2031 ($MILLION)
    TABLE 92. REST OF ASIA-PACIFIC SMART POLES MARKET, BY INSTALLATION, 2021-2031 ($MILLION)
    TABLE 93. REST OF ASIA-PACIFIC SMART POLES MARKET, BY APPLICATION, 2021-2031 ($MILLION)
    TABLE 94. LAMEA SMART POLES MARKET, BY TYPE OF HARDWARE, 2021-2031 ($MILLION)
    TABLE 95. LAMEA SMART POLES MARKET, BY PRODUCTS, 2021-2031 ($MILLION)
    TABLE 96. LAMEA SMART POLES MARKET, BY INSTALLATION, 2021-2031 ($MILLION)
    TABLE 97. LAMEA SMART POLES MARKET, BY APPLICATION, 2021-2031 ($MILLION)
    TABLE 98. LAMEA SMART POLES MARKET, BY COUNTRY, 2021-2031 ($MILLION)
    TABLE 99. BRAZIL SMART POLES MARKET, BY TYPE OF HARDWARE, 2021-2031 ($MILLION)
    TABLE 100. BRAZIL SMART POLES MARKET, BY PRODUCTS, 2021-2031 ($MILLION)
    TABLE 101. BRAZIL SMART POLES MARKET, BY INSTALLATION, 2021-2031 ($MILLION)
    TABLE 102. BRAZIL SMART POLES MARKET, BY APPLICATION, 2021-2031 ($MILLION)
    TABLE 103. SAUDI ARABIA SMART POLES MARKET, BY TYPE OF HARDWARE, 2021-2031 ($MILLION)
    TABLE 104. SAUDI ARABIA SMART POLES MARKET, BY PRODUCTS, 2021-2031 ($MILLION)
    TABLE 105. SAUDI ARABIA SMART POLES MARKET, BY INSTALLATION, 2021-2031 ($MILLION)
    TABLE 106. SAUDI ARABIA SMART POLES MARKET, BY APPLICATION, 2021-2031 ($MILLION)
    TABLE 107. UAE SMART POLES MARKET, BY TYPE OF HARDWARE, 2021-2031 ($MILLION)
    TABLE 108. UAE SMART POLES MARKET, BY PRODUCTS, 2021-2031 ($MILLION)
    TABLE 109. UAE SMART POLES MARKET, BY INSTALLATION, 2021-2031 ($MILLION)
    TABLE 110. UAE SMART POLES MARKET, BY APPLICATION, 2021-2031 ($MILLION)
    TABLE 111. SOUTH AFRICA SMART POLES MARKET, BY TYPE OF HARDWARE, 2021-2031 ($MILLION)
    TABLE 112. SOUTH AFRICA SMART POLES MARKET, BY PRODUCTS, 2021-2031 ($MILLION)
    TABLE 113. SOUTH AFRICA SMART POLES MARKET, BY INSTALLATION, 2021-2031 ($MILLION)
    TABLE 114. SOUTH AFRICA SMART POLES MARKET, BY APPLICATION, 2021-2031 ($MILLION)
    TABLE 115. REST OF LAMEA SMART POLES MARKET, BY TYPE OF HARDWARE, 2021-2031 ($MILLION)
    TABLE 116. REST OF LAMEA SMART POLES MARKET, BY PRODUCTS, 2021-2031 ($MILLION)
    TABLE 117. REST OF LAMEA SMART POLES MARKET, BY INSTALLATION, 2021-2031 ($MILLION)
    TABLE 118. REST OF LAMEA SMART POLES MARKET, BY APPLICATION, 2021-2031 ($MILLION)
    TABLE 119. PHILIPS LIGHTING HOLDING B.V.: KEY EXECUTIVES
    TABLE 120. PHILIPS LIGHTING HOLDING B.V.: COMPANY SNAPSHOT
    TABLE 121. GE LIGHTING CO. LTD: KEY EXECUTIVES
    TABLE 122. GE LIGHTING CO. LTD: COMPANY SNAPSHOT
    TABLE 123. HUBBELL INCORPORATED: KEY EXECUTIVES
    TABLE 124. HUBBELL INCORPORATED: COMPANY SNAPSHOT
    TABLE 125. CREE, INC.: KEY EXECUTIVES
    TABLE 126. CREE, INC.: COMPANY SNAPSHOT
    TABLE 127. EATON CORPORATION: KEY EXECUTIVES
    TABLE 128. EATON CORPORATION: COMPANY SNAPSHOT
    TABLE 129. ACUITY BRANDS, INC.: KEY EXECUTIVES
    TABLE 130. ACUITY BRANDS, INC.: COMPANY SNAPSHOT
    TABLE 131. SUNNA DESIGN: KEY EXECUTIVES
    TABLE 132. SUNNA DESIGN: COMPANY SNAPSHOT
    TABLE 133. MOBILE PRO SYSTEMS: KEY EXECUTIVES
    TABLE 134. MOBILE PRO SYSTEMS: COMPANY SNAPSHOT
    TABLE 135. GOLDSPAR AUSTRALIA PTY LTD.: KEY EXECUTIVES
    TABLE 136. GOLDSPAR AUSTRALIA PTY LTD.: COMPANY SNAPSHOT
    TABLE 137. VIRTUAL EXTENSION LTD.: KEY EXECUTIVES
    TABLE 138. VIRTUAL EXTENSION LTD.: COMPANY SNAPSHOT
  • LIST OF FIGURES

  • FIGURE 01. SMART POLES MARKET, 2021-2031
    FIGURE 02. SEGMENTATION OF SMART POLES MARKET, 2021-2031
    FIGURE 03. TOP INVESTMENT POCKETS IN SMART POLES MARKET (2022-2031)
    FIGURE 04. PORTER FIVE-1
    FIGURE 05. PORTER FIVE-2
    FIGURE 06. PORTER FIVE-3
    FIGURE 07. PORTER FIVE-4
    FIGURE 08. PORTER FIVE-5
    FIGURE 09. DRIVERS, RESTRAINTS AND OPPORTUNITIES: GLOBALSMART POLES MARKET
    FIGURE 10. IMPACT OF KEY REGULATION: SMART POLES MARKET
    FIGURE 11. MARKET SHARE ANALYSIS: SMART POLES MARKET
    FIGURE 12. PATENT ANALYSIS BY COMPANY
    FIGURE 13. PATENT ANALYSIS BY COUNTRY
    FIGURE 14. REGULATORY GUIDELINES: SMART POLES MARKET
    FIGURE 15. VALUE CHAIN ANALYSIS: SMART POLES MARKET
    FIGURE 16. SMART POLES MARKET, BY TYPE OF HARDWARE, 2021(%)
    FIGURE 17. COMPARATIVE SHARE ANALYSIS OF SMART POLES MARKET FOR LIGHTING LAMP, BY COUNTRY 2021-2031(%)
    FIGURE 18. COMPARATIVE SHARE ANALYSIS OF SMART POLES MARKET FOR POLE BRACKET AND POLE BODY, BY COUNTRY 2021-2031(%)
    FIGURE 19. COMPARATIVE SHARE ANALYSIS OF SMART POLES MARKET FOR COMMUNICATION DEVICE, BY COUNTRY 2021-2031(%)
    FIGURE 20. COMPARATIVE SHARE ANALYSIS OF SMART POLES MARKET FOR CONTROLLER, BY COUNTRY 2021-2031(%)
    FIGURE 21. COMPARATIVE SHARE ANALYSIS OF SMART POLES MARKET FOR OTHERS, BY COUNTRY 2021-2031(%)
    FIGURE 22. SMART POLES MARKET, BY PRODUCTS, 2021(%)
    FIGURE 23. COMPARATIVE SHARE ANALYSIS OF SMART POLES MARKET FOR HARDWARE, BY COUNTRY 2021-2031(%)
    FIGURE 24. COMPARATIVE SHARE ANALYSIS OF SMART POLES MARKET FOR SOFTWARE, BY COUNTRY 2021-2031(%)
    FIGURE 25. COMPARATIVE SHARE ANALYSIS OF SMART POLES MARKET FOR SERVICES, BY COUNTRY 2021-2031(%)
    FIGURE 26. SMART POLES MARKET, BY INSTALLATION, 2021(%)
    FIGURE 27. COMPARATIVE SHARE ANALYSIS OF SMART POLES MARKET FOR NEW INSTALLATION, BY COUNTRY 2021-2031(%)
    FIGURE 28. COMPARATIVE SHARE ANALYSIS OF SMART POLES MARKET FOR RETROFIT, BY COUNTRY 2021-2031(%)
    FIGURE 29. SMART POLES MARKET, BY APPLICATION, 2021(%)
    FIGURE 30. COMPARATIVE SHARE ANALYSIS OF SMART POLES MARKET FOR HIGHWAYS AND ROADWAYS, BY COUNTRY 2021-2031(%)
    FIGURE 31. COMPARATIVE SHARE ANALYSIS OF SMART POLES MARKET FOR PUBLIC PLACES, BY COUNTRY 2021-2031(%)
    FIGURE 32. COMPARATIVE SHARE ANALYSIS OF SMART POLES MARKET FOR RAILWAYS AND HARBORS, BY COUNTRY 2021-2031(%)
    FIGURE 33. SMART POLES MARKET BY REGION, 2021
    FIGURE 34. U.S. SMART POLES MARKET, 2021-2031 ($MILLION)
    FIGURE 35. CANADA SMART POLES MARKET, 2021-2031 ($MILLION)
    FIGURE 36. MEXICO SMART POLES MARKET, 2021-2031 ($MILLION)
    FIGURE 37. UK SMART POLES MARKET, 2021-2031 ($MILLION)
    FIGURE 38. GERMANY SMART POLES MARKET, 2021-2031 ($MILLION)
    FIGURE 39. FRANCE SMART POLES MARKET, 2021-2031 ($MILLION)
    FIGURE 40. SPAIN SMART POLES MARKET, 2021-2031 ($MILLION)
    FIGURE 41. ITALY SMART POLES MARKET, 2021-2031 ($MILLION)
    FIGURE 42. REST OF EUROPE SMART POLES MARKET, 2021-2031 ($MILLION)
    FIGURE 43. CHINA SMART POLES MARKET, 2021-2031 ($MILLION)
    FIGURE 44. INDIA SMART POLES MARKET, 2021-2031 ($MILLION)
    FIGURE 45. JAPAN SMART POLES MARKET, 2021-2031 ($MILLION)
    FIGURE 46. SOUTH KOREA SMART POLES MARKET, 2021-2031 ($MILLION)
    FIGURE 47. AUSTRALIA SMART POLES MARKET, 2021-2031 ($MILLION)
    FIGURE 48. REST OF ASIA-PACIFIC SMART POLES MARKET, 2021-2031 ($MILLION)
    FIGURE 49. BRAZIL SMART POLES MARKET, 2021-2031 ($MILLION)
    FIGURE 50. SAUDI ARABIA SMART POLES MARKET, 2021-2031 ($MILLION)
    FIGURE 51. UAE SMART POLES MARKET, 2021-2031 ($MILLION)
    FIGURE 52. SOUTH AFRICA SMART POLES MARKET, 2021-2031 ($MILLION)
    FIGURE 53. REST OF LAMEA SMART POLES MARKET, 2021-2031 ($MILLION)
    FIGURE 54. TOP WINNING STRATEGIES, BY YEAR
    FIGURE 55. TOP WINNING STRATEGIES, BY DEVELOPMENT
    FIGURE 56. TOP WINNING STRATEGIES, BY COMPANY
    FIGURE 57. PRODUCT MAPPING OF TOP 10 PLAYERS
    FIGURE 58. COMPETITIVE DASHBOARD
    FIGURE 59. COMPETITIVE HEATMAP: SMART POLES MARKET
    FIGURE 60. TOP PLAYER POSITIONING, 2021


The incorporation of Internet of Things (IoT) technology has enabled smart poles to perform multiple functions such as traffic management, public safety and security, and environmental monitoring. An increase in demand for 5G technology is the key factor that is projected to drive the growth of the global smart poles market during the forecast period. The integration of 5G technology into smart poles has also increased the demand for smart poles, as cities look for ways to improve their wireless network coverage and capacity. The use of smart poles as charging stations for electric vehicles has also emerged as a significant application in recent years, driving the growth of the smart poles market. However, the high cost of technical integration is one of the impediments to the market expansion. Smart pole installation is substantially more costly than traditional street lighting installation. Therefore, underdeveloped countries continue to fall behind in adopting modern technology such as smart poles. In addition, the integration of smart poles with emergency response systems, such as fire alarms, helps to reduce response time in case of an emergency. The poles can also be equipped with real-time crime monitoring systems, which provide authorities with immediate information about potential security threats and enable them to take action promptly. These factors are anticipated to create significant growth opportunities for the key players operating in the smart pole market during the forecast period.  

Among the analyzed regions, LAMEA accounted for the highest revenue in the market in 2021, followed by North America, Europe, and Asia-Pacific. Rapid industrialization and urbanization are the key factors responsible for the leading position of LAMEA and North America in the global smart poles market.

PURCHASE OPTIONS

Call or Email us

U.S.-Canada Toll-free: +1-800-792-5285
Int'l : +1-503-894-6022
Europe : +44-845-528-1300
Email : help@alliedmarketresearch.com
 
FREQUENTLY ASKED QUESTIONS?

A. The expanding infrastructure for smart city projects, combined with the integration of Internet of Things (IoT) and Artificial Intelligence technologies is driving the smart poles market which is anticipated to generate excellent opportunities for the key market players

A. The major growth strategies adopted by smart poles market players are investment and agreement.

A. North America will provide more business opportunities for the global smart poles market in the future.

A. Philips Lighting Holding B.V., GE Lighting Co. Ltd, Hubbell Incorporated, Cree, Inc., Eaton Corporation, Acuity Brands, Sunna Design, Mobile Pro Systems, Goldspar Australia Pty Ltd., and Virtual Extension Ltd. are the major players in the smart poles market.

A. The highways and roadways sub-segment of the application acquired the maximum share of the global smart poles market in 2021.

A. Roadway ministries and the construction industry are the major customers in the global smart poles market.

A. The report provides an extensive qualitative and quantitative analysis of the current trends and future estimations of the global smart poles market from 2022 to 2031 to determine the prevailing opportunities.

A. Smart poles are gaining popularity in cities to minimize traffic congestion and prevent accidents, as they provide traffic management with the following attributes: traffic monitoring, traffic guidance, car monitoring, and parking guidance. This is the major factor expected to drive the adoption of smart poles.

Looking for Customization?

 Customization Request

Have a Question?

 Speak with Analyst

Any Confusion?

 Inquire Before Buying

Have a glance of the Report

  Request Sample
RELATED TAGS

Purchase Full Report of
Smart Poles Market

Start reading instantly.
This Report and over 67,070+ more Reports, Available with Avenue Library. T&C*.

  • Online Only
  • $3,570
  • Online cloud access only
  • Restricted print, copy, paste & download
  • Read only
  • Free industry update
    (Within 180 days)
  • Free report update in next update cycle
    (Mar 2024 - Mar 2025)
  • Data Pack
  • $3,840
  • Restricted to one authorized user
  • One print only
  • Available in
    Excel
  • Free industry update
    (Within 180 days)
  •   Free report update in next update cycle
    (Mar 2024 - Mar 2025)
  • Single User
  • $5,730
  • Restricted to one authorized user
  • One print only
  • Available in
    PDF
  • Free industry update
    (Within 180 days)
  •   Free report update in next update cycle
    (Mar 2024 - Mar 2025)
  • Five Users
  • $6,450
  • Limited to five authorized users
  • Print upto five copies
  • Available in
    PDF
  • Free industry update
    (Within 180 days)
  •   Free report update in next update cycle
    (Mar 2024 - Mar 2025)
  • Enterprise
    License/PDF

  • $9,600
  • Unlimited
    within
    company/enterprise
  • Available in Excel & PDF
  • Free industry update
    (Within 180 days)
  •   Free report update in next update cycle
    (Mar 2024 - Mar 2025)
  • Library
    Membership

  • $999 $ 1,175
    Per User/ Per month/ Billed annually
  • Published Content
    E-access
  • Company Profiles
    E-access
  • Newly Added Content Access
  • 10 PDF
    Downloads
  • 5 Excel Data
    Pack Downloads
  • 250 Company Profiles PDF Downloads
  • Buy Now

*Taxes/Fees, if applicable will be added during checkout. All prices in USD

RELATED REPORTS
 

Why Allied Market Research?


Infallible Methodology

To ensure high-level data integrity, accurate analysis, and impeccable forecasts

Analyst Support

For complete satisfaction

Customization

On-demand customization of scope of the report to exactly meet your needs

TARGETED MARKET VIEW

Targeted market view to provide pertinent information and save time of readers

Get fresh content delivered

Get insights on topics that are crucial for your business. Stay abreast of your interest areas.

Get Industry Data Alerts

Why Allied Market Research?

Infallible Methodology

To ensure high-level data integrity, accurate analysis, and impeccable forecasts

Analyst Support

For complete satisfaction

Customization

On-demand customization of scope of the report to exactly meet your needs

TARGETED MARKET VIEW

Targeted market view to provide pertinent information and save time of readers