
Steam Turbine MRO Market Overview
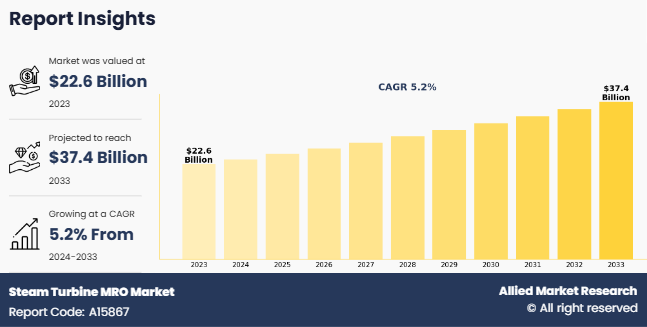
The global steam turbine mro market was valued at USD 22.6 billion in 2023, and is projected to reach USD 37.4 billion by 2033, growing at a CAGR of 5.2% from 2024 to 2033. Rising electricity demand and the need to optimize existing power generation infrastructure are driving growth in the steam turbine MRO market. Advancements in digitalization, predictive maintenance, and data analytics enhance efficiency and reduce operational costs, boosting market adoption.
Key Market Insights
- Maintenance dominates, while repair grows with 3D printing, laser cladding, and advanced welding.
- OEMs lead services, but in-house MRO adoption is steadily increasing.
- Coal-based turbines hold largest share, while nuclear power records fastest growth.
- 300–599 MW turbines drive retrofitting, while 600 MW+ capacity shows highest growth.
- Power generation dominates demand, while oil & gas emerges as fastest-growing sector.
- Asia-Pacific leads revenue share and records the highest CAGR.
Market Size & Forecast
- 2033 Projected Market Size: USD 37.4 billion
- 2023 Market Size: USD 22.6 billion
- Compound Annual Growth Rate (CAGR) (2024-2033): 5.2%
Introduction
Steam Turbine Maintenance, Repair, and Overhaul (MRO) refers to the services aimed at ensuring the efficiency, reliability, and longevity of steam turbines used in power generation, oil & gas, and industrial applications. MRO includes routine inspections, component replacements, rotor balancing, blade refurbishment, and condition-based monitoring to prevent unexpected failures. Advanced diagnostics, predictive maintenance, and digital solutions, such as IoT-based sensors, are increasingly used to enhance turbine performance. As aging infrastructure and efficiency demands rise, MRO services play a critical role in minimizing downtime, reducing operational costs, and extending the lifecycle of steam turbines.
Key Takeaways
Quantitative information mentioned in the global steam turbine MRO market includes the market numbers in terms of value ($Million) concerning different segments, annual growth rate, CAGR (2024-33), and growth analysis.
The analysis in the report is provided based on service type, service provider, fuel type, capacity, end-use industry. The study is expected to contain qualitative information such as the market dynamics (drivers, restraints, opportunities), Porter’s Five Force Analysis, key regulations across the region, and value chain analysis.
A few companies, Hyundai Heavy Industries Co., Ltd, Siemens AG, Kessels, Shanghai Electric, Ansaldo Energia, Stork, Sulzer Ltd, General Electric Company, Mitsubishi Power, and Elliott Group IE hold a large proportion of the global steam turbine mro Market.
This report makes it easier for existing market players and new entrants to the industrial gases industry to plan their strategies and understand the dynamics of the industry, which helps them make better decisions.
Market Dynamics
Rising investments in infrastructure and heavy industries are fueling the growth of the steam turbine MRO market. Expanding power plants, oil refineries, and manufacturing facilities require reliable turbine operations, increasing the need for regular maintenance and repairs. As governments and private sectors invest in energy and industrial projects, demand for MRO services is expected to grow to ensure efficiency and prevent costly downtime. Aging turbine fleets in existing infrastructure also require upgrades and overhauls. In addition, advancements in digital monitoring and predictive maintenance further drive MRO adoption, enabling industries to optimize turbine performance while reducing operational costs and extending equipment lifespan. All these factors drive the growth of the steam turbine MRO market.
However, environmental concerns and sustainability challenges significantly impact the growth of the steam turbine MRO market. As industries increasingly prioritize eco-friendly practices, the disposal of waste materials, such as lubricants, parts, and chemicals, poses environmental risks. Moreover, the demand for more energy-efficient turbines leads to a shift towards newer technologies, making it harder for older turbines to meet sustainability standards. Companies are under pressure to adopt greener MRO practices, but the associated costs and regulatory hurdles often slow market growth. These factors require the industry to balance efficiency, cost, and environmental responsibility in its operations. All these factors hamper the steam turbine MRO market growth.
The shift toward condition-based monitoring systems presents a lucrative opportunity for the steam turbine MRO market. These systems use real-time data, including vibration, temperature, and pressure readings, to monitor the condition of turbines and predict potential failures. By detecting issues early, operators can perform maintenance only when necessary, thus reducing downtime and improving operational efficiency. This proactive approach enhances turbine performance, extends equipment lifespan, and lowers maintenance costs. As industries increasingly focus on energy efficiency and cost-saving strategies, the adoption of condition-based monitoring systems is expected to drive growth in the steam turbine MRO market.
Segment Overview
The steam turbine MRO market is segmented into service type, service provider, fuel type, capacity, end-use industry, and region. On the basis of service type, the market is divided into maintenance, repair, and overhaul. On the basis of service provider, the market is classified into original equipment manufacturers, independent service providers, and in-house. On the basis of fuel type, the market is segregated into coal, natural gas, and nuclear. By capacity, the market is divided into less than 300 MW, 300 MW to 599 MW, and 600 MW and above. On the basis of end-use industry, the market is classified into power generation, oil and gas, others. Region-wise, the market is analyzed across North America, Europe, Asia-Pacific, and LAMEA.

Based on service type, the maintenance segment held the highest market share in 2023, accounting for nearly half of the global Steam Turbine MRO Market Size, and is estimated to maintain its leadership status throughout the forecast period. However, the repair segment is projected to manifest a CAGR of 5.6% from 2024 to 2033, owing to the increase in the adoption of advanced repair techniques and technologies. This includes the use of laser cladding, 3D printing, and advanced welding techniques to repair damaged components and extend the lifespan of steam turbines. These technologies offer improved efficiency, reduced downtime, and enhanced performance, driving the Steam Turbine MRO Market Growth Forecast of the repair segment.

Based on service provider, the original equipment manufacturer segment held the highest market share in 2023, accounting for nearly three-fifths of the global Steam Turbine MRO Market Share, and is estimated to maintain its leadership status throughout the forecast period. However, the in-house segment is projected to manifest a CAGR of 5.7% from 2024 to 2033, owing to the increase in management and maintenance of steam turbines are handled internally, using teams, workshops, and other resources.

Based on fuel type, the coal segment held the highest market share in 2023, accounting for more than three-fifths of the global steam turbine MRO market revenue, and is estimated to maintain its leadership status throughout the forecast period. However, the nuclear segment is projected to manifest a CAGR of 5.5% from 2024 to 2033, owing to the increase in demand for nuclear power generation, which is driven by its low-carbon footprint and baseload stability.

Based on capacity, the 300 MW to 599 MW segment held the highest market share in 2023, accounting for more than half of the global steam turbine MRO market, and is estimated to maintain its leadership status throughout the forecast period. Retrofitting and upgrades are prominent trends as aging turbines in this range require improvements in efficiency and emissions compliance. Digitalization and data analytics are gaining traction, enabling proactive maintenance and optimized performance. However, the 600 MW and above segment is projected to manifest the highest CAGR of 5.6% from 2024 to 2033. The 600 MW and above capacity segment of the Steam Turbine MRO market has a notable trend focused on improving the efficiency of steam turbines in this segment, driven by the need for optimized power plant operations and reduced emissions.

Based on the end-use industry, the power generation segment accounted for the largest share in 2023, contributing to nearly half of the global steam turbine MRO market revenue, and is projected to maintain its lead position during the forecast period. The growth factors for the steam turbine MRO market in the power end-use industry include the aging infrastructure of power plants, stringent regulations on emissions & energy efficiency, and the adoption of advanced MRO technologies for condition monitoring and predictive maintenance. However, the oil & gas segment is expected to portray the largest CAGR of 5.8% from 2024 to 2033. The growth opportunities in the oil and gas segment of the steam turbine MRO market arise from the expansion and modernization of oil and gas infrastructure, particularly in emerging markets. This includes the development of new refineries, LNG (liquefied natural gas) plants, and offshore exploration and production facilities that require reliable steam turbine systems. Retrofit and upgrade projects aimed at improving the efficiency and output of existing facilities also contribute to the demand for steam turbine MRO services in this industry.

Based on region, Asia-Pacific held the highest market share in terms of revenue in 2023, accounting for nearly half of the global Steam Turbine MRO Market Forecast, and is likely to dominate the market during the forecast period. The government initiatives in Asia-Pacific towards the construction of coal-based and nuclear power plants to generate power have created a demand for steam turbines which has a positive impact on the steam turbine MRO market. Furthermore, the Asia-Pacific region is expected to witness the fastest CAGR of 5.6% from 2024 to 2033. The region is characterized by a high demand for energy, rapid urbanization, and the presence of most of the developing countries. These factors, among others, are driving the construction of steam power generation which led to the demand for the steam turbine MRO industry in the Asia-Pacific.
Which are the Top Steam Turbine MRO companies
The following are the leading companies in the market. These players have adopted various strategies to increase their market penetration and strengthen their position in the steam turbine MRO market.
- Hyundai Heavy Industries Co., Ltd
- Siemens AG
- Kessels
- Shanghai Electric
- Ansaldo Energia
- Stork
- Sulzer Ltd
- General Electric Company
- Mitsubishi Power
- Elliott Group IE
Key Benefits for Stakeholders
- This report provides a quantitative analysis of the market segments, current trends, estimations, and dynamics of the steam turbine mro market analysis from 2023 to 2033 to identify the prevailing steam turbine mro market opportunities.
- The market research is offered along with information related to key drivers, restraints, and opportunities.
- Porter's five forces analysis highlights the potency of buyers and suppliers to enable stakeholders make profit-oriented business decisions and strengthen their supplier-buyer network.
- In-depth analysis of the steam turbine mro market segmentation assists to determine the prevailing market opportunities.
- Major countries in each region are mapped according to their revenue contribution to the global market.
- Market player positioning facilitates benchmarking and provides a clear understanding of the present position of the market players.
- The report includes the analysis of the regional as well as global steam turbine mro market trends, key players, market segments, application areas, and market growth strategies.
Steam Turbine MRO Market Report Highlights
| Aspects | Details |
| Market Size By 2033 | USD 37.4 billion |
| Growth Rate | CAGR of 5.2% |
| Forecast period | 2023 - 2033 |
| Report Pages | 352 |
| By Service Type |
|
| By Service Provider |
|
| By Fuel Type |
|
| By Capacity |
|
| By End-Use Industry |
|
| By Region |
|
| Key Market Players | Sulzer Ltd, Shanghai Electric, HD Hyundai Heavy Industries Co., Ltd., Stork, Mitsubishi Power, General Electric Company, Elliott Group IE, Kessels, Siemens AG, Ansaldo Energia |
Analyst Review
According to the opinions of various CXOs of leading companies, the steam turbine MRO market is expected to witness significant growth during the forecast period. The market has experienced steady expansion, driven by increasing demand across industries such as power generation, oil & gas, and manufacturing. The rising emphasis on operational efficiency, reduced downtime, and sustainable energy practices is fueling this demand.
Advancements in digital technologies, including predictive maintenance, condition-based monitoring, and real-time performance diagnostics, are transforming the MRO landscape, thereby enhancing turbine reliability and optimizing maintenance schedules. Moreover, innovations in materials and engineering technologies, such as improved turbine coatings and corrosion resistant materials, are reshaping the market. These developments cater to the growing need for turbines that can withstand high temperatures and harsh operating environments, extending their service life and reducing maintenance costs. In addition, the demand for renewable energy, particularly wind and solar power, is creating new opportunities for MRO services to support turbine operations in these sectors. The integration of AI, machine learning, and digital twin technologies is further driving efficiency in turbine diagnostics and repairs. As industries prioritize energy efficiency, sustainability, and cost savings, the steam turbine MRO market is expected to experience accelerated growth. The continued adoption of advanced technologies and sustainable practices is expected to foster innovation, thus positioning the market for long-term success and expansion across various sectors.
$37.4 Billion is the estimated industry size of Steam Turbine MRO in 2033.
Rise in demand in emerging market, surge in the demand for retrofit and upgrade services are the upcoming trends of Steam Turbine MRO Market in the globe.
Power generation is the leading end-use industry of Steam Turbine MRO Market in 2023.
Asia-Pacific is the largest regional market for Steam Turbine MRO in 2023.
Hyundai Heavy Industries Co., Ltd, Siemens AG, Kessels, Shanghai Electric, Ansaldo Energia, Stork, Sulzer Ltd, General Electric Company, Mitsubishi Power, and Elliott Group IE are the top companies to hold the market share in Steam Turbine MRO.
Loading Table Of Content...
Loading Research Methodology...

