Report Code: A16315 | May 2022 | Pages: 152 | ||
Tables: 47 | Charts: 54 |
|
Pandemic disrupted the entire world and affected many industries.
Get detailed COVID-19 impact analysis on the U.s. Consumer Product Safety Testing Market
Request Now !
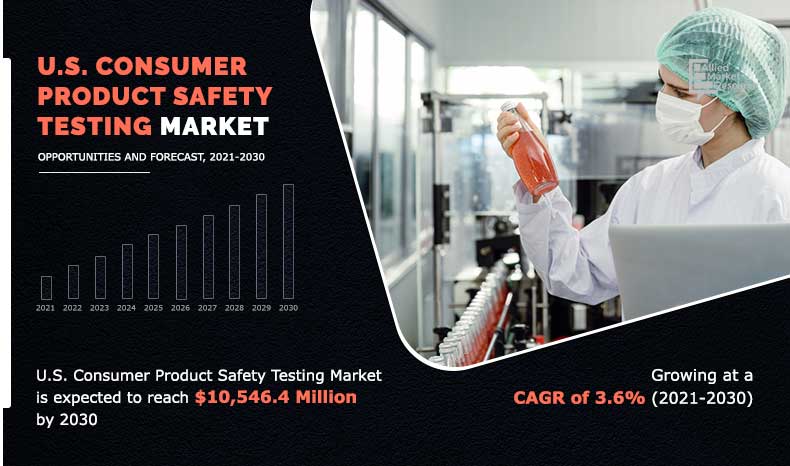
The U.S. consumer product safety testing market size was valued at $7,453.5 million in 2020, and is projected to reach $10,546.4 million by 2030, registering a CAGR of 3.6%.Â
The U.S. consumer product safety testing market is significantly affected by the emergence of COVID-19, owing to lack of availability of skilled professional to operate the technology.
Consumer product safety testing services include auditing, inspection, testing, verification, quality assurance and certification of the product, equipment and more. These help in increasing efficiency of production to reduce error by minimizing risk. Consumer product safety testing services are applicable in automotive, consumer electronics, healthcare, food & beverages, semiconductors, and other industry.Â
Increasing focus of manufacturing companies to improve customer retention by offering quality products and surging demand for interoperability testing for connected devices and IoT drive the growth of the consumer product safety testing market. However, high cost of such services due to diverse standards and regulations across different regions is expected to pose major threats for the market. Furthermore, digital transformation of customer services and rapid adoption of breakthrough technologies are expected to offer market opportunities to grow at a significant pace.
Increase in competition and low awareness among small scale manufactures is a factor restricting the growth of the market. Rise in awareness for need for product safety testing and surge in need of safety are the factors that are opportunistic for the market growth.
According to the current U.S. consumer product safety testing market trends, the most widely used testing services are consumer product safety commission (CPSC) third party testing and consumer product safety improvement act (CPSIA) compliance testing. The demand for these testing services is expected to grow steadily in the forecasted period.  Â
COVID-19 has caused the overall semiconductor industry to mobilize quickly and to make short-term decisions with long-term implications. Semiconductor companies operate in a complex ecosystem, working across the value chain with numerous raw materials, assembly, test, package, and equipment suppliers & partners, globally. The ongoing COVID-19 pandemic has abruptly re-shaped the global economy. Sudden decline in infrastructure development and installation projects is expected to hamper the cables market for commercial, government, industrial, residential, and more verticals.
The U.S. consumer product safety testing market is segmented on the basis of offering, sourcing type and industry vertical. On the basis of offering, the market is divided into electromagnetic compatibility, electrical safety, connectivity, electronics testing, energy efficiency testing and others. The electronics testing segment dominated the market, in terms of revenue, in 2020, and is expected to follow the same trend during the forecast period.Â
By sourcing type, the market is bifurcated into in-house, and outsource. The in-house segment was the highest revenue contributor in 2020, and is anticipated to garner significant market share during the forecast period. By industry vertical, the market is analyzed across communications, semiconductors, aerospace and defense, consumer electronics, automotive healthcare, industrial, food and beverages and other. The food and beverages segment acquired the largest share in 2020, and is expected to grow at a high CAGR from 2021 to 2030.
Notable factors positively affecting the U.S. consumer product safety testing market outlook include increasing focus of manufacturing companies to improve customer retention by offering quality products and surging demand for interoperability testing for connected devices and IoT. However, high cost of product safety testing services, due to diverse standards and regulations across different regions may affect U.S. consumer product safety testing market share. Furthermore, digital transformation of customer services and rapid adoption of breakthrough technologies are expected to offer lucrative opportunities for the U.S. consumer product safety testing market growth in the coming years.
Competitive analysis and profiles of the major U.S. consumer product safety testing market players, such as ABS, ALS Limited, BSI Group, Bureau Veritas SA, DEKRA, DNV, Element Materials Technology, Intertek Group PLC, ISO and TUV are provided in this report. These key players have adopted strategies, such as product portfolio expansion, mergers & acquisitions, agreements, regional expansion, and collaboration, to enhance their market penetration.
Key Benefits for Stakeholders
U.S. Consumer Product Safety Testing Market Report Highlights
Aspects | Details |
---|---|
By Offering |
|
By Sourcing Type |
|
By Industry Vertical |
|
By Key Market Players |
|
Chapter 1:Introduction
1.1.Report description
1.2.Key benefits for stakeholders
1.3.Key market segments
1.4.Research methodology
1.4.1.Primary research
1.4.2.Secondary research
1.4.3.Analyst tools and models
Chapter 2:Executive summary
2.1.Key findings
2.1.1.Top impacting factors
2.1.2.Top investment pockets
2.2.CXO perspective
Chapter 3:MARKET OVERVIEW
3.1.Market definition and scope
3.2.Porter’s five forces analysis
3.4.Market dynamics
3.4.1.Drivers
3.4.1.1.Increase in focus of manufacturing companies to improve customer retention by offering quality products
3.4.1.2.Surge in demand for interoperability testing for connected devices and IoT
3.4.2.Restraint
3.4.2.1.High cost of testing services due to diverse standards and regulations across different regions
3.4.3.Opportunity
3.4.3.1.Digital transformation of customer services
3.5.COVID Impact
3.5.1.Impact on market size
3.5.2.End user trends, preferences, and budget impact
3.5.3.End user trends, preferences, and budget impact
3.5.4.Parent industry impact
3.5.5.Key player strategies to tackle negative impact
3.5.5.1.Limiting cuts to R&D expense
3.5.5.2.Focusing on next-generation methods and technologies
3.5.5.3.Shifting toward agile supply chain model
3.5.6.Opportunity window
Chapter 4:U.S. consumer product safety testing market, BY offering
4.1.Overview
4.2.Electromagnetic Compatibility
4.2.1.Key market trends, growth factors, and opportunities
4.2.2.Market size and forecast
4.3.Electrical safety
4.3.1.Key market trends, growth factors, and opportunities
4.3.2.Market size and forecast
4.4.Connectivity
4.4.1.Key market trends, growth factors, and opportunities
4.4.2.Market size and forecast
4.5.Electronics Testing
4.5.1.Key market trends, growth factors, and opportunities
4.5.2.Market size and forecast
4.6.Energy Efficiency Testing
4.6.1.Key market trends, growth factors, and opportunities
4.6.2.Market size and forecast
4.7.Others
4.7.1.Key market trends, growth factors, and opportunities
4.7.2.Market size and forecast
Chapter 5:U.S. Consumer Product Safety Testing Market, BY sourcing type
5.1.Overview
5.2.In-House
5.2.1.Key market trends, growth factors, and opportunities
5.2.2.Market size and forecast
5.3.Outsource
5.3.1.Key market trends, growth factors, and opportunities
5.3.2.Market size and forecast
Chapter 6:U.S. Consumer Product Safety Testing Market, BY industry vertical
6.1.Overview
6.2.Communications
6.2.1.Key market trends, growth factors, and opportunities
6.2.2.Market size and forecast
6.3.Semiconductors
6.3.1.Key market trends, growth factors, and opportunities
6.3.2.Market size and forecast
6.4.Aerospace and Defense
6.4.1.Key market trends, growth factors, and opportunities
6.4.2.Market size and forecast
6.5.Consumer electronics
6.5.1.Key market trends, growth factors, and opportunities
6.5.2.Market size and forecast
6.6.Automotive
6.6.1.Key market trends, growth factors, and opportunities
6.6.2.Market size and forecast
6.7.Healthcare
6.7.1.Key market trends, growth factors, and opportunities
6.7.2.Market size and forecast
6.8.Industrial
6.8.1.Key market trends, growth factors, and opportunities
6.8.2.Market size and forecast
6.9.Food And Beverages
6.9.1.Key market trends, growth factors, and opportunities
6.9.2.Market size and forecast
6.10.Others
6.10.1.Key market trends, growth factors, and opportunities
6.10.2.Market size and forecast
Chapter 7:COMPETITIVE LANDSCAPE
7.1.Introduction
7.1.1.Market player positioning, 2019
Chapter 8:Company profiles
8.1.ABSGROUP OF COMPANIES, INC.
8.1.1.Company overview
8.1.2.Key executives
8.1.3.Company snapshot
8.1.2.Product portfolio
8.1.3.Key strategic moves and developments
8.2.ALS LIMITED
8.2.1.Company overview
8.2.2.Key executives
8.2.3.Company snapshot
8.2.4.Operating business segments
8.2.5.Product portfolio
8.2.6.Business performance
8.2.7.Key strategic moves and developments
8.3.BSI
8.3.1.Company overview
8.3.2.Key executives
8.3.3.Company snapshot.
8.3.5.Product portfolio
8.3.6.Business performance
8.3.7.Key strategic moves and developments
8.4.BUREAU VERITAS S.A
8.4.1.Company overview
8.4.2.Key executives
8.4.3.Company snapshot
8.4.4.Operating business segments
8.4.5.Product portfolio
8.4.6.R&D expenditure
8.4.7.Business performance
8.5.DEKRA
8.5.1.Company overview
8.5.2.Key executives
8.5.3.Company snapshot
8.5.4.Product portfolio
8.5.5.Business performance
8.6.DNV
8.6.1.Company overview
8.6.2.Key executives
8.6.3.Company snapshot
8.6.4.Operating business segments
8.6.5.Product portfolio
8.6.6.Business performance
8.6.7.Key strategic moves and developments
8.7.ELEMENT MATERIALS TECHNOLOGY (ELEMENT).
8.7.1.Company overview
8.7.2.Key executives
8.7.3.Company snapshot
8.7.4.Product portfolio
8.7.5.Key strategic moves and developments
8.8.INTERTEK GROUP PLC
8.8.1.Company overview
8.8.2.Key executives
8.8.3.Company snapshot
8.8.4.Operating business segments
8.8.5.Product portfolio
8.8.6.R&D expenditure
8.8.7.Business performance
8.8.8.Key strategic moves and developments
8.9.ISO
8.9.1.Company overview
8.9.2.Key executives
8.9.3.Company snapshot
8.9.4.Product portfolio
8.9.5.Business performance
8.9.6.Key strategic moves and developments
8.10.TUV SUD AG
8.10.1.Company overview
8.10.2.Key executives
8.10.3.Company snapshot
8.10.4.Operating business segments
8.10.5.Product portfolio
8.10.6.R&D expenditure
8.10.7.Business performance
8.10.8.Key strategic moves and developments
LIST OF TABLES
TABLE 01.U.S. CONSUMER PRODUCT SAFETY TESTING MARKET SHARE, BY SERVICE TYPE, 2020–2030 ($MILLION)
TABLE 02.U.S. CONSUMER PRODUCT SAFETY TESTING MARKET SHARE, BY SOURCING TYPE, 2020-2030 ($MILLION)
TABLE 03.U.S. CONSUMER PRODUCT SAFETY TESTING MARKET SHARE, BY INDUSTRY VERTICAL, 2020-2030 ($MILLION)
TABLE 04.ABS: KEY EXECUTIVES
TABLE 05.ABS: COMPANY SNAPSHOT
TABLE 06.ABS: OPERATING SEGMENTS
TABLE 07.ABS: PRODUCT PORTFOLIO
TABLE 08.ALS LIMITED:KEY EXECUTIVES
TABLE 09.ALS LIMITED: COMPANY SNAPSHOT
TABLE 10.ALS LIMITED: OPERATING SEGMENTS
TABLE 11.ALS LIMITED: PRODUCT PORTFOLIO
TABLE 12.ALS LIMITED: KEY STRATEGIC MOVES AND DEVELOPMENTS
TABLE 13.BSI.:KEY EXECUTIVES
TABLE 14.BSI: COMPANY SNAPSHOT
TABLE 15.BSI: OPERATING SEGMENTS
TABLE 16.BSI: PRODUCT PORTFOLIO
TABLE 17.BSI: KEY STRATEGIC MOVES AND DEVELOPMENTS
TABLE 18.BUREAU VERITAS S.A:KEY EXECUTIVES
TABLE 19.BUREAU VERITAS S.A: COMPANY SNAPSHOT
TABLE 20.BUREAU VERITAS S.A: OPERATING SEGMENTS
TABLE 21.BUREAU VERITAS S.A: PRODUCT PORTFOLIO
TABLE 22.DEKRA:KEY EXECUTIVES
TABLE 23.DEKRA: COMPANY SNAPSHOT
TABLE 24.DEKRA: PRODUCT PORTFOLIO
TABLE 25.DNV:KEY EXECUTIVES
TABLE 26.DNV: COMPANY SNAPSHOT
TABLE 27.DNV: OPERATING SEGMENTS
TABLE 28.DNV: PRODUCT PORTFOLIO
TABLE 29.DNV: KEY STRATEGIC MOVES AND DEVELOPMENTS
TABLE 30.ELEMENT MATERIALS TECHNOLOGY (ELEMENT):KEY EXECUTIVES
TABLE 31.ELEMENT MATERIALS TECHNOLOGY (ELEMENT): COMPANY SNAPSHOT
TABLE 32.ELEMENT MATERIALS TECHNOLOGY (ELEMENT): PRODUCT PORTFOLIO
TABLE 33.ELEMENT MATERIALS TECHNOLOGY (ELEMENT): KEY STRATEGIC MOVES AND DEVELOPMENTS
TABLE 34.INTERTEK GROUP PLC.:KEY EXECUTIVES
TABLE 35.INTERTEK GROUP PLC.: COMPANY SNAPSHOT
TABLE 36.INTERTEK GROUP PLC.: OPERATING SEGMENTS
TABLE 37.INTERTEK GROUP PLC: PRODUCT PORTFOLIO
TABLE 38.INTERTEK GROUP PLC: KEY STRATEGIC MOVES AND DEVELOPMENTS
TABLE 39.ISO:KEY EXECUTIVES
TABLE 40.ISO: COMPANY SNAPSHOT
TABLE 41.ISO: PRODUCT PORTFOLIO
TABLE 42.ISO: KEY STRATEGIC MOVES AND DEVELOPMENTS
TABLE 43.TUV SUD AG: KEY EXECUTIVES
TABLE 44.TUV SUD AG: COMPANY SNAPSHOT
TABLE 45.TUV SUD AG: OPERATING SEGMENTS
TABLE 46.TUV SUD AG: PRODUCT PORTFOLIO
TABLE 47.TUV SUD AG: KEY STRATEGIC MOVES AND DEVELOPMENTS
LIST OF FIGURES
FIGURE 01.KEY MARKET SEGMENTS
FIGURE 02.EXECUTIVE SUMMARY, BY SEGMENTATION
FIGURE 03.TOP IMPACTING FACTORS
FIGURE 04.TOP INVESTMENT POCKETS
FIGURE 05.MODERATE BARGAINING POWER OF SUPPLIERS
FIGURE 06.HIGH THREAT OF NEW ENTRANTS
FIGURE 07.MODERATE TO HIGH THREAT OF SUBSTITUTES
FIGURE 08.MODERATE TO HIGH INTENSITY OF RIVALRY
FIGURE 09.MODERATE BARGAINING POWER OF BUYERS
FIGURE 10.U.S. CONSUMER PRODUCT SAFETY TESTING MARKET SHARE, BY SERVICE TYPE, 2020–2030 (%)
FIGURE 11.U.S. CONSUMER PRODUCT SAFETY TESTING MARKET SHARE FOR ELECTROMAGNETIC COMPATIBILITY, 2020-2030 ($MILLION)
FIGURE 12.U.S. CONSUMER PRODUCT SAFETY TESTING MARKET SHARE FOR ELECTRICAL SAFETY, 2020-2030 ($MILLION)
FIGURE 13.U.S. CONSUMER PRODUCT SAFETY TESTING MARKET SHARE FOR CONNECTIVITY, 2020-2030 ($MILLION)
FIGURE 14.U.S. CONSUMER PRODUCT SAFETY TESTING MARKET SHARE FOR ELECTRONIC TESTING, 2020-2030 ($MILLION)
FIGURE 15.U.S. CONSUMER PRODUCT SAFETY TESTING MARKET SHARE FOR ENERGY EFFICIENCY TESTING, 2020-2030 ($MILLION)
FIGURE 16.U.S. CONSUMER PRODUCT SAFETY TESTING MARKET SHARE FOR OTHERS, 2020-2030 ($MILLION)
FIGURE 17.U.S. CONSUMER PRODUCT SAFETY TESTING MARKET SHARE, BY SOURCING TYPE, 2020–2030 (%)
FIGURE 18.U.S. CONSUMER PRODUCT SAFETY TESTING MARKET SHARE FOR IN-HOUSE, 2020-2030 ($MILLION)
FIGURE 19.U.S. CONSUMER PRODUCT SAFETY TESTING MARKET SHARE FOR OUTSOURCE, 2020-2030 ($MILLION)
FIGURE 20.U.S. CONSUMER PRODUCT SAFETY TESTING MARKET SHARE, BY INDUSTRY VERTICAL, 2020–2030 (%)
FIGURE 21.U.S. CONSUMER PRODUCT SAFETY TESTING MARKET SHARE FOR OUTSOURCE, 2020-2030 ($MILLION)
FIGURE 22.U.S. CONSUMER PRODUCT SAFETY TESTING MARKET SHARE FOR SEMICONDUCTORS, 2020-2030 ($MILLION)
FIGURE 23.U.S. CONSUMER PRODUCT SAFETY TESTING MARKET SHARE FOR AEROSPACE AND DEFENSE, 2020-2030 ($MILLION)
FIGURE 24.U.S. CONSUMER PRODUCT SAFETY TESTING MARKET SHARE FOR CONSUMER ELECTRONICS, 2020-2030 ($MILLION)
FIGURE 25.U.S. CONSUMER PRODUCT SAFETY TESTING MARKET SHARE FOR AUTOMOTIVE, 2020-2030 ($MILLION)
FIGURE 26.U.S. CONSUMER PRODUCT SAFETY TESTING MARKET SHARE FOR HEALTHCARE, 2020-2030 ($MILLION)
FIGURE 27.U.S. CONSUMER PRODUCT SAFETY TESTING MARKET SHARE FOR INDUSTRIAL, 2020-2030 ($MILLION)
FIGURE 28.U.S. CONSUMER PRODUCT SAFETY TESTING MARKET SHARE FOR FOOD AND BEVERAGES, 2020-2030 ($MILLION)
FIGURE 29.U.S. CONSUMER PRODUCT SAFETY TESTING MARKET SHARE FOR OTHERS, 2020-2030 ($MILLION)
FIGURE 30.MARKET PLAYER POSITIONING, 2020
FIGURE 31.ALS LIMITED: REVENUE, 2018–2020 ($MILLION)
FIGURE 32.ALS LIMITED: REVENUE SHARE, BY SEGMENT, 2020 (%)
FIGURE 33.ALS LIMITED: REVENUE SHARE, BY REGION, 2020 (%)
FIGURE 34.BSI: REVENUE, 2018–2020 ($MILLION)
FIGURE 35.BSI: REVENUE SHARE, BY SEGMENT, 2020 (%)
FIGURE 36.BSI: REVENUE SHARE, BY REGION, 2020 (%)
FIGURE 37.BUREAU VERITAS S.A: R&D EXPENDITURE, 2018–2020 ($MILLION)
FIGURE 38.BUREAU VERITAS S.A: NET SALES, 2018–2020 ($MILLION)
FIGURE 39.BUREAU VERITAS S.A: REVENUE SHARE BY SEGMENT, 2020 (%)
FIGURE 40.BUREAU VERITAS S.A: REVENUE SHARE, BY REGION, 2020 (%)
FIGURE 41.DEKRA: REVENUE, 2018–2020 ($MILLION)
FIGURE 42.DEKRA: REVENUE SHARE, BY SEGMENT, 2020 (%)
FIGURE 43.DEKRA: REVENUE SHARE, BY REGION, 2020 (%)
FIGURE 44.DNV: REVENUE, 2018–2020 ($MILLION)
FIGURE 45.DNV: REVENUE SHARE, BY SEGMENT, 2020 (%)
FIGURE 46.INTERTEK GROUP PLC: R&D EXPENDITURE, 2018–2020 ($MILLION)
FIGURE 47.INTERTEK GROUP PLC: REVENUE, 2018–2020 ($MILLION)
FIGURE 48.INTERTEK GROUP PLC: REVENUE SHARE, BY SEGMENT, 2020 (%)
FIGURE 49.INTERTEK GROUP PLC: REVENUE SHARE, BY REGION, 2020 (%)
FIGURE 50.ISO: REVENUE, 2018–2020 ($MILLION)
FIGURE 51.TUV SUD AG: R&D EXPENDITURE, 2018–2020 ($MILLION)
FIGURE 52.TUV SUD AG: REVENUE, 2018–2020 ($MILLION)
FIGURE 53.TUV SUD AG: REVENUE SHARE, BY SEGMENT, 2020 (%)
FIGURE 54.TUV SUD AG: REVENUE SHARE, BY REGION, 2020 (%)
The U.S. consumer product safety testing market is competitive, owing to strong presence of existing vendors. Consumer product safety testing companies with access to extensive technical and financial resources, are anticipated to gain a competitive edge over their rivals, as they have the capacity to cater to the market requirements. The competitive environment in this market is expected to further intensify with increase in technological innovations, product extensions, and different strategies adopted by firms.
The consumer product safety testing market holds a substantial scope for growth on a global scale. Its contribution to the market is anticipated to increase significantly during the forecast period. Recent discoveries and innovations have created vast opportunities for numerous players to step in the U.S. consumer product safety testing market. Moreover consumer product safety testing services ensure quality assurance, verification of the safety, security, and performance of a product, service, or process, higher level of cost control improvement, and faster improvement of various processes.
Increasing focus of manufacturing companies to improve customer retention by offering quality products and surging demand for interoperability testing for connected devices and IoT drives the market growth. High cost of consumer product safety testing services due to diverse standards and regulations across different geographies is the biggest limitation for the market growth.
Surge in competition and reduced awareness among small scale manufactures are the key factors that hamper the growth of the market. Increase in awareness for need of testing and rise in concern for safety and quality are the factors opportunistic for the market growth.Â
The key players profiled in the report include ABS, ALS Limited, BSI Group, Bureau Veritas SA, DEKRA, DNV, Element Materials Technology, Intertek Group PLC, ISO and TUV.
A. The U.S. consumer product safety testing market is estimated to grow at a CAGR of 3.6% from 2021 to 2030.
A. The U.S. consumer product safety testing market is projected to reach $10,546.4 million by 2030.
A. To get the latest version of sample report
A. Rise in awareness for need for product safety testing and surge in need of safety.
A. The key players profiled in the report include ABS, ALS Limited, BSI Group, Bureau Veritas SA, DEKRA, DNV, and many more.
A. On the basis of top growing big corporations, we select top 10 players.
A. The U.S. consumer product safety testing market is segmented on the basis of offering, sourcing type and industry vertical.
A. The key growth strategies of U.S. consumer product safety testing market players include product portfolio expansion, mergers & acquisitions, agreements, regional expansion, and collaboration.
A. Connectivity segment would grow at a highest CAGR of 7.7% during the forecast period.
Start reading instantly.
This Report and over 67,404+ more Reports, Available with Avenue Library. T&C*.
Enterprise
License/PDF
Library
Membership
*Taxes/Fees, if applicable will be added during checkout. All prices in USD
To ensure high-level data integrity, accurate analysis, and impeccable forecasts
For complete satisfaction
On-demand customization of scope of the report to exactly meet your needs
Targeted market view to provide pertinent information and save time of readers
Get insights on topics that are crucial for your business. Stay abreast of your interest areas.
Get Industry Data AlertsTo ensure high-level data integrity, accurate analysis, and impeccable forecasts
For complete satisfaction
On-demand customization of scope of the report to exactly meet your needs
Targeted market view to provide pertinent information and save time of readers