0
2023
Biotin Supplement Market

Biotin Supplement Market

by Product Form (Capsules, Tablets, Soft Gels, Liquid, Gummies, Powders), by Distributional Channel (Supermarkets/Hypermarkets, Specialty store, E-commerce), by Application (Pharmaceutical, Skin-care, Hair-care, Nail-care): Global Opportunity Analysis and Industry Forecast, 2021-2031

Report Code: A10616
Feb 2023 | Pages: 240
Tables: 150
Charts: 67
  • Formats*:

  • pdf

    Single User License, Five User
    License & Enterprise User License

  • xls

    Data Pack Excel License

  • ppt

    It comes with the additional cost
    of $2500.00 contact sales.


Biotin Supplement Market Research, 2031

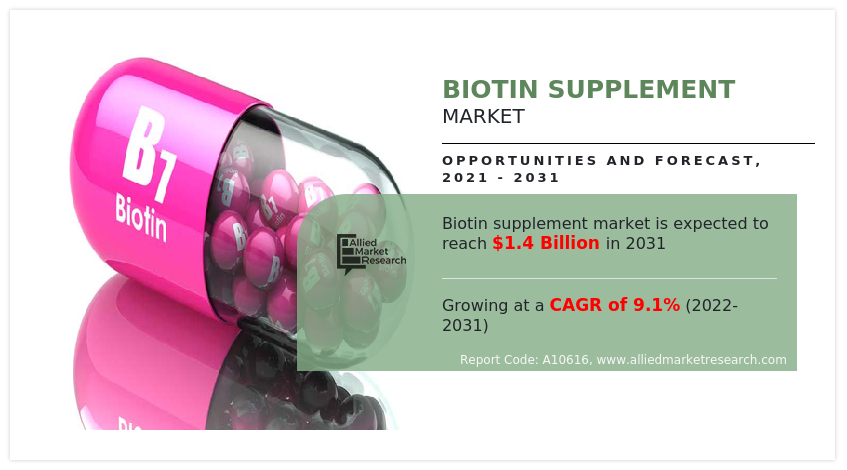
The global biotin supplement market size was valued at $583.4 million in 2021, and biotin supplement market forecast to reach $1.4 billion by 2031, growing at a CAGR of 9.1% from 2022 to 2031.

Biotin, a B vitamin, is an important nutrient that is naturally present in some food as well as available as a dietary supplement. Biotin helps turn the carbohydrates, fats, and proteins in the food into the energy needed. Vitamin B7 can be recognized by its popular name biotin. It is a water-soluble vitamin and is a cofactor for five carboxylases (propionyl-CoA carboxylase, pyruvate carboxylase, methyl crotonyl-CoA carboxylase [MCC], acetyl-CoA carboxylase 1, and acetyl-CoA carboxylase 2) which catalyze critical steps in the metabolism of fatty acid, glucose, and amino acids. Food that contain the most biotin include organ meats, eggs, fish, meat, seeds, nuts, and certain vegetables.

Biotin supplements are used to cure biotin deficiency. These are also used for hair loss, brittle nails, and other conditions. However, there is no good scientific evidence to support these. Biotin supplements might interfere with some lab tests. These supplements should be taken after consulting with the doctor. The adequate intake for biotin for men and women 19 years and older and pregnant women is 30 micrograms daily. Lactating women need 35 micrograms daily. There is no upper intake limit for biotin as it is a water soluble vitamin so extra biotin went out of the body with urine. The rise in awareness regarding biotin supplements and high inclination towards consumotion of such supplements are major biotin supplement market trends.
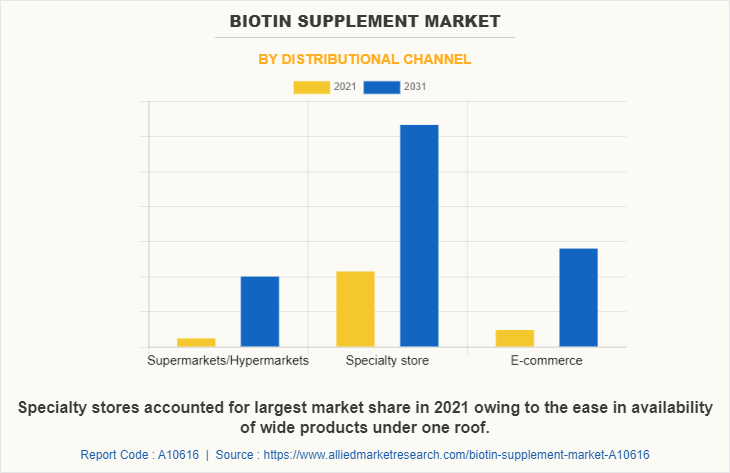
E-commerce was operating during the COVID-19 pandemic and e-commerce boomed as a distribution channel since consumers were afraid of going to crowded places and were preferring online sales channels as it was offering the convenience of getting biotin supplements while sitting at home. This further increased the sales of biotin supplements during the pandemic. Moreover, the rapid adoption of online pharmacies among consumers further boosted the sales of biotin supplements across the globe. Therefore, the COVID-19 pandemic had a positive effect on the global biotin supplements market and this trend is expected to continue for the next couple of years owing to the increased health consciousness among consumers

Biotin Supplement Market

As per the report of the National Library of Medicine in the U.S., approximately 68% of adults used dietary supplements in 2019. Such huge usage of dietary supplements coupled with rise in awareness regarding the health benefits of dietary supplements is expected to drive the growth of the market. According to the Indian Journal of Medical Research (IJMR), around 33% of the population in the U.S. and several major nations of Europe like Denmark, the UK, and Sweden regularly consume dietary supplements and vitamin supplements which is expected to boost the biotin supplement market size.

As per an article by the National Library of Medicine, healthcare cost is directly affected by macroeconomic indicators since an increase in income levels of a country allows governments to increase their revenue through tax. Public healthcare costs are influenced by inflation as it affects the prices of goods and services including costs of health-related materials. The rise in healthcare costs, result in population’s limelight on biotin supplements so they can avoid healthcare expenses. According to the report of the Tennessee Advisory Commission on Intergovernmental Relations, in the U.S., healthcare is expensive. Healthcare costs have been increasing and are expected to continue rising over the next few years. From 2017 to 2018, healthcare spending increased by 4.6% to a total of $3.6 trillion, or $11,172 per person, and is expected to rise from 17.7% of gross domestic product (GDP) in 2018 to 19.7% in 2028, almost one of every five dollars spent in the U.S. These factors result in high healthcare costs which is expected to boost the biotin supplement industry.

Vitamins are needed to process functions such as growth, reproduction, and general well-being of a human. Rise in preference regarding vitamins in the daily diet for self-care has emerged as an important component of lifestyle among modern customers. There has been a rapid change in consumer food habits since consumers are focusing on health and immunity. There has been an expansion of the usage of vitamins, minerals, food that enhance immunity, organic goods, supplements, and other dietary aids.

According to the report of the National Library of Medicine, biotin deficiency leads to variable clinical presentations, mainly neurological and dermal abnormalities. Biotinidase deficiency is the most common etiology in many countries, including the U.S., and screening for biotinidase deficiency is a part of the newborn screening program. In addition, people have started focusing on their diet to improve their immunity due to COVID-19 pandemic. All such factors are projected to boost the growth of the biotin supplement market. However, interference of biotin supplements with certain lab tests can restrain the market growth. As biotin consumption can significantly interfere with certain lab tests and can result in incorrect test results which may go undetected. According to the report of the U.S. Food & Drug, the FDA has continued to receive adverse events reports indicating biotin interference caused falsely low troponin results.

Along with troponin, it can also interfere in immunoassays. Immunoassay is a procedure for detecting or measuring specific proteins or other substances through their properties as antigens or antibodies. According to the report of the National Library of Medicine, U.S., biotin interference can occur in immunoassays that employ streptavidin-biotinylated antibodies when high biotin levels in blood samples, resulting from the use of oral biotin supplements, interfere with the streptavidin-biotin binding, thus, distorting signal detection in these tests.

Along with this strict government regulation can also hamper the biotin supplement market growth since FDA regulates both finished dietary supplement products and dietary ingredients. FDA regulates dietary supplements under a different set of regulations than those covering "conventional" food and drug products. Manufacturers and distributors of dietary supplements and dietary ingredients are prohibited from marketing products that are adulterated or misbranded which means these firms are responsible for evaluating the safety and labeling of their products before marketing to ensure that they meet all the requirements of the Federal Food, Drug, and Cosmetic Act as amended by DSHEA and FDA regulations. FDA has the authority to take action against any adulterated or misbranded dietary supplement product after it reaches the market. Such regulation by the government can restrict the biotin supplement market demand.

Rise in demand for organic food can restrain the growth of the market as many food contain some biotin. Anyone can get recommended amounts of biotin by eating a variety of food, including meat, fish, eggs, and organ meats (such as liver), seeds, and nuts. Surge in demand for organic food is projected to hamper the growth of the biotin supplement market since according to the report of the National Institutes of Health Office of Dietary Supplements, biotin is an essential nutrient that is naturally present in some food so if a person consumes food, then that person does not require biotin supplements. Animal-based protein sources like beef liver, chicken liver, salmon, and eggs have a high biotin content. The rise in demand for organic animal-based protein coupled with increase in awareness regarding healthy food habits are encouraging consumers to choose organic food products, which is projected to restrain the growth of the market. Rise in consumption of alcohol among global population is expected to create an opportunity for the growth of the market as alcoholism can lead to biotin deficiency. As per the report of Harvard T.H. Chan School of Public Health, alcoholism can increase the risk of biotin deficiency and many other nutrients as alcohol can block their absorption, and also because alcohol abuse is generally associated with poor dietary intake. There is a huge population suffering from alcohol use disorder which is expected to increase the number of people suffering from biotin deficiency.

According to the report of the National Institute on Alcohol Abuse and Alcoholism, in the U.S., 14.5 million (nearly 15 million) people ages 12 and older (5.3 % of this age group) had alcohol use disorder (AUD). This number includes 9.0 million men (6.8 % of men in this age group) and 5.5 million women (3.9 % of women in this age group) in 2019. According to the report of Our World in Data organization globally, 107 million people are estimated to have an alcohol use disorder. Such a huge number of alcoholic disorders can lead to biotin deficiency in people which is expected to boost the biotin supplement market growth. Along with this, rise in number of online pharmacies is expected to create an opportunity for the growth of the market as it is easy for consumers to purchase biotin supplements online since it provides them with a home delivery facility and they can get the information about the product while sitting at home. There is a huge rise in the number of online pharmacies worldwide. Online pharmacies like Apollo, Netmeds, Pharmeasy, and others provide various offers and discounts to consumers to lure them. A surge in the number of online pharmacies is expected to create an opportunity for the market growth. According to the report of Invest India Indian e-Pharmacies, which emerged around 2015, have disrupted the market growth and gained traction rapidly. Currently, there are close to 50 e-Pharmacies in India and estimates peg the market size (2019) at $0.5B – approximately 2-3% of the total Indian pharmacy sales. The market is expected to grow at a compounded rate of 44% to reach $4.5B by 2025. Such rise in e-pharmacies is expected to create biotin supplement market opportunity.

The biotin supplement industry is segmented into Distributional Channel, Application and Product Form. By product form, the market is divided into capsules, tablets, soft gels, liquid, gummies, and powders. By distributional channel, the market is further divided into supermarkets, specialty stores, and e-commerce. By application, the market is classified into pharmaceuticals, skin-care, health-care, and nail-care.
Biotin Supplement Market

By distributional channel, the online segment is expected to register the highest growth with a CAGR of 9.2% owing to easy availability and the benefits such as knowledge about the attributes of the products, and time-saving features.
Biotin Supplement Market

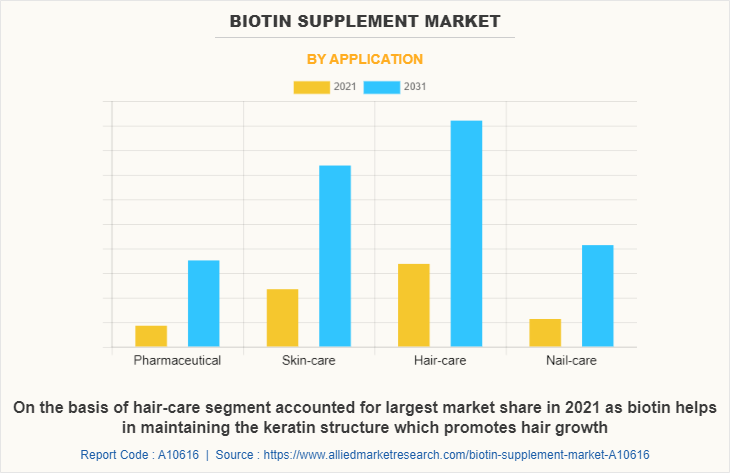
Hair-care is expected to dominate the market during the forecast period on the basis of application with a CAGR of 8.7% owing to the changing fashion trends and increased awareness of the availability of new, more effective, and safer hair care products.
Biotin Supplement Market

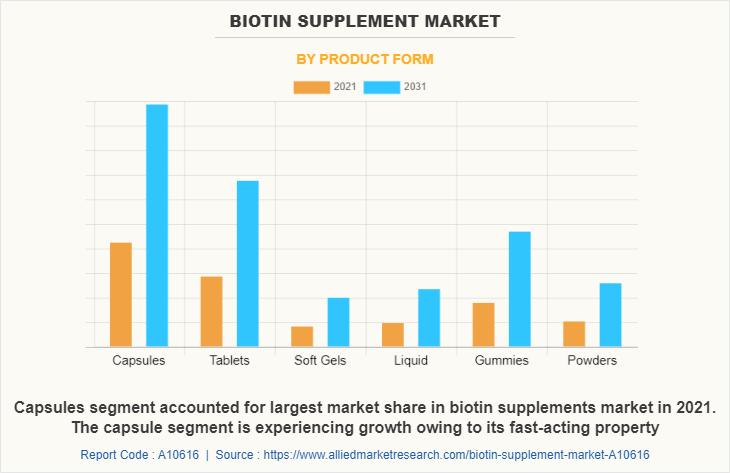
By product form, the capsules segment dominated the market in 2021 and is expected to remain dominant during the forecast period registering a growth of 8.7%. This growth is owing to its fast-acting property as it is absorbed by the body faster compared to other forms of biotin supplements.
Biotin Supplement Market

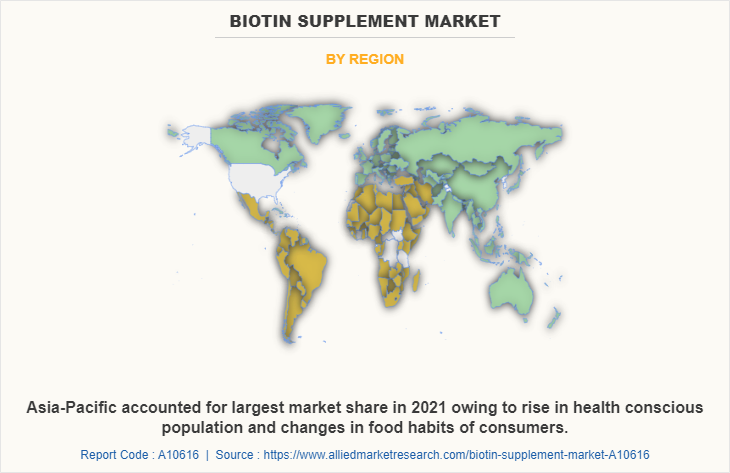
Asia-Pacific dominated the biotin supplement market share in 2021 and is expected to register a highest growth with a CAGR of 9.7% owing to its huge population coupled with rise in disposable income.

Key Benefits For Stakeholders

  • This report provides a quantitative analysis of the market segments, current trends, estimations, and dynamics of the biotin supplement market analysis from 2021 to 2031 to identify the prevailing biotin supplement market opportunities.
  • The market research is offered along with information related to key drivers, restraints, and opportunities.
  • Porter's five forces analysis highlights the potency of buyers and suppliers to enable stakeholders make profit-oriented business decisions and strengthen their supplier-buyer network.
  • In-depth analysis of the biotin supplement market segmentation assists to determine the prevailing market opportunities.
  • Major countries in each region are mapped according to their revenue contribution to the global market.
  • Market player positioning facilitates benchmarking and provides a clear understanding of the present position of the market players.
  • The report includes the analysis of the regional as well as global biotin supplement market trends, key players, market segments, application areas, and market growth strategies.

Biotin Supplement Market Report Highlights

Aspects Details
Market Size By 2031 USD 1.4 billion
Growth Rate CAGR of 9.1%
Forecast period 2021 - 2031
Report Pages 240
By Distributional Channel
  • Supermarkets/Hypermarkets
  • Specialty store
  • E-commerce
By Application
  • Nail-care
  • Pharmaceutical
  • Skin-care
  • Hair-care
By Product Form
  • Capsules
  • Tablets
  • Soft Gels
  • Liquid
  • Gummies
  • Powders
By Region
  • North America  (U.S., Canada, Mexico)
  • Europe  (Germany, France, UK, Italy, Spain, Russia, Rest of Europe)
  • Asia-Pacific  (China, Japan, India, South Korea, Australia, Thailand, Rest of Asia-Pacific)
  • LAMEA  (Brazil, South Africa,, Saudi Arabia, UAE, Rest of LAMEA)
Key Market Players Zenwise, LLC, SBR Nutrition, Life Extension, Vytalogy Wellness, L.L.C., NOW Health Group, Inc., Nestle S.A., Nutraceutical Corporation, SolaGarden Naturals, Sports Research Corporation, Church & Dwight Co., Inc., Doctor's Best, Inc., Designs for Health, Inc.
 

CHAPTER 1:INTRODUCTION

1.1.Report description
1.2.Key benefits for stakeholders
1.3.Key market segments
1.4.Research methodology

1.4.1.Secondary research
1.4.2.Primary research
1.4.3.Analyst tools and models

CHAPTER 2:EXECUTIVE SUMMARY

2.1.Snapshot
2.2.CXO perspective

CHAPTER 3:MARKET OVERVIEW

3.1.Market definition and scope
3.2.Key findings

3.2.1.Top investment pockets

3.3.Porter's five force analysis
3.4.Market dynamics

3.4.1.Drivers

3.4.1.1.Rise in awareness regarding biotin supplements
3.4.1.2.Increased healthcare cost
3.4.1.3.Increase in preference regarding biotins in the daily diet

3.4.2.Restraints

3.4.2.1.Interference with certain lab tests
3.4.2.2.Increase in demand for organic food

3.4.3.Opportunities

3.4.3.1.Rise in number of online pharmacies
3.4.3.2.Rise in alcohol consumption

3.5.Global Biotin Supplements Market: Market Share Analysis

3.5.1.By Product form
3.5.2.By distributional channel
3.5.3.By Application
3.5.4.By Region

3.6.COVID-19 Impact on the Biotin Supplements Market

CHAPTER 4:BIOTIN SUPPLEMENTS MARKET, BY PRODUCT FORM

4.1.Overview

4.1.1.Market size and forecast by product form

4.2.Capsule

4.2.1.Key market trends, growth factors, and opportunities
4.2.2.Market size and forecast, by region

4.3.Tablet

4.3.1.Key market trends, growth factors, and opportunities
4.3.2.Market size and forecast, by region

4.4.Soft Gels

4.4.1.Key market trends, growth factors, and opportunities
4.4.2.Market size and forecast, by region

4.5.Liquid

4.5.1.Key market trends, growth factors, and opportunities
4.5.2.Market size and forecast, by region

4.6.Gummies

4.6.1.Key market trends, growth factors, and opportunities
4.6.2.Market size and forecast, by region

4.7.Powders

4.7.1.Key market trends, growth factors, and opportunities
4.7.2.Market size and forecast, by region

CHAPTER 5:BIOTIN SUPPLEMENTS MARKET, BY DISTRIBUTIONAL CHANNEL

5.1.Overview

5.1.1.Market size and forecast by distributional channel

5.2.Supermarkets/hypermarkets

5.2.1.Key market trends, growth factors, and opportunities
5.2.2.Market size and forecast, by region

5.3.Specialty Stores

5.3.1.Key market trends, growth factors, and opportunities
5.3.2.Market size and forecast, by region

5.4.E-commerce

5.4.1.Key market trends, growth factors, and opportunities
5.4.2.Market size and forecast, by region

CHAPTER 6:BIOTIN SUPPLEMENTS MARKET, BY APPLICATION

6.1.Overview

6.1.1.Market size and forecast by application

6.2.Pharmaceutical

6.2.1.Key market trends, growth factors, and opportunities
6.2.2.Market size and forecast, by region

6.3.Skin care

6.3.1.Key market trends, growth factors, and opportunities
6.3.2.Market size and forecast, by region

6.4.Hair care

6.4.1.Key market trends, growth factors, and opportunities
6.4.2.Market size and forecast, by region

6.5.Nail care

6.5.1.Key market trends, growth factors, and opportunities
6.5.2.Market size and forecast, by region

CHAPTER 7:BIOTIN SUPPLEMENTS MARKET, BY REGION

7.1.Overview

7.1.1.Market size and forecast

7.2.North America

7.2.1.Key market trends, growth factors, and opportunities
7.2.2.Market size and forecast, by product form
7.2.3.Market size and forecast, by distributional channel
7.2.4.Market size and forecast, by application
7.2.5.Market size and forecast, by country

7.2.5.1.U.S.

7.2.5.1.1.Market size and forecast, by product form
7.2.5.1.2.Market size and forecast, by distributional channel
7.2.5.1.3.Market size and forecast, by application

7.2.5.2.Canada

7.2.5.2.1.Market size and forecast, by product form
7.2.5.2.2.Market size and forecast, by distributional channel
7.2.5.2.3.Market size and forecast, by application

7.2.5.3.Mexico

7.2.5.3.1.Market size and forecast, by product form
7.2.5.3.2.Market size and forecast, by distributional channel
7.2.5.3.3.Market size and forecast, by application

7.3.Europe

7.3.1.Key market trends, growth factors, and opportunities
7.3.2.Market size and forecast, by product form
7.3.3.Market size and forecast, by distributional channel
7.3.4.Market size and forecast, by application
7.3.5.Market size and forecast, by country

7.3.5.1.Germany

7.3.5.1.1.Market size and forecast, by product form
7.3.5.1.2.Market size and forecast, by distributional channel
7.3.5.1.3.Market size and forecast, by application

7.3.5.2.France

7.3.5.2.1.Market size and forecast, by product form
7.3.5.2.2.Market size and forecast, by distributional channel
7.3.5.2.3.Market size and forecast, by application

7.3.5.3.UK

7.3.5.3.1.Market size and forecast, by product form
7.3.5.3.2.Market size and forecast, by distributional channel
7.3.5.3.3.Market size and forecast, by application

7.3.5.4.Italy

7.3.5.4.1.Market size and forecast, by product form
7.3.5.4.2.Market size and forecast, by distributional channel
7.3.5.4.3.Market size and forecast, by application

7.3.5.5.Spain

7.3.5.5.1.Market size and forecast, by product form
7.3.5.5.2.Market size and forecast, by distributional channel
7.3.5.5.3.Market size and forecast, by application

7.3.5.6.Russia

7.3.5.6.1.Market size and forecast, by product form
7.3.5.6.2.Market size and forecast, by distributional channel
7.3.5.6.3.Market size and forecast, by application

7.3.5.7.Rest of Europe

7.3.5.7.1.Market size and forecast, by product form
7.3.5.7.2.Market size and forecast, by distributional channel
7.3.5.7.3.Market size and forecast, by application

7.4.Asia-Pacific

7.4.1.Key market trends, growth factors, and opportunities
7.4.2.Market size and forecast, by product form
7.4.3.Market size and forecast, by distributional channel
7.4.4.Market size and forecast, by application
7.4.5.Market size and forecast, by country

7.4.5.1.China

7.4.5.1.1.Market size and forecast, by product form
7.4.5.1.2.Market size and forecast, by distributional channel
7.4.5.1.3.Market size and forecast, by application

7.4.5.2.Japan

7.4.5.2.1.Market size and forecast, by product form
7.4.5.2.2.Market size and forecast, by distributional channel
7.4.5.2.3.Market size and forecast, by application

7.4.5.3.India

7.4.5.3.1.Market size and forecast, by product form
7.4.5.3.2.Market size and forecast, by distributional channel
7.4.5.3.3.Market size and forecast, by application

7.4.5.4.South Korea

7.4.5.4.1.Market size and forecast, by product form
7.4.5.4.2.Market size and forecast, by distributional channel
7.4.5.4.3.Market size and forecast, by application

7.4.5.5.Australia

7.4.5.5.1.Market size and forecast, by product form
7.4.5.5.2.Market size and forecast, by distributional channel
7.4.5.5.3.Market size and forecast, by application

7.4.5.6.Thailand

7.4.5.6.1.Market size and forecast, by product form
7.4.5.6.2.Market size and forecast, by distributional channel
7.4.5.6.3.Market size and forecast, by application

7.4.5.7.Rest of Asia-Pacific

7.4.5.7.1.Market size and forecast, by product form
7.4.5.7.2.Market size and forecast, by distributional channel
7.4.5.7.3.Market size and forecast, by application

7.5.LAMEA

7.5.1.Key market trends, growth factors, and opportunities
7.5.2.Market size and forecast, by product form
7.5.3.Market size and forecast, by distributional channel
7.5.4.Market size and forecast, by application
7.5.5.Market size and forecast, by country

7.5.5.1.Brazil

7.5.5.1.1.Market size and forecast, by product form
7.5.5.1.2.Market size and forecast, by distributional channel
7.5.5.1.3.Market size and forecast, by application

7.5.5.2.South Africa

7.5.5.2.1.Market size and forecast, by product form
7.5.5.2.2.Market size and forecast, by distributional channel
7.5.5.2.3.Market size and forecast, by application

7.5.5.3.Saudi Arabia

7.5.5.3.1.Market size and forecast, by product form
7.5.5.3.2.Market size and forecast, by distributional channel
7.5.5.3.3.Market size and forecast, by application

7.5.5.4.UAE

7.5.5.4.1.Market size and forecast, by product form
7.5.5.4.2.Market size and forecast, by distributional channel
7.5.5.4.3.Market size and forecast, by application

7.5.5.5.Rest of LAMEA

7.5.5.5.1.Market size and forecast, by product form
7.5.5.5.2.Market size and forecast, by distributional channel
7.5.5.5.3.Market size and forecast, by application

CHAPTER 8:COMPETITION LANDSCAPE

8.1.Overview
8.2.Competitive dashboard
8.3.Competitive heat map
8.4.Product mapping
8.5.Top winning strategies
8.6.Key developments

8.6.1.Acquisition
8.6.2.Merger
8.6.3.Partnership

8.7.Top Player Positioning

CHAPTER 9:COMPANY PROFILE

9.1.CHURCH and DWIGHT CO., INC.

9.1.1.Company overview (business description)
9.1.2.Operating business segments
9.1.3.Business performance
9.1.4.Product portfolio

9.2.NESTLE S.A.

9.2.1.Company overview (business description)
9.2.2.Operating business segments
9.2.3.Business performance
9.2.4.Product portfolio
9.2.5.Key strategic moves and developments

9.3.NUTRACEUTICAL CORPORATION

9.3.1.Company overview (business description)
9.3.2.Operating business segments
9.3.3.Product portfolio

9.4.VYTALOGY WELLNESS, L.L.C.

9.4.1.Company overview (business description)
9.4.2.Operating business segments
9.4.3.Product portfolio
9.4.4.Key strategic moves and developments

9.5.DOCTOR'S BEST, INC.

9.5.1.Company overview (business description)
9.5.2.Operating business segments
9.5.3.Product portfolio

9.6.ZENWISE, LLC

9.6.1.Company overview (business description)
9.6.2.Operating business segments
9.6.3.Product portfolio

9.7.SBR NUTRITION

9.7.1.Company overview (business description)
9.7.2.Operating business segments
9.7.3.Product portfolio

9.8.SPORTS RESEARCH CORPORATION

9.8.1.Company overview (business description)
9.8.2.Operating business segments
9.8.3.Product portfolio

9.9.NOW HEALTH GROUP, INC.

9.9.1.Company overview (business description)
9.9.2.Operating business segments
9.9.3.Product portfolio
9.9.4.Key strategic moves and developments

9.10.LIFE EXTENSION

9.10.1.Company overview (business description)
9.10.2.Operating business segments
9.10.3.Product portfolio

9.11.DESIGNS FOR HEALTH, INC.

9.11.1.Company overview (business description)
9.11.2.Operating business segments
9.11.3.Product portfolio

9.12.SOLAGARDEN NATURALS

9.12.1.Company overview (business description)
9.12.2.Operating business segments
9.12.3.Product portfolio

LIST OF TABLES

TABLE 01.BIOTIN SUPPLEMENTS MARKET, BY PRODUCT FORM, 2021–2031 ($MILLION)68
TABLE 02.BIOTIN SUPPLEMENTS MARKET FOR CAPSULE, BY REGION, 2021–2031 ($MILLION)70
TABLE 03.BIOTIN SUPPLEMENTS MARKET FOR TABLET, BY REGION, 2021–2031 ($MILLION)72
TABLE 04.BIOTIN SUPPLEMENTS MARKET FOR GEL, BY REGION, 2021–2031 ($MILLION)75
TABLE 05.BIOTIN SUPPLEMENTS MARKET FOR LIQUID, BY REGION, 2021–2031 ($MILLION)77
TABLE 06.BIOTIN SUPPLEMENTS MARKET FOR GUMMIES, BY REGION, 2021–2031 ($MILLION)80
TABLE 07.BIOTIN SUPPLEMENTS MARKET FOR POWDERS, BY REGION, 2021–2031 ($MILLION)82
TABLE 08.BIOTIN SUPPLEMENTS MARKET, BY DISTRIBUTIONAL CHANNEL, 2021–2031 ($MILLION)85
TABLE 09.BIOTIN SUPPLEMENTS MARKET FOR SUPERMARKETS/HYPERMARKETS, BY REGION, 2021–2031 ($MILLION)87
TABLE 10.BIOTIN SUPPLEMENTS MARKET FOR SPECIALTY STORES, BY REGION, 2021–2031 ($MILLION)90
TABLE 11.BIOTIN SUPPLEMENTS MARKET FOR E-COMMERCE, BY REGION, 2021–2031 ($MILLION)93
TABLE 12.BIOTIN SUPPLEMENTS MARKET, BY APPLICATION, 2021–2031 ($MILLION)96
TABLE 13.BIOTIN SUPPLEMENTS MARKET FOR PHARMACEUTICAL, BY REGION, 2021–2031 ($MILLION)98
TABLE 14.BIOTIN SUPPLEMENTS MARKET FOR SKIN CARE, BY REGION, 2021–2031 ($MILLION)100
TABLE 15.BIOTIN SUPPLEMENTS MARKET FOR HAIR CARE, BY REGION, 2021–2031 ($MILLION)103
TABLE 16.BIOTIN SUPPLEMENTS MARKET FOR NAIL CARE, BY REGION, 2021–2031 ($MILLION)105
TABLE 17.BIOTIN SUPPLEMENTS MARKET, BY REGION, 2021–2031 ($MILLION)108
TABLE 18.NORTH AMERICA BIOTIN SUPPLEMENTS MARKET, BY PRODUCT FORM, 2021–2031 ($MILLION)110
TABLE 19.NORTH AMERICA BIOTIN SUPPLEMENTS MARKET, BY DISTRIBUTIONAL CHANNEL, 2021–2031 ($MILLION)111
TABLE 20.NORTH AMERICA BIOTIN SUPPLEMENTS MARKET, BY APPLICATION, 2021–2031 ($MILLION)112
TABLE 21.NORTH AMERICA BIOTIN SUPPLEMENTS MARKET, BY COUNTRY, 2021–2031 ($MILLION)113
TABLE 22.U.S. BIOTIN SUPPLEMENTS MARKET, BY PRODUCT FORM, 2021–2031 ($MILLION)115
TABLE 23.U.S. BIOTIN SUPPLEMENTS MARKET, BY DISTRIBUTIONAL CHANNEL, 2021–2031 ($MILLION)116
TABLE 24.U.S. BIOTIN SUPPLEMENTS MARKET, BY APPLICATION, 2021–2031 ($MILLION)117
TABLE 25.CANADA BIOTIN SUPPLEMENTS MARKET, BY PRODUCT FORM, 2021–2031 ($MILLION)119
TABLE 26.CANADA BIOTIN SUPPLEMENTS MARKET, BY DISTRIBUTIONAL CHANNEL, 2021–2031 ($MILLION)120
TABLE 27.CANADA BIOTIN SUPPLEMENTS MARKET, BY APPLICATION, 2021–2031 ($MILLION)121
TABLE 28.MEXICO BIOTIN SUPPLEMENTS MARKET, BY PRODUCT FORM, 2021–2031 ($MILLION)123
TABLE 29.MEXICO BIOTIN SUPPLEMENTS MARKET, BY DISTRIBUTIONAL CHANNEL, 2021–2031 ($MILLION)124
TABLE 30.MEXICO BIOTIN SUPPLEMENTS MARKET, BY APPLICATION, 2021–2031 ($MILLION)125
TABLE 31.EUROPE BIOTIN SUPPLEMENTS MARKET, BY PRODUCT FORM, 2021–2031 ($MILLION)127
TABLE 32.EUROPE BIOTIN SUPPLEMENTS MARKET, BY DISTRIBUTIONAL CHANNEL, 2021–2031 ($MILLION)128
TABLE 33.EUROPE BIOTIN SUPPLEMENTS MARKET, BY APPLICATION, 2021–2031 ($MILLION)129
TABLE 34.EUROPE BIOTIN SUPPLEMENTS MARKET, BY COUNTRY, 2021–2031 ($MILLION)130
TABLE 35.GERMANY BIOTIN SUPPLEMENTS MARKET, BY PRODUCT FORM, 2021–2031 ($MILLION)132
TABLE 36.GERMANY BIOTIN SUPPLEMENTS MARKET, BY DISTRIBUTIONAL CHANNEL, 2021–2031 ($MILLION)133
TABLE 37.GERMANY BIOTIN SUPPLEMENTS MARKET, BY APPLICATION, 2021–2031 ($MILLION)134
TABLE 38.FRANCE BIOTIN SUPPLEMENTS MARKET, BY PRODUCT FORM, 2021–2031 ($MILLION)136
TABLE 39.FRANCE BIOTIN SUPPLEMENTS MARKET, BY DISTRIBUTIONAL CHANNEL, 2021–2031 ($MILLION)137
TABLE 40.FRANCE BIOTIN SUPPLEMENTS MARKET, BY APPLICATION, 2021–2031 ($MILLION)138
TABLE 41.UK BIOTIN SUPPLEMENTS MARKET, BY PRODUCT FORM, 2021–2031 ($MILLION)140
TABLE 42.UK BIOTIN SUPPLEMENTS MARKET, BY DISTRIBUTIONAL CHANNEL, 2021–2031 ($MILLION)141
TABLE 43.UK BIOTIN SUPPLEMENTS MARKET, BY APPLICATION, 2021–2031 ($MILLION)142
TABLE 44.ITALY BIOTIN SUPPLEMENTS MARKET, BY PRODUCT FORM, 2021–2031 ($MILLION)144
TABLE 45.ITALY BIOTIN SUPPLEMENTS MARKET, BY DISTRIBUTIONAL CHANNEL, 2021–2031 ($MILLION)145
TABLE 46.ITALY BIOTIN SUPPLEMENTS MARKET, BY APPLICATION, 2021–2031 ($MILLION)146
TABLE 47.SPAIN BIOTIN SUPPLEMENTS MARKET, BY PRODUCT FORM, 2021–2031 ($MILLION)148
TABLE 48.SPAIN BIOTIN SUPPLEMENTS MARKET, BY DISTRIBUTIONAL CHANNEL, 2021–2031 ($MILLION)149
TABLE 49.SPAIN BIOTIN SUPPLEMENTS MARKET, BY APPLICATION, 2021–2031 ($MILLION)150
TABLE 50.RUSSIA BIOTIN SUPPLEMENTS MARKET, BY PRODUCT FORM, 2021–2031 ($MILLION)152
TABLE 51.RUSSIA BIOTIN SUPPLEMENTS MARKET, BY DISTRIBUTIONAL CHANNEL, 2021–2031 ($MILLION)153
TABLE 52.RUSSIA BIOTIN SUPPLEMENTS MARKET, BY APPLICATION, 2021–2031 ($MILLION)154
TABLE 53.REST OF EUROPE BIOTIN SUPPLEMENTS MARKET, BY PRODUCT FORM, 2021–2031 ($MILLION)156
TABLE 54.REST OF EUROPE BIOTIN SUPPLEMENTS MARKET, BY DISTRIBUTIONAL CHANNEL, 2021–2031 ($MILLION)157
TABLE 55.REST OF EUROPE BIOTIN SUPPLEMENTS MARKET, BY APPLICATION, 2021–2031 ($MILLION)158
TABLE 56.ASIA-PACIFIC BIOTIN SUPPLEMENTS MARKET, BY PRODUCT FORM, 2021–2031 ($MILLION)160
TABLE 57.ASIA-PACIFIC BIOTIN SUPPLEMENTS MARKET, BY DISTRIBUTIONAL CHANNEL, 2021–2031 ($MILLION)161
TABLE 58.ASIA-PACIFIC BIOTIN SUPPLEMENTS MARKET, BY APPLICATION, 2021–2031 ($MILLION)162
TABLE 59.ASIA-PACIFIC BIOTIN SUPPLEMENTS MARKET, BY COUNTRY, 2021–2031 ($MILLION)163
TABLE 60.CHINA BIOTIN SUPPLEMENTS MARKET, BY PRODUCT FORM, 2021–2031 ($MILLION)165
TABLE 61.CHINA BIOTIN SUPPLEMENTS MARKET, BY DISTRIBUTIONAL CHANNEL, 2021–2031 ($MILLION)166
TABLE 62.CHINA BIOTIN SUPPLEMENTS MARKET, BY APPLICATION, 2021–2031 ($MILLION)167
TABLE 63.JAPAN BIOTIN SUPPLEMENTS MARKET, BY PRODUCT FORM, 2021–2031 ($MILLION)169
TABLE 64.JAPAN BIOTIN SUPPLEMENTS MARKET, BY DISTRIBUTIONAL CHANNEL, 2021–2031 ($MILLION)170
TABLE 65.JAPAN BIOTIN SUPPLEMENTS MARKET, BY APPLICATION, 2021–2031 ($MILLION)171
TABLE 66.INDIA BIOTIN SUPPLEMENTS MARKET, BY PRODUCT FORM, 2021–2031 ($MILLION)173
TABLE 67.INDIA BIOTIN SUPPLEMENTS MARKET, BY DISTRIBUTIONAL CHANNEL, 2021–2031 ($MILLION)174
TABLE 68.INDIA BIOTIN SUPPLEMENTS MARKET, BY APPLICATION, 2021–2031 ($MILLION)175
TABLE 69.SOUTH KOREA BIOTIN SUPPLEMENTS MARKET, BY PRODUCT FORM, 2021–2031 ($MILLION)177
TABLE 70.SOUTH KOREA BIOTIN SUPPLEMENTS MARKET, BY DISTRIBUTIONAL CHANNEL, 2021–2031 ($MILLION)178
TABLE 71.SOUTH KOREA BIOTIN SUPPLEMENTS MARKET, BY APPLICATION, 2021–2031 ($MILLION)179
TABLE 72.AUSTRALIA BIOTIN SUPPLEMENTS MARKET, BY PRODUCT FORM, 2021–2031 ($MILLION)181
TABLE 73.AUSTRALIA BIOTIN SUPPLEMENTS MARKET, BY DISTRIBUTIONAL CHANNEL, 2021–2031 ($MILLION)182
TABLE 74.AUSTRALIA BIOTIN SUPPLEMENTS MARKET, BY APPLICATION, 2021–2031 ($MILLION)183
TABLE 75.THAILAND BIOTIN SUPPLEMENTS MARKET, BY PRODUCT FORM, 2021–2031 ($MILLION)185
TABLE 76.THAILAND BIOTIN SUPPLEMENTS MARKET, BY DISTRIBUTIONAL CHANNEL, 2021–2031 ($MILLION)186
TABLE 77.THAILAND BIOTIN SUPPLEMENTS MARKET, BY APPLICATION, 2021–2031 ($MILLION)187
TABLE 78.REST OF ASIA-PACIFIC BIOTIN SUPPLEMENTS MARKET, BY PRODUCT FORM, 2021–2031 ($MILLION)189
TABLE 79.REST OF ASIA-PACIFIC BIOTIN SUPPLEMENTS MARKET, BY DISTRIBUTIONAL CHANNEL, 2021–2031 ($MILLION)190
TABLE 80.REST OF ASIA-PACIFIC BIOTIN SUPPLEMENTS MARKET, BY APPLICATION, 2021–2031 ($MILLION)191
TABLE 81.LAMEA BIOTIN SUPPLEMENTS MARKET, BY PRODUCT FORM, 2021–2031 ($MILLION)193
TABLE 82.LAMEA BIOTIN SUPPLEMENTS MARKET, BY DISTRIBUTIONAL CHANNEL, 2021–2031 ($MILLION)194
TABLE 83.LAMEA BIOTIN SUPPLEMENTS MARKET, BY APPLICATION, 2021–2031 ($MILLION)195
TABLE 84.LAMEA BIOTIN SUPPLEMENTS MARKET, BY COUNTRY, 2021–2031 ($MILLION)196
TABLE 85.BRAZIL BIOTIN SUPPLEMENTS MARKET, BY PRODUCT FORM, 2021–2031 ($MILLION)198
TABLE 86.BRAZIL BIOTIN SUPPLEMENTS MARKET, BY DISTRIBUTIONAL CHANNEL, 2021–2031 ($MILLION)199
TABLE 87.BRAZIL BIOTIN SUPPLEMENTS MARKET, BY APPLICATION, 2021–2031 ($MILLION)200
TABLE 88.SOUTH AFRICA BIOTIN SUPPLEMENTS MARKET, BY PRODUCT FORM, 2021–2031 ($MILLION)202
TABLE 89.SOUTH AFRICA BIOTIN SUPPLEMENTS MARKET, BY DISTRIBUTIONAL CHANNEL, 2021–2031 ($MILLION)203
TABLE 90.SOUTH AFRICA BIOTIN SUPPLEMENTS MARKET, BY APPLICATION, 2021–2031 ($MILLION)204
TABLE 91.SAUDI ARABIA BIOTIN SUPPLEMENTS MARKET, BY PRODUCT FORM, 2021–2031 ($MILLION)206
TABLE 92.SAUDI ARABIA BIOTIN SUPPLEMENTS MARKET, BY DISTRIBUTIONAL CHANNEL, 2021–2031 ($MILLION)207
TABLE 93.SAUDI ARABIA BIOTIN SUPPLEMENTS MARKET, BY APPLICATION, 2021–2031 ($MILLION)208
TABLE 94.UAE BIOTIN SUPPLEMENTS MARKET, BY PRODUCT FORM, 2021–2031 ($MILLION)210
TABLE 95.UAE BIOTIN SUPPLEMENTS MARKET, BY DISTRIBUTIONAL CHANNEL, 2021–2031 ($MILLION)211
TABLE 96.UAE BIOTIN SUPPLEMENTS MARKET, BY APPLICATION, 2021–2031 ($MILLION)212
TABLE 97.REST OF LAMEA BIOTIN SUPPLEMENTS MARKET, BY PRODUCT FORM, 2021–2031 ($MILLION)214
TABLE 98.REST OF LAMEA BIOTIN SUPPLEMENTS MARKET, BY DISTRIBUTIONAL CHANNEL, 2021–2031 ($MILLION)215
TABLE 99.REST OF LAMEA BIOTIN SUPPLEMENTS MARKET, BY APPLICATION, 2021–2031 ($MILLION)216
TABLE 100.CHURCH AND DWIGHT CO., INC. PRODUCT SEGMENTS229
TABLE 101.NESTLE S.A. PRODUCT SEGMENTS234
TABLE 102.NUTRACEUTICAL CORPORATION PRODUCT SEGMENTS240
TABLE 103.VYTALOGY WELLNESS, L.L.C. PRODUCT SEGMENTS242
TABLE 104.DOCTOR'S BEST, INC. PRODUCT SEGMENTS245
TABLE 105.ZENWISE, LLC PRODUCT SEGMENTS247
TABLE 106.SBR NUTRITION PRODUCT SEGMENTS249
TABLE 107.SPORTS RESEARCH CORPORATION PRODUCT SEGMENTS251
TABLE 108.NOW HEALTH GROUP, INC. PRODUCT SEGMENTS253
TABLE 109.LIFE EXTENSION PRODUCT SEGMENTS255
TABLE 110.DESIGNS FOR HEALTH, INC. PRODUCT SEGMENTS257
TABLE 111.SOLAGARDEN NATURALS PRODUCT SEGMENTS259

LIST OF FIGURES

FIGURE 01.BIOTIN SUPPLEMENTS MARKET SNAPSHOT46
FIGURE 02.BIOTIN SUPPLEMENTS MARKET SEGMENTATION49
FIGURE 03.TOP INVESTMENT POCKETS, 2021–203150
FIGURE 04.MODERATE BARGAINING POWER OF SUPPLIERS51
FIGURE 05.MODERATE BARGAINING POWER OF BUYERS52
FIGURE 06.HIGH THREAT OF NEW ENTRANTS53
FIGURE 07.LOW THREAT OF SUBSTITUTION54
FIGURE 08.MODERATE INTENSITY OF COMPETITIVE RIVALRY55
FIGURE 09.BIOTIN SUPPLEMENTS MARKET: DRIVERS, RESTRAINTS, AND OPPORTUNITIES, 2021–203156
FIGURE 10.MARKET SHARE ANALYSIS, BY PRODUCT FORM, 2021 & 2031 (%)61
FIGURE 11.MARKET SHARE ANALYSIS, BY DISTRIBUTIONAL CHANNEL, 2021 & 2031 (%)62
FIGURE 12.MARKET SHARE ANALYSIS, BY APPLICATION, 2021 & 2031 (%)63
FIGURE 13.MARKET SHARE ANALYSIS, BY REGION, 2021 & 2031 (%)64
FIGURE 14.BIOTIN SUPPLEMENTS MARKET, BY PRODUCT FORM, 2021 (%)66
FIGURE 15.COMPARATIVE SHARE ANALYSIS OF BIOTIN SUPPLEMENTS MARKET FOR CAPSULE, BY COUNTRY, 2021 & 2031 (%)70
FIGURE 16.COMPARATIVE SHARE ANALYSIS OF BIOTIN SUPPLEMENTS MARKET FOR TABLET, BY COUNTRY, 2021 & 2031 (%)72
FIGURE 17.COMPARATIVE SHARE ANALYSIS OF BIOTIN SUPPLEMENTS MARKET FOR GEL, BY COUNTRY, 
2021 & 2031 (%)75
FIGURE 18.COMPARATIVE SHARE ANALYSIS OF BIOTIN SUPPLEMENTS MARKET FOR LIQUID, BY COUNTRY, 2021 & 2031 (%)77
FIGURE 19.COMPARATIVE SHARE ANALYSIS OF BIOTIN SUPPLEMENTS MARKET FOR GUMMIES, BY COUNTRY, 2021 & 2031 (%)80
FIGURE 20.COMPARATIVE SHARE ANALYSIS OF BIOTIN SUPPLEMENTS MARKET FOR POWDERS, BY COUNTRY, 2021 & 2031 (%)82
FIGURE 21.BIOTIN SUPPLEMENTS MARKET, BY DISTRIBUTIONAL CHANNEL, 2021 (%)83
FIGURE 22.COMPARATIVE SHARE ANALYSIS OF BIOTIN SUPPLEMENTS MARKET FOR SUPERMARKETS/HYPERMARKETS,  BY COUNTRY, 2021 & 2031 (%)88
FIGURE 23.90
FIGURE 24.COMPARATIVE SHARE ANALYSIS OF BIOTIN SUPPLEMENTS MARKET FOR SPECIALTY STORES, 
BY COUNTRY,  2021 & 2031 (%)91
FIGURE 25.COMPARATIVE SHARE ANALYSIS OF BIOTIN SUPPLEMENTS MARKET FOR E-COMMERCE, 
BY COUNTRY,  2021 & 2031 (%)94
FIGURE 26.BIOTIN SUPPLEMENTS MARKET, BY APPLICATION, 2021 (%)95
FIGURE 27.COMPARATIVE SHARE ANALYSIS OF BIOTIN SUPPLEMENTS MARKET FOR PHARMACEUTICAL, 
BY COUNTRY,  2021 & 2031 (%)98
FIGURE 28.COMPARATIVE SHARE ANALYSIS OF BIOTIN SUPPLEMENTS MARKET FOR SKIN CARE, BY COUNTRY, 2021 & 2031 (%)101
FIGURE 29.COMPARATIVE SHARE ANALYSIS OF BIOTIN SUPPLEMENTS MARKET FOR HAIR CARE, BY COUNTRY, 2021 & 2031 (%)103
FIGURE 30.COMPARATIVE SHARE ANALYSIS OF BIOTIN SUPPLEMENTS MARKET FOR NAIL CARE, BY COUNTRY, 2021 & 2031 (%)106
FIGURE 31.BIOTIN SUPPLEMENTS MARKET, BY REGION, 2021 (%)107
FIGURE 32.U.S. BIOTIN SUPPLEMENTS MARKET, 2021–2031 ($MILLION)114
FIGURE 33.CANADA BIOTIN SUPPLEMENTS MARKET, 2021–2031 ($MILLION)118
FIGURE 34.MEXICO BIOTIN SUPPLEMENTS MARKET, 2021–2031 ($MILLION)122
FIGURE 35.GERMANY BIOTIN SUPPLEMENTS MARKET, 2021–2031 ($MILLION)131
FIGURE 36.FRANCE BIOTIN SUPPLEMENTS MARKET, 2021–2031 ($MILLION)135
FIGURE 37.UK BIOTIN SUPPLEMENTS MARKET, 2021–2031 ($MILLION)139
FIGURE 38.ITALY BIOTIN SUPPLEMENTS MARKET, 2021–2031 ($MILLION)143
FIGURE 39.SPAIN BIOTIN SUPPLEMENTS MARKET, 2021–2031 ($MILLION)147
FIGURE 40.RUSSIA BIOTIN SUPPLEMENTS MARKET, 2021–2031 ($MILLION)151
FIGURE 41.REST OF EUROPE BIOTIN SUPPLEMENTS MARKET, 2021–2031 ($MILLION)155
FIGURE 42.CHINA BIOTIN SUPPLEMENTS MARKET, 2021–2031 ($MILLION)164
FIGURE 43.JAPAN BIOTIN SUPPLEMENTS MARKET, 2021–2031 ($MILLION)168
FIGURE 44.INDIA BIOTIN SUPPLEMENTS MARKET, 2021–2031 ($MILLION)172
FIGURE 45.SOUTH KOREA BIOTIN SUPPLEMENTS MARKET, 2021–2031 ($MILLION)176
FIGURE 46.AUSTRALIA BIOTIN SUPPLEMENTS MARKET, 2021–2031 ($MILLION)180
FIGURE 47.THAILAND BIOTIN SUPPLEMENTS MARKET, 2021–2031 ($MILLION)184
FIGURE 48.REST OF ASIA-PACIFIC BIOTIN SUPPLEMENTS MARKET, 2021–2031 ($MILLION)188
FIGURE 49.BRAZIL BIOTIN SUPPLEMENTS MARKET, 2021–2031 ($MILLION)197
FIGURE 50.SOUTH AFRICA BIOTIN SUPPLEMENTS MARKET, 2021–2031 ($MILLION)201
FIGURE 51.SAUDI ARABIA BIOTIN SUPPLEMENTS MARKET, 2021–2031 ($MILLION)205
FIGURE 52.UAE BIOTIN SUPPLEMENTS MARKET, 2021–2031 ($MILLION)209
FIGURE 53.REST OF LAMEA BIOTIN SUPPLEMENTS MARKET, 2021–2031 ($MILLION)213
FIGURE 54.COMPETITIVE DASHBOARD OF TOP 12 KEY PLAYERS218
FIGURE 55.COMPETITIVE HEATMAP OF TOP 12 KEY PLAYERS220
FIGURE 56.PRODUCT MAPPING OF TOP 12 KEY PLAYERS221
FIGURE 57.TOP WINNING STRATEGIES, BY YEAR, 2019–2022223
FIGURE 58.TOP WINNING STRATEGIES, BY DEVELOPMENT, 2019–2022 (%)224
FIGURE 59.TOP WINNING STRATEGIES, BY COMPANY, 2019–2022225
FIGURE 60.PLAYER POSITIONING OF TOP 10 KEY PLAYERS227
FIGURE 61.CHURCH AND DWIGHT CO., INC.: NET SALES, 2019-2021 ($MILLION)230
FIGURE 62.CHURCH AND DWIGHT CO., INC.: RESEARCH AND DEVELOPMENT EXPENDITURE, 2019-2021231
FIGURE 63.CHURCH AND DWIGHT CO., INC.: REVENUE SHARE BY SEGMENT, 2021 (%)232
FIGURE 64.NESTLE S.A.: NET REVENUE, 2019-2021 ($MILLION)235
FIGURE 65.NESTLE S.A.: RESEARCH AND DEVELOPMENT EXPENDITURE, 2019-2021236
FIGURE 66.NESTLE S.A.: REVENUE SHARE BY SEGMENT, 2021 (%)237
FIGURE 67.NESTLE S.A.: REVENUE SHARE BY REGION, 2021 (%)237


According to the CXO, the factors such as an increase in awareness regarding biotin supplement advantages, and increased preference regarding vitamins in daily diet are expected to propel the growth of the market. However, interference of biotin with certain lab tests and stringent regulatory structure & intervention is expected to hamper the market growth during the forecast period. CXOs further added, the rise in the number of alcoholic people is expected to create an opportunity for the growth of the market. Biosyntia a manufacturer of biotin introduced the world’s first natural and sustainable biotin from the fermentation process. Thus, rise in the number of alcoholic people and increase in innovations by the manufacturers are expected to drive the growth of the biotin supplements market. Conversely, an increase in R&D activities in the field of the biotin supplements market is expected to provide substantial growth opportunities for the industry players in the near future

PURCHASE OPTIONS

Call or Email us

U.S.-Canada Toll-free: +1-800-792-5285
Int'l : +1-503-894-6022
Europe : +44-845-528-1300
Email : help@alliedmarketresearch.com
 
FREQUENTLY ASKED QUESTIONS?

A. The biotin supplement market was valued at $583.4 million in 2021 and is projected to reach $1,410.9 million by 2031.

A. Rise in awareness regarding biotin supplements, increased healthcare cost, rise in number of online pharmacies, and increase in demand for organic food are some of the key trends in biotin supplements market.

A. Capsule is the leading form of biotin supplements market.

A. Asia-Pacific is the largest regional market for biotin supplements.

A. Church & Dwight Co. Inc.,, Designs for Health, Inc., Doctor's Best Inc., LIfe Extension, Nestle S.A., Neutraceutical Corporation, NOW Health Group, Inc., SBR Nutrition, SolaGarden Naturals, Sports Reseach Corporation, Vytalogy Wellness, L.L..C., and Zenwise, LLC are the top companies in biotin supplements market.

Looking for Customization?

 Customization Request

Have a Question?

 Speak with Analyst

Any Confusion?

 Inquire Before Buying

Have a glance of the Report

  Request Sample
RELATED TAGS

Purchase Full Report of
Biotin Supplement Market

Start reading instantly.
This Report and over 67,071+ more Reports, Available with Avenue Library. T&C*.

  • Online Only
  • $3,570
  • Online cloud access only
  • Restricted print, copy, paste & download
  • Read only
  • Free industry update
    (Within 180 days)
  • Free report update in next update cycle
    (Feb 2024 - Feb 2025)
  • Data Pack
  • $3,840
  • Restricted to one authorized user
  • One print only
  • Available in
    Excel
  • Free industry update
    (Within 180 days)
  •   Free report update in next update cycle
    (Feb 2024 - Feb 2025)
  • Single User
  • $5,730
  • Restricted to one authorized user
  • One print only
  • Available in
    PDF
  • Free industry update
    (Within 180 days)
  •   Free report update in next update cycle
    (Feb 2024 - Feb 2025)
  • Five Users
  • $6,450
  • Limited to five authorized users
  • Print upto five copies
  • Available in
    PDF
  • Free industry update
    (Within 180 days)
  •   Free report update in next update cycle
    (Feb 2024 - Feb 2025)
  • Enterprise
    License/PDF

  • $9,600
  • Unlimited
    within
    company/enterprise
  • Available in Excel & PDF
  • Free industry update
    (Within 180 days)
  •   Free report update in next update cycle
    (Feb 2024 - Feb 2025)
  • Library
    Membership

  • $999 $ 1,175
    Per User/ Per month/ Billed annually
  • Published Content
    E-access
  • Company Profiles
    E-access
  • Newly Added Content Access
  • 10 PDF
    Downloads
  • 5 Excel Data
    Pack Downloads
  • 250 Company Profiles PDF Downloads
  • Buy Now

*Taxes/Fees, if applicable will be added during checkout. All prices in USD

RELATED REPORTS
 

Why Allied Market Research?


Infallible Methodology

To ensure high-level data integrity, accurate analysis, and impeccable forecasts

Analyst Support

For complete satisfaction

Customization

On-demand customization of scope of the report to exactly meet your needs

TARGETED MARKET VIEW

Targeted market view to provide pertinent information and save time of readers

Get fresh content delivered

Get insights on topics that are crucial for your business. Stay abreast of your interest areas.

Get Industry Data Alerts

Why Allied Market Research?

Infallible Methodology

To ensure high-level data integrity, accurate analysis, and impeccable forecasts

Analyst Support

For complete satisfaction

Customization

On-demand customization of scope of the report to exactly meet your needs

TARGETED MARKET VIEW

Targeted market view to provide pertinent information and save time of readers