
Collagen Supplement Market Research, 2027
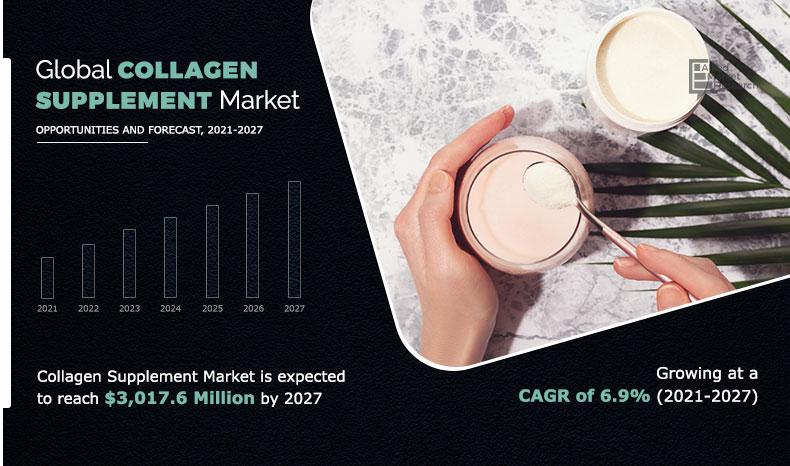
The global collagen supplement market size was valued at $1,827.6 million in 2019, and is projected to reach $3,017.6 million by 2027, registering a CAGR of 6.9%. North America was the highest revenue contributor, accounting for the highest market share in 2019, and is estimated to grow at a CAGR of 7.1%. The U.S. was the leading country in terms of collagen supplement consumption, and is expected to continue this trend over the forecast period.
Collagen supplement are dietary supplements that are used to address the deficiency of collagen in the diet. They are usually derived from bones and skin of animals and fish. They come in a variety of forms, including pills, gummies, powder, and drinks. Collagen supplements are available across the world and can be consumed without the prescription of a medical practitioner. Collagen supplements are very popular among bodybuilders and regular fitness enthusiasts as they help them maintain the health of their skin and bones.
Market Dynamics
The demand for collagen supplement has remained consistent among buyers. The outbreak of the novel coronavirus has marginally affected the growth of the market worldwide. Slight decrease has been witnessed in the sale of collagen supplement due to slowdown in the production as a result of implementation of lockdown. Furthermore, the disruption of supply chain has slightly affected the supply of the product to the global market.
The growth of the market can be attributed to several health and beauty benefits associated with the ingestion of collagen supplement. For instance, the ingestion of collagen supplement enhances the health of skin by reducing dryness and wrinkles. It also increases muscle mass, improves bone health, and provides relief from joint pain. Moreover, rise in diseases, such as arthritis, rheumatoid arthritis, and other inflammatory bone diseases, has encouraged consumers/people to inculcate special supplements to keep themselves agile. Moreover, easy availability of supplements due to improvement in the retail infrastructure has been beneficial to the sales of nutraceuticals such as collagen supplement. However, high cost of collagen supplement and growing adoption of veganism act as the major restraint for the collagen supplement market growth. On the contrary, growing awareness about the beneficial effects of collagen supplement in the untapped regions, such as Asia-Pacific and LAMEA, is expected to provide growth opportunities for the global market.
Segments Overview
The collagen supplement market has been segmented based on source, form, sales channel, and region. On the basis of source, the market is divided into marine & poultry, porcine, and bovine. On the basis of form, it is fragmented into pills & gummies, powder, and liquid/drinks. Based on sales channel, it is classified into pharmacy, specialty store, and online store. Furthermore, it includes the revenue generated from the sales of food collagen supplement across North America (the U.S., Canada, Mexico), Europe (Germany, the UK, France, Italy, Spain, and the rest of Europe), Asia-Pacific (China, India, Japan, Australia, South Korea, and the rest of Asia-Pacific), and LAMEA (Latin America, Africa, and the rest of LAMEA).
By Source
Global Collagen Supplements Market by Source, 2019-2027, ($Million)
Based on collagen supplement market analysis by source, the bovine segment was the largest segment in 2019, and is expected to remain dominant during the forecast period. The growth of this segment is attributed to collagen supplement being very popular among bodybuilders and athletes. However, the marine & poultry segment is projected to grow at the fastest CAGR of 7.1% over the forecast period.
By Form
Global Collagen Supplements Market by Form, 2019-2027, ($Million)
Based collagen supplement market forecast by form, the pills & gummies segment was the largest & the fastest-growing segment in 2019, and is expected to remain dominant over the forecast period. The growth of this segment is attributed to an increase in the demand and consumption of dietary supplements that come in the form of pills and gummies, owing to rise in health concerns among consumers. Furthermore, increase in inclination of consumers toward the consumption of dietary supplement to aid recovery after exercise and help in the growth of muscles is expected to fuel the growth of the pills & gummies segment in future.
By Sales Channel
Global Collagen Supplements Market by Sales Channel, 2019-2027, ($Million)
Based on sales channel, the pharmacy segment in the collagen supplement market was the largest segment in 2019, and is expected to remain dominant over the forecast period. The growth of this segment can be attributed to pharmacies being often considered as a much more trusted source to acquire medication and supplementation. Moreover, services, such as home delivery through mails and consultations with the pharmacists, further boost the segment growth. However, the online segment is projected to grow at the fastest CAGR of 7.5% over the forecast period.
By Region
Global Collagen Supplements Market by Region, 2019-2027, ($Million)
Region-wise, North America was the largest market in 2019, in terms of revenue generation, garnering almost one-third of the global collagen supplement market share. The U.S. is further expected to expand at a notable growth rate exhibiting the highest share over the forecast period. However, Asia-Pacific and LAMEA regions in the market are expected to witness notable growth during the forecast period. The market growth in these regions can be attributed to increase in adoption of healthy food & supplements.
Competitive Analysis
Key players in the collagen supplement market have relied on strategies, such as innovation and business expansion, to expand their market share and to stay competitive in the global market. The key players in the collagen supplement industry report include Optimum Nutrition, Inc, BIoTechUSA, TCI CO., LTD., Further Food, Vital Proteins LLC, Hunter&Gather, Shiseido Co. Ltd, The Clorox Company, Nature's Bounty Co., and Codeage LLC.
Key Benefits For Stakeholders
- The report provides a quantitative analysis of the current collagen supplement market trends, estimations, and dynamics of the market from 2019 to 2027 to identify the prevailing opportunities.
- Porter’s five forces analysis highlights the potency of the buyers and suppliers to enable stakeholders to make profit-oriented business decisions and strengthen their supplier–buyer network.
- In-depth analysis and the market size & segmentation assist to determine the prevailing collagen supplement market opportunities.
- The major countries in each region are mapped according to their revenue contribution to the market.
- The market player positioning facilitates benchmarking and provides a clear understanding of the present position of the market players in the market.
Collagen Supplement Market Report Highlights
| Aspects | Details |
| By Source |
|
| By Form |
|
| By Sales Channel |
|
| By Region |
|
| Key Market Players | TCI CO., LTD., THE BOUNTIFUL COMPANY, BIOTECH USA, CODEAGE LLC, THE CLOROX COMPANY, VITAL PROTEINS, LLC, HUNTER & GATHER FOODS LTD, SHISEIDO COMPANY, LIMITED, FURTHER FOOD, GLANBIA PLC |
Analyst Review
According to the CXOs of leading companies, changing lifestyle and rise in concern regarding health and beauty are encouraging consumers to seek for non-invasive and effective solutions. Therefore, they are investing in R&D activities and making continuous effort in launching new improved ingredients for nutraceuticals producers to help them in meeting the rising global demand for improved nutritional supplements. This factor promotes the use of collagen supplements in the nutraceuticals sector. The key market players in this market adopted new product launch and innovation as their key developmental strategies to fulfill the rise in demand from the final product manufacturers. According to them, rise in trend of using ingestible beauty products due to increase in concern regarding the appearance among consumers as well as consumers gaining confidence on the proven benefits of nutritional supplements is expected to fuel the demand for collagen supplements. However, the growing trend of veganism and high price of collagen supplements are expected to hamper the growth of the collagen supplement market in future.
The global collagen supplement market was valued at $1,827.6 million in 2019, and is projected to reach $3,017.6 million by 2027.
The global Collagen supplement market is projected to grow at a compound annual growth rate of 6.9% from 2021 to 2027 $3,017.6 million by 2027.
The key leading players operating in this collagen supplement market include Optimum Nutrition, Inc, BIoTechUSA, TCI CO., LTD., Further Food, Vital Proteins LLC, Hunter&Gather, Shiseido Co. Ltd, The Clorox Company, Nature's Bounty Co., and Codeage LLC.
North America dominated the market in 2019.
Health & Beauty Benefits, Preventive Health Trends, Improved Retail Infrastructure, Emerging Market Potential.
Loading Table Of Content...

