
Genotyping Market Summary, 2033
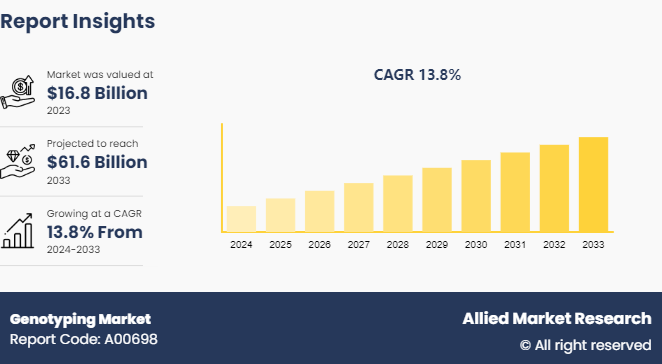
The global genotyping market size was valued at $16.8 billion in 2023, and is projected to reach $61.6 Billion by 2033, growing at a CAGR of 13.8% from 2024 to 2033. Rise in prevalence of genetic disorders, increase in demand for personalized medicine, and advances in technology, such as next-generation sequencing and polymerase chain reaction are the major factors which drive the market growth.
Market Introduction and Definition
Genotyping is the process of determining the genetic makeup of an individual by examining DNA sequence using biological assays. It identifies the variations in the genetic code (genotypes) of an organism, focusing on specific genes to understand the genetic differences that may contribute to traits, diseases, or responses to medications. Techniques used for genotyping include polymerase chain reaction, DNA sequencing, microarrays, and next-generation sequencing. In agriculture and animal breeding, it helps in selecting traits for improved yield or resistance to diseases.
Genotyping refers to the process of determining differences in the genetic make-up of an organism. This is done by examining its genes or by sequencing its DNA. Genotyping helps identify specific genetic variations, known as alleles, within a genome of an individuals. This helps determine the influence of these variations on health, disease predisposition, and drug response. It helps provide precise information about the genetic code of an individual at specific locations.
Genotyping is majorly used in clinical diagnostics. Physicians use genotyping tests to identify genetic markers associated with various diseases. Similarly, genotyping assays are used for diagnosing inherited conditions like cystic fibrosis and sickle cell disease, where specific gene variants directly inform clinical management. Further, it is also used in pharmacogenomics, which studies the response of genes of a person to drugs. Genotyping personalized medication plans helps clinicians select the right drug and dosage, reducing trial-and-error prescribing and improving patient safety.
Key Takeaways
- The genotyping market share study covers 20 countries. The research includes a segment analysis of each country in terms of value for the projected period.
- More than 1, 500 product literatures, industry releases, annual reports, and other such documents of major genotyping industry participants along with authentic industry journals, trade associations' releases, and government websites have been reviewed for generating high-value industry insights.
- The study integrated high-quality data, professional opinions and analysis, and critical independent perspectives. The research approach is intended to provide a balanced view of global genotyping market and to assist stakeholders in making educated decisions in order to achieve their most ambitious growth objectives.
Key Market Dynamics
The genotyping market is evolving rapidly, supported by scientific innovation, increase in clinical adoption, and surge in consumer interest in genetic information.
Drivers
Global shift toward precision medicine is one of the major factors driving the growth of the genotyping market. Healthcare systems are moving from generalized treatment models to individualized care based on genetic profiles. Genotyping enables accurate diagnoses, better therapeutic outcomes, and reduced adverse reactions by identifying gene variants that influence disease risk or drug response. This aligns with value-based care models that prioritize effectiveness and efficiency. Further, government agencies, research institutions, and biopharmaceutical companies are investing in genetic research. Large-scale initiatives, such as population genomics projects, accelerate discovery of disease-linked genetic markers. These efforts depend on high-throughput genotyping technologies that can process thousands of samples efficiently. Also, healthcare providers use genotyping to understand patient risk profiles, facilitate early detection, and guide preventive interventions.
Innovations in next-generation sequencing, microarrays, and PCR-based genotyping assays help improve speed, accuracy, and throughput. These technologies help reduce costs and expand accessibility, enabling both clinical and research laboratories to adopt genotyping.
Opportunities
Integration of genotyping with digital health platforms and artificial intelligence enhances predictive analytics, disease modeling, and personalized recommendations. Moreover, there is a rise in focus on preventive care globally. Early risk identification via genotyping supports preventive strategies and lifestyle recommendations. This creates demand within both clinical and wellness markets. These factors are anticipatefd to boost the growth of the genotyping market during the forecast period.
Restraints
Genetic data is highly sensitive. Consumers and healthcare organizations are, thus, concerned about data privacy, potential misuse, and unauthorized access. This limits the demand for genotyping across the healthcare sector. Further, initial investment in genotyping technology, infrastructure, and skilled personnel remains substantial for smaller laboratories and healthcare facilities. Also, effective genotyping requires multidisciplinary expertise spanning molecular biology, genetics, data science, and bioinformatics.
Market Segmentation
The genotyping market is segmented into product, technology, application, end user, and region. On the basis of product, the market is categorized into instruments, reagents & kits, and software and services. As per technology, the market is divided into PCR, capillary electrophoresis, microarrays, sequencing, mass spectrometry, and others. On the basis of application, the market is classified into pharmacogenomics, diagnostics and personalized medicine, agricultural biotechnology, animal genetics, and others. On the basis of end user, the genotyping market is classified into pharmaceutical and biopharmaceutical companies, diagnostics and research laboratories, and others. Region wise, it is analyzed across North America, Europe, Asia-Pacific, and LAMEA.
Regional/Country Market Outlook
North America leads the genotyping market share due to extensive research activities, advanced healthcare infrastructure, and strong government support for genetic studies. Europe follows suit with significant investments in genomics research and well-established biotechnology sectors. Asia-Pacific emerges as a rapidly growing genotyping market, fueled by increasing awareness of personalized medicine, expanding healthcare expenditure, and rising genetic research initiatives. Moreover, LAMEA exhibits untapped potential, driven by growing healthcare investments and the adoption of genomics technologies for disease diagnosis and treatment.
According to the Centers for Disease Control and Prevention (CDC) , the percentage of clustered genotyped TB cases during 2020–2022 based on whole-genome sequencing methods was 16.9%, lower than the 19.2% clustering during 2019–2021 based on conventional genotyping methods.
An article published by National Center for Biotechnology and Information (NCBI) in 2022, a study on the pharmacogenomic landscape of the Indian population utilized whole genome sequencing data from 1, 029 unrelated Indian individuals. This study provided insights into genetic variations that could optimize drug treatments for the Indian population, emphasizing the importance of personalized medicine based on genomic data. These initiatives in India reflect a growing emphasis on genotyping and population genomics to enhance public health interventions, drug development, and personalized medicine tailored to the genetic diversity of different populations.
Industry Trends
- The Centers for Disease Control and Prevention (CDC) reported a genotype surveillance coverage of 96.0% in 2022 for culture-positive TB cases, using whole-genome multilocus sequence typing to analyze genetic material of Mycobacterium tuberculosis.
- According to a Department of Biotechnology Ministry of Science and Technology, Government of India in 2022, India made significant strides in genotyping and population genomics through the GenomeIndia project. This national initiative, funded by the Department of Biotechnology, Ministry of Science and Technology, sequenced the whole genomes of 10, 074 individuals from 99 communities, representing diverse Indian populations. The project aimed to identify and catalogue genetic variations across major ethnic groups in India, laying the foundation for personalized medicine and better understanding of diseases among different ethnicities.
Who Are the Primary End Users Driving Market Adoption?
The genotyping market is driven by several primary end users. Hospitals and diagnostic laboratories represent a major end-user segment. These institutions use genotyping for disease diagnosis, risk assessment, and treatment selection. Clinical laboratories increasingly incorporate genotyping assays into routine diagnostic workflows to improve patient outcomes and reduce trial-and-error treatment approaches. Pharmaceutical and biotechnology companies are key drivers of genotyping market adoption. Genotyping plays a critical role in drug discovery and development by identifying genetic biomarkers associated with disease progression and drug response. Pharmaceutical firms use genotyping to stratify patients in clinical trials, ensuring that therapies are tested on genetically suitable populations. This approach enhances trial efficiency and supports regulatory approval for personalized medicines.
Academic and research institutions contribute significantly to genotyping market demand. Universities and genomics research centers conduct large-scale studies to explore genetic variations linked to complex diseases. These institutions require advanced genotyping platforms, reagents, and bioinformatics tools. Government grants and public funding often support such research activities, further strengthening adoption. In addition, agricultural and animal research sectors use genotyping for crop improvement and livestock breeding programs. Public health agencies also use genotyping for epidemiological studies and disease surveillance. Genetic data helps track disease outbreaks and understand hereditary health risks at the population level.
Patent Analysis for the Genotyping Market
According to the World Intellectual Property Organization (WIPO) patent analysis spanning 2022 to 2024, China dominated the global patent landscape with a commanding share of 38.9%, followed by the U.S. at 18.0%. The Patent Cooperation Treaty (PCT) holds a notable 12.1%, while the European Patent Office and the Russian Federation contribute 8.9% and 13.8%, respectively. Other significant players include Denmark, Poland, Republic of Korea, and Mexico holding 1.4% of the total patents. New Zealand accounts for 0.8%. In the genotyping market, this distribution signifies the geographical concentration of innovation and intellectual property in technologies related to genetic analysis. China's substantial share underscores its growing prowess in biotechnology, potentially impacting genotyping technologies' development and commercialization globally. The U.S. remains a significant contributor, reflecting its strong research and development ecosystem in this field.
How Are Consumer Preferences Shaping Market Trends?
Consumer preferences play an important role in shaping trends within the genotyping market. One major trend influenced by consumer preference is the rise of direct-to-consumer genetic testing. Consumers are interested in learning about ancestry, inherited health risks, and lifestyle-related genetic traits. This interest has expanded the market beyond traditional clinical settings and introduced genotyping services to a broader audience. Consumers are also demanding faster turnaround times and affordable testing options. Advancements in sequencing technology and automation have reduced costs and processing times, making genotyping accessible. Companies that provide convenient sample collection kits, digital reports, and user-friendly platforms are gaining competitive advantages.
Another emerging trend is the preference for personalized healthcare solutions. Patients increasingly expect treatments tailored to their genetic profiles. This demand supports the integration of genotyping into routine medical practice, particularly in oncology and pharmacogenomics. Data privacy and security have also become important consumer considerations. In addition, there is growing interest in preventive healthcare. Consumers are seeking genetic insights to manage long-term health risks proactively. This trend supports expansion in predictive and preventive genetic testing services.
Digital integration is another preference shaping the genotyping market growth. Consumers favor platforms that provide easy access to genetic reports, teleconsultations, and ongoing health monitoring. Integration with mobile apps and digital health ecosystems enhances engagement and satisfaction.

Competitive Landscape
The major players operating in the genotyping market include Illumina, Inc., Thermo Fisher Scientific Inc., QIAGEN, F. Hoffmann-La Roche Ltd, Danaher Corporation, Agilent Technologies, Inc, Eurofins Genomics LLC, Bio-Rad Laboratories, Inc., PacBio, and Integrated DNA Technologies, Inc. Other players in genotyping market include Promega Corporation, Agena Bioscience, Inc., and so on.
Who Are the Key Players in the Market and What Are Their Strategies?
Key players include Illumina, Inc., Thermo Fisher Scientific Inc., QIAGEN, F. Hoffmann-La Roche Ltd, Danaher Corporation, Agilent Technologies, Inc, Eurofins Genomics LLC, Bio-Rad Laboratories, Inc., PacBio, and Integrated DNA Technologies, Inc. These companies collectively hold a significant portion of the genotyping market due to their broad product portfolios, global reach, and ongoing investments in technology development. A central strategy for leading firms is continuous innovation in technology and product offerings. For example, Illumina, a major provider of next-generation sequencing (NGS) and array-based genotyping tools, emphasizes high-throughput platforms and automation solutions that improve data quality and efficiency for clinical and research users. Its products serve large-scale genomic studies and personalized medicine applications. Thermo Fisher Scientific focuses on innovation through product expansion and strategic launches. The company develops advanced genotyping systems, real-time PCR platforms, and integrated bioinformatics tools that support clinical laboratories and biopharmaceutical research. Its strategy includes delivering scalable, high-accuracy genotyping solutions across applications ranging from diagnostics to population genomics.
QIAGEN combines molecular sample preparation with genotyping assays to cater to diagnostic and research workflows. Its strategy emphasizes robust workflows that enhance accuracy and throughput, particularly in infectious disease, oncology, and pharmacogenomics. Similarly, Agilent Technologies leverages its expertise in microarrays, PCR, and sequencing to provide platforms that address both clinical and agricultural genotyping requirements. Other companies such as Danaher and Bio-Rad Laboratories utilize strategic acquisitions and investments to broaden their technology portfolios.
Recent Key Strategies and Development in Genotyping Market
- In August 2022, Thermo Fisher Scientific announced the launch of its Applied Biosystems HIV-1 Genotyping Kit with Integrase, a research use only assay that examines positive samples of human immunodeficiency virus (HIV) to identify genetic variants that resist common antiretroviral therapeutics.
Key Sources Referred
- National Center for Biotechnology and Information (NCBI)
- Centers for Medicare & Medicaid Services (CMS)
- National Health Service (NHS)
- Australian Government Department of Health and Aged Care
- Government of Canada's Health and Wellness
- Ministry of Health and Family Welfare (MoHFW)
- National Health Mission (NHM)
- Ayushman Bharat - Health and Wellness Centres (AB-HWCs)
- Centers for Disease Control and Prevention (CDC)
- Food and Drug Administration (FDA)
- National Institutes of Health (NIH)
- World Health Organization (WHO)
Key Benefits for Stakeholders
- This report provides a quantitative analysis of the market segments, current trends, estimations, and dynamics of the genotyping market analysis from 2024 to 2033 to identify the prevailing market opportunities.
- The genotyping market research is offered along with information related to key drivers, restraints, and opportunities.
- Porter's five forces analysis highlights the potency of buyers and suppliers to enable stakeholders make profit-oriented business decisions and strengthen their supplier-buyer network.
- In-depth analysis of the genotyping market segmentation assists to determine the prevailing market opportunities.
- Major countries in each region are mapped according to their revenue contribution to the global genotyping market.
- Market player positioning facilitates benchmarking and provides a clear understanding of the present position of the genotyping market players.
- The report includes the analysis of the regional as well as global genotyping market trends, key players, market segments, application areas, and genotyping market growth strategies.
Genotyping Market Report Highlights
| Aspects | Details |
| Market Size By 2033 | USD 61.6 Billion |
| Growth Rate | CAGR of 13.8% |
| Forecast period | 2024 - 2033 |
| Report Pages | 231 |
| By Product |
|
| By Technology |
|
| By Application |
|
| By End User |
|
| By Region |
|
| Key Market Players | Illumina, Inc., QIAGEN , PacBio, F. Hoffmann-La Roche Ltd, Agilent Technologies, Inc, Bio-Rad Laboratories, Inc., Danaher Corporation, Integrated DNA Technologies, Inc., Thermo Fisher Scientific Inc., Eurofins Genomics LLC |
Loading Table Of Content...

