
Onion Salt Market Summary
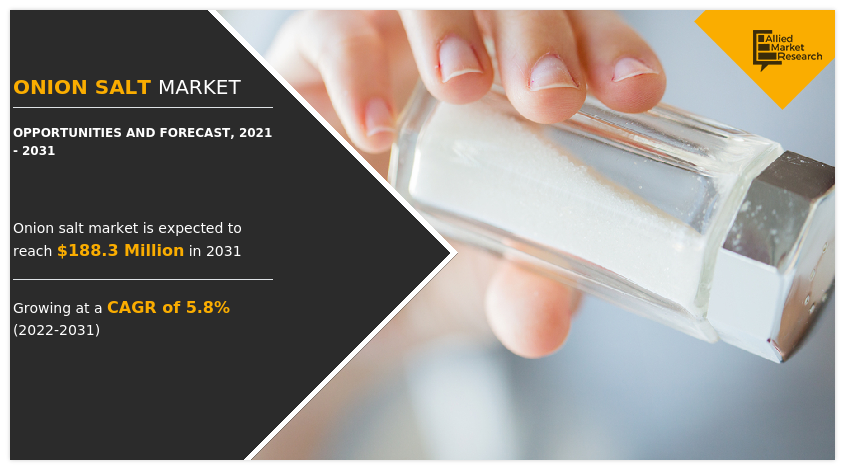
The global onion salt market size was valued at $105.6 million in 2021, and is projected to reach $188.3 million by 2031, growing at a CAGR of 5.8% from 2022 to 2031. Changes in lifestyle of consumers is one of the major factors that has contributed toward growing popularity of onion salt in developing economies.
Key Market Trends and Insights
Region wise, North America generated the highest revenue in 2021.
The global onion salt market share was dominated by the conventional segment in 2021 and is expected to maintain its dominance in the upcoming years
The business to business segment is expected to witness the highest growth during the forecast
Market Size & Forecast
- 2021 Market Size: USD 105.6 Million
- 2031 Projected Market Size: USD 188.3 Million
- Compound Annual Growth Rate (CAGR) (2022-2031): 5.8%
- North America: Generated the highest revenue in 2021
Market Dynamics
The onion salt market is experiencing significant growth, and is projected to grow considerably in the next few years. Onion salt is a commercially-prepared mixture of onion powder and salt that is commonly used as a seasoning agent with meats and vegetables, a primary component of onion salt, is dried onion that is ground to a powder.
Onion salt is one such ingredient which is used as a flavoring agent in food processing industries. Onion salt constitutes of a mixture of dried onion powder and fine table salt. As the name suggests, it provides zesty as well as salty flavor to any dish which reduces the additional utilization of onion flakes. Due to its exotic taste, onion salt is used for culinary purpose throughout North America and parts of Europe over the years. The onion salt market demand dropped down during the COVID-19 pandemic. This is attributed to shutdown of food services, food processing units and supply chain.”
In Asia-Pacific countries, surge in per capita income has led to changing food habits of customers. Rise in aspiration and penchant for luxury lifestyle has led to a manifold increase in market size and overall demand. Moreover, in Latin America and the Middle East, per capita income has increased considerably over a decade, which is expected to rapidly boost the demand for onion salt in upcoming years.
Furthermore, rise in awareness of consumers toward diversified flavor of onion has further encouraged consumers to increase their spending on onion products, which further boosts the growth of the onion salt market. In addition, increase in popularity of onion salt in fast food restaurants, also known as the quick service restaurants (QSRs), boosts the growth of the global onion salt industry. Among the emerging economies, China, India, and Brazil dominate in terms of fast food consumption, owing to their large population base and growth in number of QSRs such as McDonald's, Burger King, Wendy’s, and Subway.
The business of QSR chains in India is expected to grow eight-fold, owing to rise in disposable income and increase in urbanization, thereby, increasing the consumption of fast food which directly contributes to the growth of the onion salt market. According to the India Brand Equity Foundation (IBEF), by 2025, about 530 million people in India are expected to reside in urban areas, which offer an attractive opportunity toward the global QSR chains. Thus, growth in urban population across the globe is expected to present a potential opportunity for the manufacturers of onion salt.
Regulations associated with bakery & confectionery products are related to various factors such as ingredients used in the process, food hygiene labeling & packaging, health claims, and others. For instance, according to the Food and Drug Administration (FDA), regulations about menu labeling insist on providing various information such as nutrition facts, ingredients used, the common name of products, name & address of manufacturers, and others on labels, which are sold in various supermarkets, retail stores, and bakeries. Thus, these regulations regarding various ingredients and the quality of ingredients used in bakery & confectionery products are expected to hamper the market growth.
In addition, owing to high consumption of processed food is casing numerous diseases followed by obesity among the consumers. According to the studies by researchers at NYU School of Global Public Health, consumption of ultra-processed food increased from 53.5% of calories at the start of the study period (2001-2002) to 57% at the end (2017-2018). The consumption of frozen dinners and other ready-to-eat or heat meals rose while that of other sweet food and beverages decreased. As a result of consumers consuming less meat and dairy, the consumption of whole food dropped from 32.7% to 27.4% of calories.
However, there is a rise in the consumption of onion salt owing to the growth of convenience food. Convenience food refer to the products, which require minimal processing and can be prepared easily without much efforts. The preference for on-the-go food products, which are readily available in the market has increased, due to changes in eating habits and busy lifestyle. For instance, the availability of various onion salt flavor in the market to make sandwiches, burger, pizza and other at home easily without much efforts significantly contributes toward the onion salt market growth. Moreover, easy availability of convenience food in online and offline platforms helps in increasing the consumer base for the onion salt industry.
Segment Review
The onion salt market is segmented on the basis of form, end user, sales channel and region. By form, the market is bifurcated into organic and conventional. By end user, the market is divided into residential, food service and food processing. By sales channel, the market is categorized into business-to-business and business-to-consumer. Region-wise, the market is studied across North America, Europe, Asia-Pacific, and LAMEA.

On the basis of form, the organic segment is likely to be the fastest growing segment. This is attributed to the rise in consumer interest towards organic products. Organic is one of the market trends which is common in almost every food and beverage product.

On the basis of end user, the food processing segment has the dominating onion salt market share. This is attributed to rise in consumption of processed food among the population. According to the U.S. Food and Drug Administration, "processed food" encompasses any raw agricultural item that has undergone processing, such as canning, cooking, freezing, dehydrating, or milling.

On the basis of sales channel, the online sales channel is likely to be the fastest growing segment during the onion salt market forecast period. E-commerce or online store is a huge platform growing at a tremendous rate worldwide. Consumers of every age, including generation X, millennial, or generation Z prefer to shop from e-stores. This is attributed to the fact that online shopping is more convenient as compared to shopping at physical stores, due to rise in number of retailers focusing on e-commerce, thus making it convenient for consumers. Furthermore, increase in penetration of internet and rise in percentage of population inclining toward online shopping are expected to provide potential market opportunities to the manufacturers in order to sell their existing as well as novel onion salt products through online platform, thus making them easily available for consumers and increasing consumer awareness about their products.
On the basis of region, North America dominated the global market in 2021. This is attributed to large number of key layers operating in the North America onion salt market which are innovating new products to sustain in the competitive market. They are launching new products to expand their business operations across different countries in the region to increase their customer base. High spending capabilities of individuals, owing to increase in disposable income and economic stability propel growth of the market. In addition, change in lifestyle of individuals also contributes toward increase in sales of onion salt in North America. However, Asia-Pacific and LAMEA is likely to be the fastest growing region during the forecast period.
Rise in population, fast-growing middle-class individuals, improved business regulations, and rise in urbanization are major factors that drive the growth of the onion salt market in these regions. A drastic change in customer lifestyle has been witnessed, owing to high urbanization in Africa. Surge in consciousness regarding onion salt products among individuals has increased the growth of the market in this region. In addition, increase in spending due to considerable rise in disposable incomes in these regions supplements the growth of the market. Moreover, rapid increase of online sales channel further boosts the sales of onion salt.
Competitive Landscape
The key players profiled in the onion salt market report AUM Fresh, B&G Foods, Inc., Badia Spices, Inc., G-Fresh, Hoyts Food Manufacturing Industries Pty Ltd, Leighty's Farm Market, Inc., McCormick & Company, Inc., Monterey Bay Herb Company, Redmond Life, Starlight Herb & Spice Co., The Kroger Co., Trader Joe’s, Urban Platter and Woodland Foods.
Key Benefits For Stakeholders
- This report provides a quantitative analysis of the market segments, current trends, estimations, and dynamics of the onion salt market analysis from 2021 to 2031 to identify the prevailing onion salt market opportunities.
- The market research is offered along with information related to key drivers, restraints, and opportunities.
- Porter's five forces analysis highlights the potency of buyers and suppliers to enable stakeholders make profit-oriented business decisions and strengthen their supplier-buyer network.
- In-depth analysis of the onion salt market segmentation assists to determine the prevailing market opportunities.
- Major countries in each region are mapped according to their revenue contribution to the global market.
- Market player positioning facilitates benchmarking and provides a clear understanding of the present position of the market players.
- The report includes the analysis of the regional as well as global onion salt market trends, key players, market segments, application areas, and market growth strategies.
Onion Salt Market Report Highlights
| Aspects | Details |
| Market Size By 2031 | USD 188.3 million |
| Growth Rate | CAGR of 5.8% |
| Forecast period | 2021 - 2031 |
| Report Pages | 259 |
| By Form |
|
| By End User |
|
| By Sales Channel |
|
| By Region |
|
| Key Market Players | Badia Spices, Inc., woodland foods, Monterey Bay Herb Company, Starlight Herb & Spice Co., McCormick & Company, Inc., Hoyts Food Manufacturing Industries Pty Ltd, AUM Fresh, B&G Foods, Inc., Urban Platter, Trader Joe’s, G-Fresh, Redmond Life, The Kroger Co., Leighty's Farm Market, Inc. |
Analyst Review
According to the insights of the CXOs of leading companies, the onion salt market demand has increased significantly owing to increase in its uses in quick service restaurant industry. Over the past one-decade, globally customers have gradually shifted their diet to fast food and convenience food, specifically in the urban areas which has also resulted in boosting the growth of onion salt market.
Change in food habits and busy lifestyle of consumers have led to increase in demand for fast food. Rapid changes in the supporting factors such as disposable income, consumer preferences, increase in working women population, and digitization have resulted in rise in number of quick-service, pop & shop, and other types of restaurants. This in turn drives the growth of the onion salt market. Factors such as growth of hospitality industry and increase in tourism also support the growth of this market.
Asia-Pacific and Europe are offering incremental growth opportunities for onion salt, and hence the market in the region is anticipated to grow at the highest CAGR. Furthermore, increase in penetration of various online portals globally and rise in number of offers or discounts attract large consumer base to purchase onion salt through online channels. In addition, online sales channel has increased consumer reach, making it key source of revenue for many companies.
The global Onion Salt Market Size was valued at $105.6 million in 2021, and is projected to reach $188.3 million by 2031
The global Onion Salt market is projected to grow at a compound annual growth rate of 5.8% from 2022 to 2031 $188.3 million by 2031
B&G Foods, Inc., G-Fresh, Leighty's Farm Market, Inc., The Kroger Co., McCormick & Company, Inc., Urban Platter, Starlight Herb & Spice Co., woodland foods, Hoyts Food Manufacturing Industries Pty Ltd, Trader Joe’s, Redmond Life, Badia Spices, Inc., AUM Fresh, Monterey Bay Herb Company
On the basis of region, North America dominated the global market in 2021
Increasing prefernce of consumers toward diversified flavors of onion
Loading Table Of Content...

