Report Code: A00614 | Jan 2022 | Pages: 300 | ||
Tables: 143 | Charts: 81 |
|
Pandemic disrupted the entire world and affected many industries.
Get detailed COVID-19 impact analysis on the Sports Nutrition Market
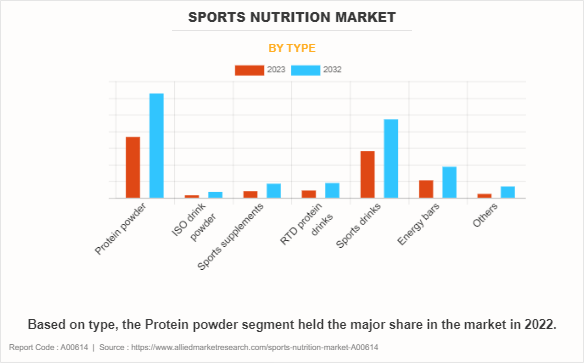
Request Now !The global sports nutrition market size was valued at $34.8 billion in 2020, and is projected reach $67.9 billion by 2030, registering a CAGR of 5.4% from 2021 to 2030. The protein powder segment led in terms of sports nutrition market share in 2020, while the energy bars segment is expected to witness growth with the highest CAGR during the forecast period.
Sports nutrition products are specialized nutrition products that are designed to boost performance and increase recovery speeds during and after sports activities such as athletics, workouts, or bodybuilding.
These products are used before and after physical activity to provide energy during the activity and help recovery post it. The most commonly used forms of sports nutrition products are protein powders and sports drinks. Most sports nutrition products are made with ingredients to boost physical capabilities and energy absorption by the body to gain maximum output from the efforts undertaken by the consumer. Sports nutrition products that contain protein promote building of new muscles in bodybuilders and helps maintain lean muscles in athletes, while products containing minerals, electrolytes, carbohydrates, and other types of nutrients help provide, energy, hydration, and nutrition to the body. A mixture of a variety of sports nutrition products are used by athletes to gain the best possible output and to properly supplement their nutritional needs during strenuous workouts and physical activities.
A lot of protein powders and protein rinks make use of whey protein, which is extracted from milk. This helps to keep the product as natural as possible and to reduce the use of chemical ingredients. The use of organic ingredients in the production of sports nutrition products is gaining high traction in the market as consumers are becoming more concerned with the use of ingredients used in the products. Furthermore, increase in demand from casual consumers, which are not actively engaged in any strenuous physical activities, is further driving market expansion. The demand for energy bars and RTD protein drinks is rapidly increasing among lifestyle users, which is helping the market witness growth. Furthermore, availability of such products is becoming much easier through the use of online stores and delivery services, which is further aiding in sports nutrition market growth.
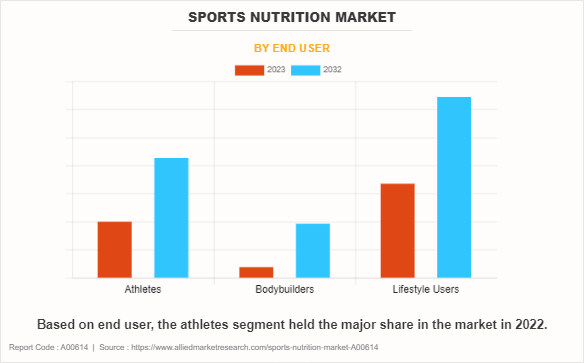
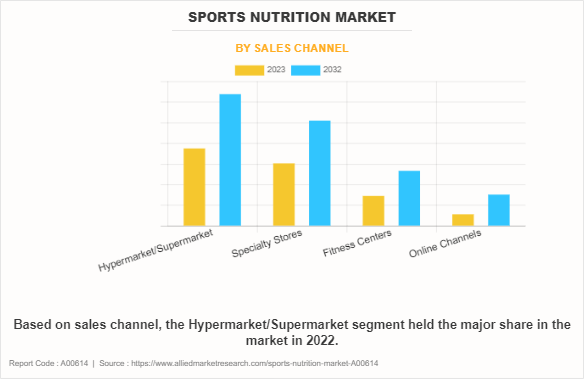
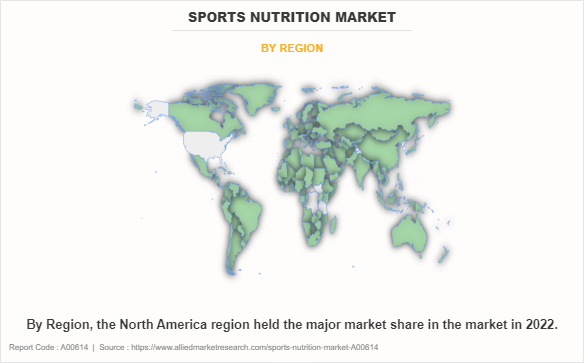
The global sports nutrition market is segmented on the basis of type, end user, sales channel, and region. Based on type, the global market is segregated into protein powder, ISO drink powder, sports supplements, RTD protein drinks, sports drinks, energy bars, and others. By end user, the market is segmented into athletes, bodybuilders, and lifestyle users. Based on sales channel, the global market is studied across hypermarket/supermarket, drugs and specialty stores, fitness centers, and online channels. Region wise, the sports nutrition market is studied across North America, Europe, Asia-Pacific, and LAMEA.
By type, the sports nutrition market is divided into protein powder, ISO drink powder, sports supplements, RTD protein drinks, sports drinks, energy bars, and others. Protein powder is the most widely used sports nutrition product followed by sports drinks, as these are the most well-known type of sports nutritional products available in the market.
Depending on end user, the market is divided into athletes, bodybuilders, and lifestyle users. Lifestyle users are the largest consumers of sports nutrition products, and include consumers who either casually exercise to stay fit or people who want to consume healthy food and snacks.
By sales channel, the market is divided into hypermarket/supermarket, drugs and specialty stores, fitness centers, and online channels. Hypermarkets/supermarkets are the most preferred methods of purchase of sports nutrition products as they are the most easily accessible location and contain a myriad of products to choose from.
The report focuses on the market growth prospects, restraints, and opportunities of the global sports nutrition market. The study provides Porter’s five forces analysis to understand the impact of various factors such as competitive intensity of competitors, bargaining power of suppliers, threat of substitutes, threat of new entrants, and bargaining power of buyers of the sports nutrition market.
Some of the major players profiled for in the sports nutrition market analysis include Abbott Nutrition, Inc., Clif Bar & Company, Glanbia Plc., GNC Holdings, Otsuka Pharmaceutical Co., Ltd., PepsiCo Inc., Post Holdings, Inc., Reckitt Benckiser Group Plc., The Coca-Cola Company, and Yakult Honsha Co., Ltd.
Covid-19 Impact Analysis
Key Benefits For Stakeholders
Sports Nutrition Market Report Highlights
Aspects | Details |
---|---|
By Type |
|
By End user |
|
By Sales Channel |
|
By Region |
|
Other players in the value chain include | Atlantic Multipower UK Limited, GlaxoSmithKline PLC, Olimp Laboratories, Ultimate Nutrition Inc., PowerBar Europe GmbH |
CHAPTER 1:INTRODUCTION
1.1.Report description
1.2.Key benefits for stakeholders
1.3.Key market segments
1.4.Research methodology
1.4.1.Primary research
1.4.2.Secondary research
1.4.3.Analyst tools and models
CHAPTER 2:EXECUTIVE SUMMARY
2.1.Key findings
2.1.1.Top impacting factors
2.1.2.Top investment pockets
2.2.CXO perspective
CHAPTER 3:MARKET OVERVIEW
3.1.Market definition and scope
3.2.Porter's five forces analysis
3.2.1.Bargaining power of suppliers
3.2.2.Bargaining power of buyers
3.2.3.Threat of substitution
3.2.4.Threat of new entrants
3.2.5.Intensity of competitive rivalry
3.3.Parent market overview
3.4.Market dynamics
3.4.1.Drivers
3.4.1.1.Multiple benefits of sports nutrition products
3.4.1.2.Increase in fitness activities amongst consumers.
3.4.1.3.Packaged snacks and healthy food are becoming increasingly popular among consumers.
3.4.2.Restraints
3.4.2.1.Counterfeit and low quality products affecting the market.
3.4.2.2.Product recalls and availability of substitutes.
3.4.3.Opportunities
3.4.3.1.Rise of social media and digital marketing to aid in increasing awareness about the market.
3.4.3.2.Greater demands for organic sports nutrition products can help the market grow
3.5.Covid-19 analysis
3.5.1.Overview:
3.5.2.Impact on food and beverage sector:
3.5.3.Impact on sports nutrition market:
3.6.Supply chain analysis
3.7.Consumer survey analysis
3.8.Key trends shaping global sports nutrition market.
3.9.Sports ecosystem
CHAPTER 4:SPORTS NUTRITION MARKET, BY TYPE
4.1.Overview
4.1.1.Market size and forecast, by Type
4.2.Protein powder
4.2.1.Key market trends, growth factors, and opportunities
4.2.2.Market size and forecast, by region
4.2.3.Market analysis, by country
4.3.ISO drink powder
4.3.1.Key market trends, growth factors, and opportunities
4.3.2.Market size and forecast, by region
4.3.3.Market analysis, by country
4.4.Sports supplements
4.4.1.Key market trends, growth factors, and opportunities
4.4.2.Market size and forecast, by region
4.4.3.Market analysis, by country
4.5.RTD protein drinks
4.5.1.Key market trends, growth factors, and opportunities
4.5.2.Market size and forecast, by region
4.5.3.Market analysis, by country
4.6.Sports drinks
4.6.1.Key market trends, growth factors, and opportunities
4.6.2.Market size and forecast, by region
4.6.3.Market analysis, by country
4.7.Energy bars
4.7.1.Key market trends, growth factors, and opportunities
4.7.2.Market size and forecast, by region
4.7.3.Market analysis, by country
4.8.Others
4.8.1.Key market trends, growth factors, and opportunities
4.8.2.Market size and forecast, by region
4.8.3.Market analysis, by country
CHAPTER 5:SPORTS NUTRITION MARKET, BY END USER
5.1.Overview
5.1.1.Market size and forecast, by End user
5.2.Athletes
5.2.1.Key market trends, growth factors, and opportunities
5.2.2.Market size and forecast, by region
5.2.3.Market analysis, by country
5.3.Bodybuilders
5.3.1.Key market trends, growth factors, and opportunities
5.3.2.Market size and forecast, by region
5.3.3.Market analysis, by country
5.4.Lifestyle users
5.4.1.Key market trends, growth factors, and opportunities
5.4.2.Market size and forecast, by region
5.4.3.Market analysis, by country
CHAPTER 6:SPORTS NUTRITION MARKET, BY SALES CHANNEL
6.1.Overview
6.1.1.Market size and forecast, by Sales channel
6.2.Hypermarket/Supermarket
6.2.1.Key market trends, growth factors, and opportunities
6.2.2.Market size and forecast, by region
6.2.3.Market analysis, by country
6.3.Drug and specialty stores
6.3.1.Key market trends, growth factors, and opportunities
6.3.2.Market size and forecast, by region
6.3.3.Market analysis, by country
6.4.Fitness centers
6.4.1.Key market trends, growth factors, and opportunities
6.4.2.Market size and forecast, by region
6.4.3.Market analysis, by country
6.5.Online channels
6.5.1.Key market trends, growth factors, and opportunities
6.5.2.Market size and forecast, by region
6.5.3.Market analysis, by country
CHAPTER 7:SPORTS NUTRITION MARKET, BY REGION
7.1.Overview
7.1.1.Market size and forecast, by region
7.2.North America
7.2.1.Key market trends, growth factors, and opportunities
7.2.2.Market size and forecast, by Type
7.2.3.Market size and forecast, by End user
7.2.4.Market size and forecast, by Sales channel
7.2.5.Market analysis, by Country
7.2.5.1.U.S.
7.2.5.1.1.Market size and forecast, by Type
7.2.5.1.2.Market size and forecast, by End user
7.2.5.1.3.Market size and forecast, by Sales channel
7.2.5.2.Canada
7.2.5.2.1.Market size and forecast, by Type
7.2.5.2.2.Market size and forecast, by End user
7.2.5.2.3.Market size and forecast, by Sales channel
7.2.5.3.Mexico
7.2.5.3.1.Market size and forecast, by Type
7.2.5.3.2.Market size and forecast, by End user
7.2.5.3.3.Market size and forecast, by Sales channel
7.3.Europe
7.3.1.Key market trends, growth factors, and opportunities
7.3.2.Market size and forecast, by Type
7.3.3.Market size and forecast, by End user
7.3.4.Market size and forecast, by Sales channel
7.3.5.Market analysis, by Country
7.3.5.1.UK
7.3.5.1.1.Market size and forecast, by Type
7.3.5.1.2.Market size and forecast, by End user
7.3.5.1.3.Market size and forecast, by Sales channel
7.3.5.2.Germany
7.3.5.2.1.Market size and forecast, by Type
7.3.5.2.2.Market size and forecast, by End user
7.3.5.2.3.Market size and forecast, by Sales channel
7.3.5.3.France
7.3.5.3.1.Market size and forecast, by Type
7.3.5.3.2.Market size and forecast, by End user
7.3.5.3.3.Market size and forecast, by Sales channel
7.3.5.4.Italy
7.3.5.4.1.Market size and forecast, by Type
7.3.5.4.2.Market size and forecast, by End user
7.3.5.4.3.Market size and forecast, by Sales channel
7.3.5.5.Spain
7.3.5.5.1.Market size and forecast, by Type
7.3.5.5.2.Market size and forecast, by End user
7.3.5.5.3.Market size and forecast, by Sales channel
7.3.5.6.Rest of Europe
7.3.5.6.1.Market size and forecast, by Type
7.3.5.6.2.Market size and forecast, by End user
7.3.5.6.3.Market size and forecast, by Sales channel
7.4.Asia-Pacific
7.4.1.Key market trends, growth factors, and opportunities
7.4.2.Market size and forecast, by Type
7.4.3.Market size and forecast, by End user
7.4.4.Market size and forecast, by Sales channel
7.4.5.Market analysis, by country
7.4.5.1.China
7.4.5.1.1.Market size and forecast, by Type
7.4.5.1.2.Market size and forecast, by End user
7.4.5.1.3.Market size and forecast, by Sales channel
7.4.5.2.Japan
7.4.5.2.1.Market size and forecast, by Type
7.4.5.2.2.Market size and forecast, by End user
7.4.5.2.3.Market size and forecast, by Sales channel
7.4.5.3.India
7.4.5.3.1.Market size and forecast, by Type
7.4.5.3.2.Market size and forecast, by End user
7.4.5.3.3.Market size and forecast, by Sales channel
7.4.5.4.Australia
7.4.5.4.1.Market size and forecast, by Type
7.4.5.4.2.Market size and forecast, by End user
7.4.5.4.3.Market size and forecast, by Sales channel
7.4.5.5.South Korea
7.4.5.5.1.Market size and forecast, by Type
7.4.5.5.2.Market size and forecast, by End user
7.4.5.5.3.Market size and forecast, by Sales channel
7.4.5.6.Rest of Asia-Pacific
7.4.5.6.1.Market size and forecast, by Type
7.4.5.6.2.Market size and forecast, by End user
7.4.5.6.3.Market size and forecast, by Sales channel
7.5.LAMEA
7.5.1.Key market trends, growth factors, and opportunities
7.5.2.Market size and forecast, by Type
7.5.3.Market size and forecast, by End user
7.5.4.Market size and forecast, by Sales channel
7.5.5.Market analysis, by country
7.5.5.1.Brazil
7.5.5.1.1.Market size and forecast, by Type
7.5.5.1.2.Market size and forecast, by End user
7.5.5.1.3.Market size and forecast, by Sales channel
7.5.5.2.Argentina
7.5.5.2.1.Market size and forecast, by Type
7.5.5.2.2.Market size and forecast, by End user
7.5.5.2.3.Market size and forecast, by Sales channel
7.5.5.3.South Africa
7.5.5.3.1.Market size and forecast, by Type
7.5.5.3.2.Market size and forecast, by End user
7.5.5.3.3.Market size and forecast, by Sales channel
7.5.5.4.Rest of LAMEA
7.5.5.4.1.Market size and forecast, by Type
7.5.5.4.2.Market size and forecast, by End user
7.5.5.4.3.Market size and forecast, by Sales channel
CHAPTER 8:COMPETITION LANDSCAPE
8.1.Overview
8.2.Competitive dashboard
8.3.Competitive heat map
8.4.Product mapping
8.5.Top winning strategies
8.6.Key developments
8.6.1.Acquisition
8.6.2.Agreement
8.6.3.Business Expansion
8.6.4.Partnership
8.6.5.Product Launch
8.7.Top Player Positioning
CHAPTER 9:COMPANY PROFILES
9.1.ABBOTT LABORATORIES (ABBOTT)
9.1.1.Company overview
9.1.2.Key Executives
9.1.3.Company snapshot
9.1.4.Operating business segments
9.1.5.Product portfolio
9.1.6.R&D Expenditure
9.1.7.Business performance
9.1.8.Key strategic moves and developments
9.2.CLIF BAR & COMPANY
9.2.1.Company overview
9.2.2.Key executives
9.2.3.Company snapshot
9.2.4.Product portfolio
9.2.5.Key strategic moves and developments
9.3.GLANBIA PLC.
9.3.1.Company overview
9.3.2.Key Executives
9.3.3.Company snapshot
9.3.4.Operating business segments
9.3.5.Product portfolio
9.3.6.R&D Expenditure
9.3.7.Business performance
9.3.8.Key strategic moves and developments
9.4.GNC HOLDINGS, LLC
9.4.1.Company overview
9.4.2.Key Executives
9.4.3.Company snapshot
9.4.4.Product portfolio
9.4.5.Key strategic moves and developments
9.5.OTSUKA HOLDINGS CO., LTD.
9.5.1.Company overview
9.5.2.Key Executives
9.5.3.Company snapshot
9.5.4.Product portfolio
9.5.5.R&D Expenditure
9.5.6.Business performance
9.5.7.Key strategic moves and developments
9.6.PEPSICO, INC.
9.6.1.Company overview
9.6.2.Key Executives
9.6.3.Company snapshot
9.6.4.Operating business segments
9.6.5.Product portfolio
9.6.6.R&D Expenditure
9.6.7.Business performance
9.7.POST HOLDINGS, INC.
9.7.1.Company overview
9.7.2.Key Executives
9.7.3.Company snapshot
9.7.4.Operating business segments
9.7.5.Product portfolio
9.7.6.R&D Expenditure
9.7.7.Business performance
9.8.RECKITT BENCKISER GROUP PLC.
9.8.1.Company overview
9.8.2.Key Executive
9.8.3.Company snapshot
9.8.4.Operating business segments
9.8.5.Product portfolio
9.8.6.R&D Expenditure
9.8.7.Business performance
9.9.THE COCA-COLA COMPANY
9.9.1.Company overview
9.9.2.Key executives
9.9.3.Company snapshot
9.9.4.Operating business segments
9.9.5.Product portfolio
9.9.6.Business performance
9.9.7.Key strategic moves and developments
9.10.YAKULT HONSHA CO., LTD.
9.10.1.Company overview
9.10.2.Key Executives
9.10.3.Company snapshot
9.10.4.Operating business segments
9.10.5.Product portfolio
9.10.6.R&D Expenditure
9.10.7.Business performance
9.10.8.Key strategic moves and developments
LIST OF TABLES
TABLE 01.SPORTS NUTRITION MARKET, BY TYPE, 2020–2030 ($ MILLION)
TABLE 02.PROTEIN POWDER SPORTS NUTRITION MARKET, BY REGION, 2020–2030 ($ MILLION)
TABLE 03.ISO DRINK POWDER SPORTS NUTRITION MARKET, BY REGION, 2020–2030 ($ MILLION)
TABLE 04.SPORTS SUPPLEMENTS SPORTS NUTRITION MARKET, BY REGION, 2020–2030 ($ MILLION)
TABLE 05.RTD PROTEIN DRINKS SPORTS NUTRITION MARKET, BY REGION, 2020–2030 ($ MILLION)
TABLE 06.SPORTS DRINKS SPORTS NUTRITION MARKET, BY REGION, 2020–2030 ($ MILLION)
TABLE 07.ENERGY BARS SPORTS NUTRITION MARKET, BY REGION, 2020–2030 ($ MILLION)
TABLE 08.OTHERS SPORTS NUTRITION MARKET, BY REGION, 2020–2030 ($ MILLION)
TABLE 09.SPORTS NUTRITION MARKET VALUE, BY END USER, 2020–2030 ($ MILLION)
TABLE 10.SPORTS NUTRITION MARKET FOR ATHLETES, BY REGION, 2020–2030 ($ MILLION)
TABLE 11.SPORTS NUTRITION MARKET FOR BODYBUILDERS, BY REGION, 2020–2030 ($ MILLION)
TABLE 12.SPORTS NUTRITION MARKET FOR LIFESTYLE USERS, BY REGION, 2020–2030 ($ MILLION)
TABLE 13.SPORTS NUTRITION MARKET VALUE, BY SALES CHANNEL, 2020–2030 ($ MILLION)
TABLE 14.SPORTS NUTRITION MARKET SALES VIA HYPERMARKET/SUPERMARKET, BY REGION, 2020–2030 ($ MILLION)
TABLE 15.SPORTS NUTRITION MARKET SALES VIA DRUG AND SPECIALTY STORES, BY REGION, 2020–2030 ($ MILLION)
TABLE 16.SPORTS NUTRITION MARKET SALES VIA FITNESS CENTERS, BY REGION, 2020–2030 ($ MILLION)
TABLE 17.SPORTS NUTRITION MARKET SALES VIA ONLINE CHANNELS, BY REGION, 2020–2030 ($ MILLION)
TABLE 18.SPORTS NUTRITION MARKET, BY REGION, 2020–2030 ($ MILLION)
TABLE 19.NORTH AMERICA SPORTS NUTRITION MARKET VALUE, BY TYPE, 2020–2030 ($ MILLION)
TABLE 20.NORTH AMERICA SPORTS NUTRITION MARKET VALUE, BY SALES CHANNEL, 2020–2030 ($ MILLION)
TABLE 21.NORTH AMERICA SPORTS NUTRITION MARKET VALUE, BY SALES CHANNEL, 2020–2030 ($ MILLION)
TABLE 22.NORTH AMERICA SPORTS NUTRITION MARKET VALUE, BY COUNTRY, 2020–2030 ($ MILLION)
TABLE 23.U.S. SPORTS NUTRITION MARKET VALUE, BY TYPE, 2020–2030 ($ MILLION)
TABLE 24.U.S. SPORTS NUTRITION MARKET VALUE, BY END USER, 2020–2030 ($ MILLION)
TABLE 25.U.S. SPORTS NUTRITION MARKET VALUE, BY SALES CHANNEL, 2020–2030 ($ MILLION)
TABLE 26.CANADA SPORTS NUTRITION MARKET VALUE, BY TYPE, 2020–2030 ($ MILLION)
TABLE 27.CANADA SPORTS NUTRITION MARKET VALUE, BY END USER, 2020–2030 ($ MILLION)
TABLE 28.CANADA SPORTS NUTRITION MARKET VALUE, BY SALES CHANNEL, 2020–2030 ($ MILLION)
TABLE 29.MEXICO SPORTS NUTRITION MARKET VALUE, BY TYPE, 2020–2030 ($ MILLION)
TABLE 30.MEXICO SPORTS NUTRITION MARKET VALUE, BY END USER, 2020–2030 ($ MILLION)
TABLE 31.MEXICO SPORTS NUTRITION MARKET VALUE, BY SALES CHANNEL, 2020–2030 ($ MILLION)
TABLE 32.EUROPE SPORTS NUTRITION MARKET VALUE, BY TYPE, 2020–2030 ($ MILLION)
TABLE 33.EUROPE SPORTS NUTRITION MARKET VALUE, BY SALES CHANNEL, 2020–2030 ($ MILLION)
TABLE 34.EUROPE SPORTS NUTRITION MARKET VALUE, BY SALES CHANNEL, 2020–2030 ($ MILLION)
TABLE 35.EUROPE SPORTS NUTRITION MARKET VALUE, BY COUNTRY, 2020–2030 ($ MILLION)
TABLE 36.UK SPORTS NUTRITION MARKET VALUE, BY TYPE, 2020–2030 ($ MILLION)
TABLE 37.UK SPORTS NUTRITION MARKET VALUE, BY END USER, 2020–2030 ($ MILLION)
TABLE 38.UK SPORTS NUTRITION MARKET VALUE, BY SALES CHANNEL, 2020–2030 ($ MILLION)
TABLE 39.GERMANY SPORTS NUTRITION MARKET VALUE, BY TYPE, 2020–2030 ($ MILLION)
TABLE 40.GERMANY SPORTS NUTRITION MARKET VALUE, BY END USER, 2020–2030 ($ MILLION)
TABLE 41.GERMANY SPORTS NUTRITION MARKET VALUE, BY SALES CHANNEL, 2020–2030 ($ MILLION)
TABLE 42.FRANCE SPORTS NUTRITION MARKET VALUE, BY TYPE, 2020–2030 ($ MILLION)
TABLE 43.FRANCE SPORTS NUTRITION MARKET VALUE, BY END USER, 2020–2030 ($ MILLION)
TABLE 44.FRANCE SPORTS NUTRITION MARKET VALUE, BY SALES CHANNEL, 2020–2030 ($ MILLION)
TABLE 45.ITALY SPORTS NUTRITION MARKET VALUE, BY TYPE, 2020–2030 ($ MILLION)
TABLE 46.ITALY SPORTS NUTRITION MARKET VALUE, BY END USER, 2020–2030 ($ MILLION)
TABLE 47.ITALY SPORTS NUTRITION MARKET VALUE, BY SALES CHANNEL, 2020–2030 ($ MILLION)
TABLE 48.SPAIN SPORTS NUTRITION MARKET VALUE, BY TYPE, 2020–2030 ($ MILLION)
TABLE 49.SPAIN SPORTS NUTRITION MARKET VALUE, BY END USER, 2020–2030 ($ MILLION)
TABLE 50.SPAIN SPORTS NUTRITION MARKET VALUE, BY SALES CHANNEL, 2020–2030 ($ MILLION)
TABLE 51.REST OF EUROPE SPORTS NUTRITION MARKET VALUE, BY TYPE, 2020–2030 ($ MILLION)
TABLE 52.REST OF EUROPE SPORTS NUTRITION MARKET VALUE, BY END USER, 2020–2030 ($ MILLION)
TABLE 53.REST OF EUROPE SPORTS NUTRITION MARKET VALUE, BY SALES CHANNEL, 2020–2030 ($ MILLION)
TABLE 54.ASIA-PACIFIC SPORTS NUTRITION MARKET VALUE, BY TYPE, 2020–2030 ($ MILLION)
TABLE 55.ASIA-PACIFIC SPORTS NUTRITION MARKET VALUE, BY SALES CHANNEL, 2020–2030 ($ MILLION)
TABLE 56.ASIA-PACIFIC SPORTS NUTRITION MARKET VALUE, BY SALES CHANNEL, 2020–2030 ($ MILLION)
TABLE 57.ASIA-PACIFIC SPORTS NUTRITION MARKET VALUE, BY COUNTRY, 2020–2030 ($ MILLION)
TABLE 58.CHINA SPORTS NUTRITION MARKET VALUE, BY TYPE, 2020–2030 ($ MILLION)
TABLE 59.CHINA SPORTS NUTRITION MARKET VALUE, BY END USER, 2020–2030 ($ MILLION)
TABLE 60.CHINA SPORTS NUTRITION MARKET VALUE, BY SALES CHANNEL, 2020–2030 ($ MILLION)
TABLE 61.JAPAN SPORTS NUTRITION MARKET VALUE, BY TYPE, 2020–2030 ($ MILLION)
TABLE 62.JAPAN SPORTS NUTRITION MARKET VALUE, BY END USER, 2020–2030 ($ MILLION)
TABLE 63.JAPAN SPORTS NUTRITION MARKET VALUE, BY SALES CHANNEL, 2020–2030 ($ MILLION)
TABLE 64.INDIA SPORTS NUTRITION MARKET VALUE, BY TYPE, 2020–2030 ($ MILLION)
TABLE 65.INDIA SPORTS NUTRITION MARKET VALUE, BY END USER, 2020–2030 ($ MILLION)
TABLE 66.INDIA SPORTS NUTRITION MARKET VALUE, BY SALES CHANNEL, 2020–2030 ($ MILLION)
TABLE 67.AUSTRALIA SPORTS NUTRITION MARKET VALUE, BY TYPE, 2020–2030 ($ MILLION)
TABLE 68.AUSTRALIA SPORTS NUTRITION MARKET VALUE, BY END USER, 2020–2030 ($ MILLION)
TABLE 69.AUSTRALIA SPORTS NUTRITION MARKET VALUE, BY SALES CHANNEL, 2020–2030 ($ MILLION)
TABLE 70.SOUTH KOREA SPORTS NUTRITION MARKET VALUE, BY TYPE, 2020–2030 ($ MILLION)
TABLE 71.SOUTH KOREA SPORTS NUTRITION MARKET VALUE, BY END USER, 2020–2030 ($ MILLION)
TABLE 72.SOUTH KOREA SPORTS NUTRITION MARKET VALUE, BY SALES CHANNEL, 2020–2030 ($ MILLION)
TABLE 73.REST OF ASIA-PACIFIC SPORTS NUTRITION MARKET VALUE, BY TYPE, 2020–2030 ($ MILLION)
TABLE 74.REST OF ASIA-PACIFIC SPORTS NUTRITION MARKET VALUE, BY END USER, 2020–2030 ($ MILLION)
TABLE 75.REST OF ASIA-PACIFIC SPORTS NUTRITION MARKET VALUE, BY SALES CHANNEL, 2020–2030 ($ MILLION)
TABLE 76.LAMEA SPORTS NUTRITION MARKET VALUE, BY TYPE, 2020–2030 ($ MILLION)
TABLE 77.LAMEA SPORTS NUTRITION MARKET VALUE, BY SALES CHANNEL, 2020–2030 ($ MILLION)
TABLE 78.LAMEA SPORTS NUTRITION MARKET VALUE, BY SALES CHANNEL, 2020–2030 ($ MILLION)
TABLE 79.LAMEA SPORTS NUTRITION MARKET VALUE, BY COUNTRY, 2020–2030 ($ MILLION)
TABLE 80.BRAZIL SPORTS NUTRITION MARKET VALUE, BY TYPE, 2020–2030 ($ MILLION)
TABLE 81.BRAZIL SPORTS NUTRITION MARKET VALUE, BY END USER, 2020–2030 ($ MILLION)
TABLE 82.BRAZIL SPORTS NUTRITION MARKET VALUE, BY SALES CHANNEL, 2020–2030 ($ MILLION)
TABLE 83.ARGENTINA SPORTS NUTRITION MARKET VALUE, BY TYPE, 2020–2030 ($ MILLION)
TABLE 84.ARGENTINA SPORTS NUTRITION MARKET VALUE, BY END USER, 2020–2030 ($ MILLION)
TABLE 85.ARGENTINA SPORTS NUTRITION MARKET VALUE, BY SALES CHANNEL, 2020–2030 ($ MILLION)
TABLE 86.SOUTH AFRICA SPORTS NUTRITION MARKET VALUE, BY TYPE, 2020–2030 ($ MILLION)
TABLE 87.SOUTH AFRICA SPORTS NUTRITION MARKET VALUE, BY END USER, 2020–2030 ($ MILLION)
TABLE 88.SOUTH AFRICA SPORTS NUTRITION MARKET VALUE, BY SALES CHANNEL, 2020–2030 ($ MILLION)
TABLE 89.REST OF LAMEA SPORTS NUTRITION MARKET VALUE, BY TYPE, 2020–2030 ($ MILLION)
TABLE 90.REST OF LAMEA SPORTS NUTRITION MARKET VALUE, BY END USER, 2020–2030 ($ MILLION)
TABLE 91.REST OF LAMEA SPORTS NUTRITION MARKET VALUE, BY SALES CHANNEL, 2020–2030 ($ MILLION)
TABLE 92.ABBOTT LABORATORIES: KEY EXECUTIVES
TABLE 93.ABBOTT LABORATORIES: COMPANY SNAPSHOT
TABLE 94.ABBOTT LABORATORIES: OPERATING SEGMENTS
TABLE 95.ABBOTT LABORATORIES: PRODUCT PORTFOLIO
TABLE 96.ABBOTT LABORATORIES: R&D EXPENDITURE, 2018–2020 ($MILLION)
TABLE 97.ABBOTT LABORATORIES: NET SALES, 2018–2020 ($MILLION)
TABLE 98.CLIF BAR & COMPANY: KEY EXECUTIVES
TABLE 99.CLIF BAR & COMPANY: COMPANY SNAPSHOT
TABLE 100.CLIF BAR & COMPANY: PRODUCT PORTFOLIO
TABLE 101.GLANBIA PLC: KEY EXECUTIVES
TABLE 102.GLANBIA PLC: COMPANY SNAPSHOT
TABLE 103.GLANBIA PLC: OPERATING SEGMENTS
TABLE 104.GLANBIA PLC: PRODUCT PORTFOLIO
TABLE 105.GLANBIA PLC: R&D EXPENDITURE, 2018–2020 ($MILLION)
TABLE 106.GLANBIA PLC: NET SALES, 2018–2020 ($MILLION)
TABLE 107.GNC HOLDINGS, LLC: KEY EXECUTIVES
TABLE 108.GNC HOLDINGS, LLC: COMPANY SNAPSHOT
TABLE 109.GNC HOLDINGS, LLC: PRODUCT PORTFOLIO
TABLE 110.OTSUKA HOLDINGS CO., LTD.: KEY EXECUTIVES
TABLE 111.OTSUKA HOLDINGS CO., LTD.: COMPANY SNAPSHOT
TABLE 112.OTSUKA HOLDINGS CO., LTD.: PRODUCT PORTFOLIO
TABLE 113.OTSUKA HOLDINGS CO., LTD.: R&D EXPENDITURE, 2018–2020 ($MILLION)
TABLE 114.OTSUKA HOLDINGS CO., LTD.: NET SALES, 2018–2020 ($MILLION)
TABLE 115.PEPSICO, INC.: KEY EXECUTIVES
TABLE 116.PEPSICO, INC.: COMPANY SNAPSHOT
TABLE 117.PEPSICO, INC.: OPERATING SEGMENTS
TABLE 118.PEPSICO, INC.: PRODUCT PORTFOLIO
TABLE 119.PEPSICO, INC.: R&D EXPENDITURE, 2018–2020 ($MILLION)
TABLE 120.PEPSICO, INC.: NET SALES, 2018–2020 ($MILLION)
TABLE 121.POST HOLDINGS, INC.: KEY EXECUTIVES
TABLE 122.POST HOLDINGS, INC.: COMPANY SNAPSHOT
TABLE 123.LIXIL GROUP CORPORATION: OPERATING SEGMENTS
TABLE 124.POST HOLDINGS, INC.: PRODUCT PORTFOLIO
TABLE 125.POST HOLDINGS, INC.: R&D EXPENDITURE, 2018-2020 ($MILLION)
TABLE 126.POST HOLDINGS, INC.: NET SALES, 2018-2020 ($MILLION)
TABLE 127.RECKITT BENCKISER GROUP PLC.: KEY EXECUTIVES
TABLE 128.RECKITT BENCKISER GROUP PLC.: COMPANY SNAPSHOT
TABLE 129.RECKITT BENCKISER GROUP PLC.: OPERATING SEGMENTS
TABLE 130.RECKITT BENCKISER GROUP PLC.: PRODUCT PORTFOLIO
TABLE 131.RECKITT BENCKISER GROUP PLC.: R&D EXPENDITURE, 2018–2020 ($MILLION)
TABLE 132.RECKITT BENCKISER GROUP PLC.: NET SALES, 2018–2020 ($MILLION)
TABLE 133.THE COCA-COLA COMPANY : KEY EXECUTIVES
TABLE 134.THE COCA-COLA COMPANY : COMPANY SNAPSHOT
TABLE 135.THE COCA-COLA COMPANY: OPERATING SEGMENTS
TABLE 136.THE COCA-COLA COMPANY : PRODUCT PORTFOLIO
TABLE 137.THE COCA-COLA COMPANY : NET SALES, 2018–2020 ($MILLION)
TABLE 138.YAKULT HONSHA CO., LTD.: KEY EXECUTIVES
TABLE 139.YAKULT HONSHA CO., LTD.: COMPANY SNAPSHOT
TABLE 140.YAKULT HONSHA CO., LTD.: OPERATING SEGMENTS
TABLE 141.YAKULT HONSHA CO., LTD.: PRODUCT PORTFOLIO
TABLE 142.YAKULT HONSHA CO., LTD.: R&D EXPENDITURE, 2018–2020 ($MILLION)
TABLE 143.YAKULT HONSHA CO., LTD.: NET SALES, 2018–2020 ($MILLION)
LIST OF FIGURES
FIGURE 01.KEY MARKET SEGMENTS
FIGURE 02.EXECUTIVE SUMMARY
FIGURE 03.TOP IMPACTING FACTORS
FIGURE 04.TOP INVESTMENT POCKETS
FIGURE 05.MODERATE BARGAINING POWER OF SUPPLIERS
FIGURE 06.HIGH BARGAINING POWER OF BUYERS
FIGURE 07.HIGH THREAT OF SUBSTITUTION
FIGURE 08.MODERATE THREAT OF NEW ENTRANTS
FIGURE 09.HIGH INTENSITY OF COMPETITIVE RIVALRY
FIGURE 10.SPORTS NUTRITION MARKET, BY TYPE, 2020 (%)
FIGURE 11.COMPARATIVE VALUE SHARE ANALYSIS OF PROTEIN POWDER SPORTS NUTRITION MARKET, BY COUNTRY, 2020 & 2030 (%)
FIGURE 12.COMPARATIVE VALUE SHARE ANALYSIS OF ISO DRINK POWDER SPORTS NUTRITION MARKET, BY COUNTRY, 2020 & 2030 (%)
FIGURE 13.COMPARATIVE VALUE SHARE ANALYSIS OF SPORTS SUPPLEMENTS SPORTS NUTRITION MARKET, BY COUNTRY, 2020 & 2030 (%)
FIGURE 14.COMPARATIVE VALUE SHARE ANALYSIS OF RTD PROTEIN DRINKS SPORTS NUTRITION MARKET, BY COUNTRY, 2020 & 2030 (%)
FIGURE 15.COMPARATIVE VALUE SHARE ANALYSIS OF SPORTS DRINKS SPORTS NUTRITION MARKET, BY COUNTRY, 2020 & 2030 (%)
FIGURE 16.COMPARATIVE VALUE SHARE ANALYSIS OF ENERGY BARS SPORTS NUTRITION MARKET, BY COUNTRY, 2020 & 2030 (%)
FIGURE 17.COMPARATIVE VALUE SHARE ANALYSIS OF OTHERS SPORTS NUTRITION MARKET, BY COUNTRY, 2020 & 2030 (%)
FIGURE 18.SPORTS NUTRITION MARKET, BY END USER, 2020 (%)
FIGURE 19.COMPARATIVE VALUE SHARE ANALYSIS OF SPORTS NUTRITION MARKET FOR ATHLETES, BY COUNTRY, 2020 & 2030 (%)
FIGURE 20.COMPARATIVE VALUE SHARE ANALYSIS OF SPORTS NUTRITION MARKET FOR BODYBUILDERS, BY COUNTRY, 2020 & 2030 (%)
FIGURE 21.COMPARATIVE VALUE SHARE ANALYSIS OF SPORTS NUTRITION MARKET FOR LIFESTYLE USERS, BY COUNTRY, 2020 & 2030 (%)
FIGURE 22.SPORTS NUTRITION MARKET, BY SALES CHANNEL, 2020 (%)
FIGURE 23.COMPARATIVE VALUE SHARE ANALYSIS OF SPORTS NUTRITION SALES VIA HYPERMARKET/SUPERMARKET, BY COUNTRY, 2020 & 2030 (%)
FIGURE 24.COMPARATIVE VALUE SHARE ANALYSIS OF SPORTS NUTRITION SALES VIA DRUG AND SPECIALTY STORES, BY COUNTRY, 2020 & 2030 (%)
FIGURE 25.COMPARATIVE VALUE SHARE ANALYSIS OF SPORTS NUTRITION SALES VIA FITNESS CENTERS, BY COUNTRY, 2020 & 2030 (%)
FIGURE 26.COMPARATIVE VALUE SHARE ANALYSIS OF SPORTS NUTRITION SALES VIA ONLINE CHANNELS, BY COUNTRY, 2020 & 2030 (%)
FIGURE 27.SPORTS NUTRITION MARKET, BY REGION 2020 (%)
FIGURE 28.U.S. SPORTS NUTRITION MARKET VALUE, 2020-2030 ($ MILLION)
FIGURE 29.CANADA SPORTS NUTRITION MARKET VALUE, 2020-2030 ($ MILLION)
FIGURE 30.MEXICO SPORTS NUTRITION MARKET VALUE, 2020-2030 ($ MILLION)
FIGURE 31.UK SPORTS NUTRITION MARKET VALUE, 2020-2030 ($ MILLION)
FIGURE 32.GERMANY SPORTS NUTRITION MARKET VALUE, 2020-2030 ($ MILLION)
FIGURE 33.FRANCE SPORTS NUTRITION MARKET VALUE, 2020-2030 ($ MILLION)
FIGURE 34.ITALY SPORTS NUTRITION MARKET VALUE, 2020-2030 ($ MILLION)
FIGURE 35.SPAIN SPORTS NUTRITION MARKET VALUE, 2020-2030 ($ MILLION)
FIGURE 36.REST OF EUROPE SPORTS NUTRITION MARKET VALUE, 2020-2030 ($ MILLION)
FIGURE 37.CHINA SPORTS NUTRITION MARKET VALUE, 2020-2030 ($ MILLION)
FIGURE 38.JAPAN SPORTS NUTRITION MARKET VALUE, 2020-2030 ($ MILLION)
FIGURE 39.INDIA SPORTS NUTRITION MARKET VALUE, 2020-2030 ($ MILLION)
FIGURE 40.AUSTRALIA SPORTS NUTRITION MARKET VALUE, 2020-2030 ($ MILLION)
FIGURE 41.SOUTH KOREA SPORTS NUTRITION MARKET VALUE, 2020-2030 ($ MILLION)
FIGURE 42.REST OF ASIA-PACIFIC SPORTS NUTRITION MARKET VALUE, 2020-2030 ($ MILLION)
FIGURE 43.BRAZIL SPORTS NUTRITION MARKET VALUE, 2020-2030 ($ MILLION)
FIGURE 44.ARGENTINA SPORTS NUTRITION MARKET VALUE, 2020-2030 ($ MILLION)
FIGURE 45.SOUTH AFRICA SPORTS NUTRITION MARKET VALUE, 2020-2030 ($ MILLION)
FIGURE 46.REST OF LAMEA SPORTS NUTRITION MARKET VALUE, 2020-2030 ($ MILLION)
FIGURE 47.COMPETITIVE DASHBOARD OF TOP 10 KEY PLAYERS
FIGURE 48.COMPETITIVE HEATMAP OF TOP 10 KEY PLAYERS
FIGURE 49.PRODUCT MAPPING OF TOP 10 KEY PLAYERS
FIGURE 50.TOP WINNING STRATEGIES, BY YEAR, 2018–2021*
FIGURE 51.TOP WINNING STRATEGIES, BY DEVELOPMENT, 2018–2021* (%)
FIGURE 52.TOP WINNING STRATEGIES, BY COMPANY, 2018–2021*
FIGURE 53.PLAYER POSITIONING OF TOP 10 KEY PLAYERS
FIGURE 54.ABBOTT LABORATORIES: R&D EXPENDITURE, 2018–2020 ($MILLION)
FIGURE 55.ABBOTT LABORATORIES: NET SALES, 2018–2020 ($MILLION)
FIGURE 56.ABBOTT LABORATORIES: REVENUE SHARE BY SEGMENT, 2020 (%)
FIGURE 57.ABBOTT LABORATORIES: REVENUE SHARE BY REGION, 2020 (%)
FIGURE 58.GLANBIA PLC: R&D EXPENDITURE, 2018–2020 ($MILLION)
FIGURE 59.GLANBIA PLC: NET SALES, 2018–2020 ($MILLION)
FIGURE 60.GLANBIA PLC: REVENUE SHARE BY SEGMENT, 2020(%)
FIGURE 61.GLANBIA PLC: REVENUE SHARE BY REGION, 2020 (%)
FIGURE 62.OTSUKA HOLDINGS CO., LTD.: R&D EXPENDITURE, 2018–2020 ($MILLION)
FIGURE 63.OTSUKA HOLDINGS CO., LTD.: NET SALES, 2018–2020 ($MILLION)
FIGURE 64.OTSUKA HOLDINGS CO., LTD.: REVENUE SHARE BY SEGMENT, 2020 (%)
FIGURE 65.PEPSICO, INC.: R&D EXPENDITURE, 2018–2020 ($MILLION)
FIGURE 66.PEPSICO, INC.: NET SALES, 2018–2020 ($MILLION)
FIGURE 67.PEPSICO, INC.: REVENUE SHARE BY SEGMENT, 2020 (%)
FIGURE 68.POST HOLDINGS, INC.: R&D EXPENDITURE, 2018-2020 ($MILLION)
FIGURE 69.POST HOLDINGS, INC.: NET SALES, 2018-2020 ($MILLION)
FIGURE 70.POST HOLDINGS, INC.: REVENUE SHARE BY SEGMENT, 2020 (%)
FIGURE 71.RECKITT BENCKISER GROUP PLC.: R&D EXPENDITURE, 2018–2020 ($MILLION)
FIGURE 72.RECKITT BENCKISER GROUP PLC.: NET SALES, 2018–2020 ($MILLION)
FIGURE 73.RECKITT BENCKISER GROUP PLC.: REVENUE SHARE BY SEGMENT, 2018 (%)
FIGURE 74.RECKITT BENCKISER GROUP PLC.: REVENUE SHARE BY REGION, 2018 (%)
FIGURE 75.THE COCA-COLA COMPANY : NET SALES, 2018–2020 ($MILLION)
FIGURE 76.THE COCA-COLA COMPANY: REVENUE SHARE BY SEGMENT, 2020 (%)
FIGURE 77.THE COCA-COLA COMPANY: REVENUE SHARE BY REGION, 2020 (%)
FIGURE 78.YAKULT HONSHA CO., LTD.: R&D EXPENDITURE, 2018–2020 ($MILLION)
FIGURE 79.YAKULT HONSHA CO., LTD.: NET SALES, 2018–2020 ($MILLION)
FIGURE 80.YAKULT HONSHA CO., LTD.: REVENUE SHARE BY SEGMENT, 2020 (%)
FIGURE 81.YAKULT HONSHA CO., LTD.: REVENUE SHARE BY REGION, 2020 (%)
Recent years have seen a major increase in the awareness of consumers regarding health, fitness, and sports activities. This increase in awareness has caused an upsurge in the number of people who partake in such activates and also choose such activities as a profession. In order to obtain optimum performance and results out of such strenuous activities, the body needs nourishment and nutrition and this need of the body is fulfilled by the use of sports nutrition products.
Most of the sports nutrition products available in the market aim at healing the body post strenuous activities and providing nutrition to the body in order to boost the performance of the athletes or gym goers and to provide speedy recovery. This helps in increasing the time for which the consumer can carry out physical activities and help in reducing the time span in between two session of activities. Moreover, the use of such products helps provide more energy and supplement the body with essential nutrients and minerals, which significantly improve the results and the outputs of the workout or the athletic activities carried out by the consumers.
The increasing use of sports nutrition products amongst casual consumers is due to the increase in the trend of consuming healthy and nutritious foods and beverages. Greater use of organic and vegan ingredients in the production of sports nutrition products in also helping in increasing the customer base for such products. Rapidly increasing sales of such products via online channels will also help increase the reach of the market, thus increasing the customer base.
A. $5,770 is the total market value of the sports nutrition market report.
A. 2021-2030 would be the forecast period in the sports nutrition market report?
A. 2020 is the base year calculated in the sports nutrition market report
A. Abbott Nutrition, Inc., Clif Bar & Company, Glanbia Plc., and GNC Holdings are the top companies hold the market share in the sports nutrition market.
A. Energy bars is the most influencing segment growing in the sports nutrition market report
A. Protein powder segment holds the maximum market share of the sports nutrition market.
A. Company profiles have been selected on the basis of their market growth and market share.
A. 67.9 billion is the market value of the Sports Nutrition Market in 2020.
Start reading instantly.
This Report and over 67,404+ more Reports, Available with Avenue Library. T&C*.
Enterprise
License/PDF
Library
Membership
*Taxes/Fees, if applicable will be added during checkout. All prices in USD
To ensure high-level data integrity, accurate analysis, and impeccable forecasts
For complete satisfaction
On-demand customization of scope of the report to exactly meet your needs
Targeted market view to provide pertinent information and save time of readers
Get insights on topics that are crucial for your business. Stay abreast of your interest areas.
Get Industry Data AlertsTo ensure high-level data integrity, accurate analysis, and impeccable forecasts
For complete satisfaction
On-demand customization of scope of the report to exactly meet your needs
Targeted market view to provide pertinent information and save time of readers