0
New
New
2023
Food Ingredients Market

Food Ingredients Market

by Type (Flavors, Color additives, Preservatives, Fat replacers, Sweeteners, Stabilizers, Emulsifiers, and Binders, Thickeners, pH control agents, Nutrients, Others), by Application (Food and Beverages, Nutraceuticals, Animal feed): Global Opportunity Analysis and Industry Forecast, 2022-2031

Report Code: A11028
May 2023 | Pages: 246
Tables: 238
Charts: 92
  • Formats*:

  • pdf

    Single User License, Five User
    License & Enterprise User License

  • xls

    Data Pack Excel License

  • ppt

    It comes with the additional cost
    of $2500.00 contact sales.


Food Ingredients Market Research, 2031

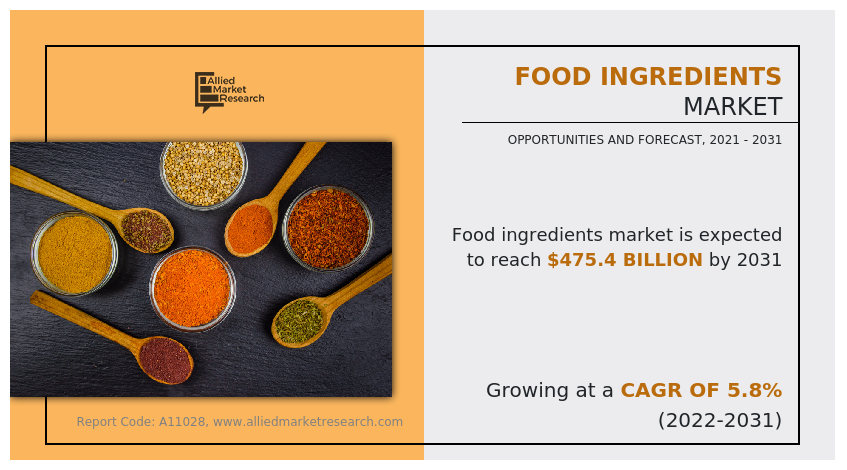
The global food ingredients market size was valued at $270.2 billion in 2021, and is projected to reach $475.4 billion by 2031, growing at a CAGR of 5.8% from 2022 to 2031.

During the post-COVID era, the popularity of organic and functional food ingredients has increased among the global population. Consumers are aware of the benefit and are looking for functional and organic food to add to their diet to improve their health. The rise in demand for functional food ingredients offers an opportunity for the food ingredients market to grow.

Food Ingredients Market


Food ingredients are additives that are added to food mixtures to obtain the desired result. Food ingredients add taste, color, texture, gloss, viscosity, pH balance, and offer emulsion & stability.

The COVID-19 pandemic affected the food ingredients market as many countries considered food ingredients as non-essential items during the pandemic. The government's action affected customers since they were unable to purchase items during the government-mandated closure, thus affecting customer demand for the products. Furthermore, due to limits on the functioning of restaurants, bars, and geographically specialized sales channels, government-enacted stay-at-home directives have significantly limited the purchase of food ingredients for commercial use.

Food ingredients such as sweeteners, emulsifiers, thickeners, and stabilizers are essential food ingredients that are used across the processed food & beverage sector for manufacturing packed foods. It provides flavor, texture, and viscosity, and acts as a preservative due to the high osmotic pressure generated by sugar solutions. On the other hand, the global population is growing with time, and individuals' work pressure is increasing, leading them to seek out processed and packaged foods to save time and satisfy their hunger. Moreover, the availability of processed food has increased over the years, which has influenced the eating habits of consumers. According to United Nations Children's Fund (UNICEF) in 2019-2020, school-aged teenagers consumed processed foods: 42% consumed carbonated sugary sodas at least once a day, and 46% ate fast food at least once a week. The increased demand for processed packaged foods is driving the need for sweeteners by the food manufacturing companies to carry on the production to cater to the market demand. The rise in demand and surge in sales of processed food fuel the food ingredients market growth.

Textiles, medicine, paper manufacturing, bioplastics, and many more sectors use starch extensively. The use of starch has been witnessed to increase significantly in food processing, where it functions as both a stabilizer and an emulsifier to improve food quality. Long-term stabilization in food emulsion systems is ascribed to starch-based emulsifiers derived from micro and nanoparticles, hence increasing food structure, and preserving ability. These starch-based emulsifiers were created using a variety of processes, including hydrolysis, cold gelatinization, dissolution-precipitation, sedimentation, encapsulation, and the addition of hydrophobic components. As a result, starch-based emulsifiers that successfully bind emulsion interfaces are produced. These emulsifiers effectively stabilize ”Pickering” emulsions, which are well-known for their high stability.

An upsurge in demand for natural colors from various end-use industries, including food & beverages, bakery & confectionery, dairy products, meat & poultry, and seafood is expected to have a positive impact on the utilization of natural sources such as carotenoids, curcumin, anthocyanin, and carmine. This factor is expected to significantly contribute to the growth of the market during the forecast period. The clean label trend indicates that the food is prepared with natural colors and flavors. Furthermore, consumers are opting for alternatives to synthetic colors, and their increasing preference for natural colors is expected to drive the demand for clean-label food color ingredients, thereby supplementing the global market growth. Natural colors are free of genetically modified organisms (GMO) and allergens, which act as antioxidants & coloring agents and protect the body against cellular damage, chronic diseases, and the effects of aging. For instance, red sandalwood offers wound-healing properties and is used in Ayurvedic treatment. Thus, the rise in awareness about the health benefits associated with natural colorants provides the food ingredients market opportunity for growth. Moreover, the rise in consumer awareness of the usage of natural colors in food products has increased in the last few years. This factor creates further opportunities for manufacturers to focus on R&D activities for the production of advanced natural colors with superior properties, including pH and heat stability.

The rise in popularity of clean-label color products is attributable to a rise in health concerns among consumers and an increase in awareness concerning the health benefits associated with organic food colors. Consumer perception of organically grown food is that they are healthy and serve as a nutritious alternative to conventionally grown products. The array of organic color products now available and the retail channels through which they are sold have evolved in the market for food color products, which significantly contribute toward market expansion. In addition, a rise in awareness of medical advantages associated with organic food colors is anticipated to drive the demand for natural nourishment and drinks. GMO-free content, nutrient richness, zero growth hormones, zero antibiotics, fewer pesticides, improved freshness levels, and better environmental stability are the factors that attract a large consumer base toward these clean-label color products.

Corn and wheat were considered the key raw materials for the production of starch; however, recent years have seen rapid expansion in the raw material base used for the manufacturing of food starch. For instance, pea starch has gained wide traction in the last few years, as it serves as a rich source of amylose. Furthermore, it possesses enhanced thickening and gelling properties as compared to its counterparts. In addition, pea starch has higher temperature & acid resistance as well as superior shear stability. Furthermore, starch is now extracted from rice, as rice starch has high freeze-thaw stability. Thus, expanding the raw material base for manufacturing starch is expected to provide flexibility for the manufacturers and reduce dependency on a limited number of crops, thereby contributing to global market growth.

The global food & beverage industry witnessed an upsurge in demand for clean-label ingredients. According to AMR analysis, more than 60% of Americans consider natural products as better, and more than 51% actively seek natural ingredients in their food products while making food purchase decisions. To cater to the growing demand for clean-label ingredients, engaged stakeholders in the industry are now venturing into the production of clean-label starch. For instance, Beneo-Remy developed natural, native, and clean-label starch having performance comparable to chemically modified starches. Similarly, Cargill is involved in the production of clean-label starch and is actively marketing the same through the SimPure brand. Thus, an increase in the trend of clean-label food products is anticipated to provide remunerative opportunities for the players operating in the food ingredients industry.

The small intestine prevents the digestion of resistant starch; thus, it enters the large intestine where bacteria present in the large intestine ferment it. Resistant starch aids in lowering cholesterol and fats. Furthermore, it decreases the production of new fat cells. In addition, it alleviates irritable bowel syndrome, constipation, diverticulitis, and ulcerative colitis, thus helping in the improvement of digestion. Furthermore, it enhances mineral absorption and prevents the development of abnormal bacterial cells in the colon. Furthermore, resistant starch helps in the improvement of insulin sensitivity via alterations in fatty acid flux between fat cells and muscle. Thus, the advantages offered by resistant starch are anticipated to offer remunerative opportunities for market expansion during the forecast period.

The food ingredients market is segmented into type, application, and region. Depending on the type, the market is classified into flavors, color additives, preservatives, fat replacers, sweeteners, stabilizers, emulsifiers, & binders, thickeners, pH control agents, nutrients, and others. Depending on the application, it is segregated into food & beverages, nutraceuticals, and animal feed. Region-wise, it is analyzed across North America (the U.S., Canada, and Mexico), Europe (Germany, the UK, France, Russia, Italy, Spain, and the rest of Europe), Asia-Pacific (China, India, Japan, South Korea, Australia, and rest of Asia-Pacific), and LAMEA (Brazil, Argentina, UAE, South Africa, and rest of LAMEA).

According to the food ingredients market analysis, on the basis of type, the sweetener segment gained a major share in the global market in 2021 and is expected to sustain its market share during the food ingredients market forecast period. Sweeteners are an essential food ingredient that is used across the processed food & beverage sector for manufacturing packed foods. It provides a sweet flavor and acts as a preservative due to the high osmotic pressure generated by sugar solutions. On the other hand, the global population is growing with time, and individuals' work pressure is increasing, leading them to seek out processed and packaged foods to save time and satisfy their hunger. Moreover, the availability of processed food has increased over the years, which has influenced the eating habits of consumers. According to United Nations Children's Fund (UNICEF) in 2019-2020, school-aged teenagers consumed processed foods: 42% consumed carbonated sugary sodas at least once a day, and 46% ate fast food at least once a week.

Food Ingredients Market

According to food ingredients market trends, on the basis of application, the food & beverages segment gained a major share in the global market in 2021 and is expected to sustain its market share during the forecast period. The increasing growth rate of the global population is fueling the demand for food products in the market by consumers. Moreover, the hectic schedule of the consumers, lack of time for food preparation, and increasing work pressure is forcing the consumers to look for fast food alternatives. Fast-food manufacturing companies are trying to improve the quality and shelf life of their products to cater to the food ingredients market demand. Therefore, there is a high requirement for food ingredients in the food & beverages industry to continue their production process which would  increase the  overall food ingredients market size

Food Ingredients Market

On the basis of region, Asia-Pacific dominated the food ingredients industry in 2021 and is expected to remain dominant during the forecast period. The dominance of the gr in Asia-Pacific is largely due to the deep product knowledge among the food & nutraceutical companies and the increase in usage of several types of food ingredients in functional foods to entice the interest of the consumers.

Food Ingredients Market

Players operating in the global food ingredients market have adopted various developmental strategies to expand their food ingredients market share, increase profitability, and remain competitive in the market. The key players profiled in this report include Ajinomoto, Inc., Archer Daniels Midland Company, Associated British Foods plc, Cargill, Incorporated, Celanese Corporation, DuPont de Nemours, Inc. (Danisco), Ingredion Incorporated (TIC Gums, Inc), Kerry Group, Roquette Freres, Südzucker Group (BENEO), Tate and Lyle PLC, Akzonobel N.V., BASF SE, Clariant AG, Evonik Industries AG, Koninklijke DSM N.V., Solvay SA, Kemin Industries, Inc., Chemelco International B.V., Givaudan International S.A. (Naturex S.A.), Palsgaard A/S, Univar, Inc., Corbion NV, Huber Corporation(CP Kelco U.S., Inc.), Kao Corporation, Nexira SAS, Jungbunzlauer Holding AG, Ashland Global Holdings Inc., Fuerst Day Lawson Limited, ATP Group, Novozymes, Aromata Group S.r.L (Fiorio Colori S.p.A), Kalsec, Inc., Glanbia PLC (Ireland), and Mead Johnson & Company, LLC.

Key Benefits For Stakeholders

  • This report provides a quantitative analysis of the market segments, current trends, estimations, and dynamics of the food ingredients market analysis from 2021 to 2031 to identify the prevailing food ingredients market opportunity.
  • The market research is offered along with information related to key drivers, restraints, and opportunities.
  • Porter's five forces analysis highlights the potency of buyers and suppliers to enable stakeholders make profit-oriented business decisions and strengthen their supplier-buyer network.
  • In-depth analysis of the food ingredients market segmentation assists to determine the prevailing market opportunities.
  • Major countries in each region are mapped according to their revenue contribution to the global market.
  • Market player positioning facilitates benchmarking and provides a clear understanding of the present position of the market players.
  • The report includes the analysis of the regional as well as global food ingredients market trends, key players, market segments, application areas, and market growth strategies.

Food Ingredients Market Report Highlights

Aspects Details
Market Size By 2031 USD 475.4 billion
Growth Rate CAGR of 5.8%
Forecast period 2021 - 2031
Report Pages 246
By Type
  • Nutrients
  • Others
  • Flavors
  • Color additives
  • Preservatives
  • Fat replacers
  • Sweeteners
    • Sub-Type
      • Sucrose
      • Starch sweeteners
      • High-intensity sweeteners
      • Sugar substitutes
  • Stabilizers, Emulsifiers, and Binders
  • Thickeners
  • pH control agents
By Application
  • Food and Beverages
    • Sub-Type
      • Beverages
      • Sauces, Dressing, and Condiments
      • Bakery and Confectionery
      • Ready to eat meal
      • Dairy products
      • Others
  • Nutraceuticals
  • Animal feed
By Region
  • North America  (U.S., Canada, Mexico)
  • Europe  (Germany, UK, France, Russia, Italy, Spain, Rest of Europe)
  • Asia-Pacific  (China, Japan, India, South Korea, Australia, Rest of Asia-Pacific)
  • LAMEA  (Brazil, Argentina, UAE, South Africa, Rest of LAMEA)
Key Market Players BASF SE, Ingredion Incorporated, ATP Group, Kemin Industries, Inc., RECKITT BENCKISER GROUP PLC., Jungbunzlauer Suisse AG, Givaudan International SA, Corbion Inc., Solvay, Celanese Corporation, Kalsec, Inc., Koninklijke DSM N.V., Univar Solutions Inc., Ashland, FDL Ltd, Cargill, Incorporated, J.M. Huber Corporation, Glanbia PLC, Associated British Foods plc, Sdzucker AG, Chemelco International B.V., Kerry Group Plc, Akzo Nobel N.V., Ajinomoto Co., Inc., Clariant, Palsgaard A/S, Evonik, DuPont de Nemours, Inc., Roquette Freres, Nexira, AromataGroup SRL, Tate and Lyle, Plc., Novozymes A/S, Kao Corporation, Archer Daniels Midland Company

Analyst Review

According to CXOs, "One sweetener’s loss is another sweetener’s gain." The occurrence of obesity and weight-related concerns in individuals is rapidly growing, prompting people to change toward healthier eating options. Obesity raises an individual's risk of diabetes, cardiovascular mortality, and hypertension. Sugary products are not ideal for long-term consumption; therefore, the popularity of plant-based and artificially synthesized sweeteners is expected to increase in the upcoming years.

Hectic lifestyles of the urban population as well as a surge in the working population have reduced the time available for the consumption of cooked meals. This has encouraged the population to shift toward the consumption of processed food to fulfill hunger. As a result, to meet their calorie requirements, the population is migrating toward the consumption of sugary food.

In the case of emulsifiers, phospholipids are semi-synthetic emulsifiers that are widely employed in the pharmaceutical business as wetting agents, emulsifiers, and builders or components of various lipid mesophases, including liposomes, micelles, mixed micelles, inverted micelles, and cubosomes. These functional qualities are used in a variety of pharmaceutical formulations, including suspensions, emulsions, solid dispersions, lipid nanoparticles, and drug/phospholipid complexes. In terms of their physiological significance, phospholipids exhibit an extremely low toxicity profile and may be administered by any route, including injectable, oral, and topical.

The CXOs further added that manufacturers are focusing on displaying the transparency of the ingredients, which are added to the product, as the majority of the consumers choose products by reading the labels. In addition, consumers prefer products with organic and plant-based ingredients. Moreover, the increasing application of functional food in sports nutrition and clinical nutrition further boost the growth of the functional food ingredients market.

Furthermore, the rise in the rate of internet penetration around the major parts of the world makes way for manufacturers to initiate several key online marketing programs. These online platforms are one of the easiest ways to create awareness about the benefits of food fortified with functional ingredients with respect to various diseases including cardiovascular diseases, cancer, and obesity-linked diseases. Hence, tapping into such markets is expected to create potential opportunities for the expansion of the global functional food ingredients market.

 
  • CHAPTER 1: INTRODUCTION

    • 1.1. Report description

    • 1.2. Key market segments

    • 1.3. Key benefits to the stakeholders

    • 1.4. Research Methodology

      • 1.4.1. Primary research

      • 1.4.2. Secondary research

      • 1.4.3. Analyst tools and models

  • CHAPTER 2: EXECUTIVE SUMMARY

    • 2.1. CXO Perspective

  • CHAPTER 3: MARKET OVERVIEW

    • 3.1. Market definition and scope

    • 3.2. Key findings

      • 3.2.1. Top impacting factors

      • 3.2.2. Top investment pockets

    • 3.3. Porter’s five forces analysis

    • 3.4. Market dynamics

      • 3.4.1. Drivers

      • 3.4.2. Restraints

      • 3.4.3. Opportunities

    • 3.5. COVID-19 Impact Analysis on the market

    • 3.6. Market Share Analysis

    • 3.7. Pricing Analysis

    • 3.8. Value Chain Analysis

  • CHAPTER 4: FOOD INGREDIENTS MARKET, BY TYPE

    • 4.1. Overview

      • 4.1.1. Market size and forecast

    • 4.2. Flavors

      • 4.2.1. Key market trends, growth factors and opportunities

      • 4.2.2. Market size and forecast, by region

      • 4.2.3. Market share analysis by country

    • 4.3. Color additives

      • 4.3.1. Key market trends, growth factors and opportunities

      • 4.3.2. Market size and forecast, by region

      • 4.3.3. Market share analysis by country

    • 4.4. Preservatives

      • 4.4.1. Key market trends, growth factors and opportunities

      • 4.4.2. Market size and forecast, by region

      • 4.4.3. Market share analysis by country

    • 4.5. Fat replacers

      • 4.5.1. Key market trends, growth factors and opportunities

      • 4.5.2. Market size and forecast, by region

      • 4.5.3. Market share analysis by country

    • 4.6. Sweeteners

      • 4.6.1. Key market trends, growth factors and opportunities

      • 4.6.2. Market size and forecast, by region

      • 4.6.3. Market share analysis by country

      • 4.6.4. Sweeteners Food Ingredients Market by Sub-Type

        • 4.6.4.1. Sucrose Market size and forecast, by region
        • 4.6.4.2. Starch sweeteners Market size and forecast, by region
        • 4.6.4.3. High-intensity sweeteners Market size and forecast, by region
        • 4.6.4.4. Sugar substitutes Market size and forecast, by region
    • 4.7. Stabilizers, Emulsifiers, and Binders

      • 4.7.1. Key market trends, growth factors and opportunities

      • 4.7.2. Market size and forecast, by region

      • 4.7.3. Market share analysis by country

    • 4.8. Thickeners

      • 4.8.1. Key market trends, growth factors and opportunities

      • 4.8.2. Market size and forecast, by region

      • 4.8.3. Market share analysis by country

    • 4.9. pH control agents

      • 4.9.1. Key market trends, growth factors and opportunities

      • 4.9.2. Market size and forecast, by region

      • 4.9.3. Market share analysis by country

    • 4.10. Nutrients

      • 4.10.1. Key market trends, growth factors and opportunities

      • 4.10.2. Market size and forecast, by region

      • 4.10.3. Market share analysis by country

    • 4.11. Others

      • 4.11.1. Key market trends, growth factors and opportunities

      • 4.11.2. Market size and forecast, by region

      • 4.11.3. Market share analysis by country

  • CHAPTER 5: FOOD INGREDIENTS MARKET, BY APPLICATION

    • 5.1. Overview

      • 5.1.1. Market size and forecast

    • 5.2. Food and Beverages

      • 5.2.1. Key market trends, growth factors and opportunities

      • 5.2.2. Market size and forecast, by region

      • 5.2.3. Market share analysis by country

      • 5.2.4. Food and Beverages Food Ingredients Market by Sub-Type

        • 5.2.4.1. Beverages Market size and forecast, by region
        • 5.2.4.2. Sauces, Dressing, and Condiments Market size and forecast, by region
        • 5.2.4.3. Bakery and Confectionery Market size and forecast, by region
        • 5.2.4.4. Ready to eat meal Market size and forecast, by region
        • 5.2.4.5. Dairy products Market size and forecast, by region
        • 5.2.4.6. Others Market size and forecast, by region
    • 5.3. Nutraceuticals

      • 5.3.1. Key market trends, growth factors and opportunities

      • 5.3.2. Market size and forecast, by region

      • 5.3.3. Market share analysis by country

    • 5.4. Animal feed

      • 5.4.1. Key market trends, growth factors and opportunities

      • 5.4.2. Market size and forecast, by region

      • 5.4.3. Market share analysis by country

  • CHAPTER 6: FOOD INGREDIENTS MARKET, BY REGION

    • 6.1. Overview

      • 6.1.1. Market size and forecast By Region

    • 6.2. North America

      • 6.2.1. Key trends and opportunities

      • 6.2.2. Market size and forecast, by Type

        • 6.2.2.1. North America Sweeteners Food Ingredients Market by Sub-Type
      • 6.2.3. Market size and forecast, by Application

        • 6.2.3.1. North America Food and Beverages Food Ingredients Market by Sub-Type
      • 6.2.4. Market size and forecast, by country

        • 6.2.4.1. U.S.
          • 6.2.4.1.1. Key market trends, growth factors and opportunities
          • 6.2.4.1.2. Market size and forecast, by Type
          • 6.2.4.1.3. Market size and forecast, by Application
        • 6.2.4.2. Canada
          • 6.2.4.2.1. Key market trends, growth factors and opportunities
          • 6.2.4.2.2. Market size and forecast, by Type
          • 6.2.4.2.3. Market size and forecast, by Application
        • 6.2.4.3. Mexico
          • 6.2.4.3.1. Key market trends, growth factors and opportunities
          • 6.2.4.3.2. Market size and forecast, by Type
          • 6.2.4.3.3. Market size and forecast, by Application
    • 6.3. Europe

      • 6.3.1. Key trends and opportunities

      • 6.3.2. Market size and forecast, by Type

        • 6.3.2.1. Europe Sweeteners Food Ingredients Market by Sub-Type
      • 6.3.3. Market size and forecast, by Application

        • 6.3.3.1. Europe Food and Beverages Food Ingredients Market by Sub-Type
      • 6.3.4. Market size and forecast, by country

        • 6.3.4.1. Germany
          • 6.3.4.1.1. Key market trends, growth factors and opportunities
          • 6.3.4.1.2. Market size and forecast, by Type
          • 6.3.4.1.3. Market size and forecast, by Application
        • 6.3.4.2. UK
          • 6.3.4.2.1. Key market trends, growth factors and opportunities
          • 6.3.4.2.2. Market size and forecast, by Type
          • 6.3.4.2.3. Market size and forecast, by Application
        • 6.3.4.3. France
          • 6.3.4.3.1. Key market trends, growth factors and opportunities
          • 6.3.4.3.2. Market size and forecast, by Type
          • 6.3.4.3.3. Market size and forecast, by Application
        • 6.3.4.4. Russia
          • 6.3.4.4.1. Key market trends, growth factors and opportunities
          • 6.3.4.4.2. Market size and forecast, by Type
          • 6.3.4.4.3. Market size and forecast, by Application
        • 6.3.4.5. Italy
          • 6.3.4.5.1. Key market trends, growth factors and opportunities
          • 6.3.4.5.2. Market size and forecast, by Type
          • 6.3.4.5.3. Market size and forecast, by Application
        • 6.3.4.6. Spain
          • 6.3.4.6.1. Key market trends, growth factors and opportunities
          • 6.3.4.6.2. Market size and forecast, by Type
          • 6.3.4.6.3. Market size and forecast, by Application
        • 6.3.4.7. Rest of Europe
          • 6.3.4.7.1. Key market trends, growth factors and opportunities
          • 6.3.4.7.2. Market size and forecast, by Type
          • 6.3.4.7.3. Market size and forecast, by Application
    • 6.4. Asia-Pacific

      • 6.4.1. Key trends and opportunities

      • 6.4.2. Market size and forecast, by Type

        • 6.4.2.1. Asia-Pacific Sweeteners Food Ingredients Market by Sub-Type
      • 6.4.3. Market size and forecast, by Application

        • 6.4.3.1. Asia-Pacific Food and Beverages Food Ingredients Market by Sub-Type
      • 6.4.4. Market size and forecast, by country

        • 6.4.4.1. China
          • 6.4.4.1.1. Key market trends, growth factors and opportunities
          • 6.4.4.1.2. Market size and forecast, by Type
          • 6.4.4.1.3. Market size and forecast, by Application
        • 6.4.4.2. Japan
          • 6.4.4.2.1. Key market trends, growth factors and opportunities
          • 6.4.4.2.2. Market size and forecast, by Type
          • 6.4.4.2.3. Market size and forecast, by Application
        • 6.4.4.3. India
          • 6.4.4.3.1. Key market trends, growth factors and opportunities
          • 6.4.4.3.2. Market size and forecast, by Type
          • 6.4.4.3.3. Market size and forecast, by Application
        • 6.4.4.4. South Korea
          • 6.4.4.4.1. Key market trends, growth factors and opportunities
          • 6.4.4.4.2. Market size and forecast, by Type
          • 6.4.4.4.3. Market size and forecast, by Application
        • 6.4.4.5. Australia
          • 6.4.4.5.1. Key market trends, growth factors and opportunities
          • 6.4.4.5.2. Market size and forecast, by Type
          • 6.4.4.5.3. Market size and forecast, by Application
        • 6.4.4.6. Rest of Asia-Pacific
          • 6.4.4.6.1. Key market trends, growth factors and opportunities
          • 6.4.4.6.2. Market size and forecast, by Type
          • 6.4.4.6.3. Market size and forecast, by Application
    • 6.5. LAMEA

      • 6.5.1. Key trends and opportunities

      • 6.5.2. Market size and forecast, by Type

        • 6.5.2.1. LAMEA Sweeteners Food Ingredients Market by Sub-Type
      • 6.5.3. Market size and forecast, by Application

        • 6.5.3.1. LAMEA Food and Beverages Food Ingredients Market by Sub-Type
      • 6.5.4. Market size and forecast, by country

        • 6.5.4.1. Brazil
          • 6.5.4.1.1. Key market trends, growth factors and opportunities
          • 6.5.4.1.2. Market size and forecast, by Type
          • 6.5.4.1.3. Market size and forecast, by Application
        • 6.5.4.2. Argentina
          • 6.5.4.2.1. Key market trends, growth factors and opportunities
          • 6.5.4.2.2. Market size and forecast, by Type
          • 6.5.4.2.3. Market size and forecast, by Application
        • 6.5.4.3. UAE
          • 6.5.4.3.1. Key market trends, growth factors and opportunities
          • 6.5.4.3.2. Market size and forecast, by Type
          • 6.5.4.3.3. Market size and forecast, by Application
        • 6.5.4.4. South Africa
          • 6.5.4.4.1. Key market trends, growth factors and opportunities
          • 6.5.4.4.2. Market size and forecast, by Type
          • 6.5.4.4.3. Market size and forecast, by Application
        • 6.5.4.5. Rest of LAMEA
          • 6.5.4.5.1. Key market trends, growth factors and opportunities
          • 6.5.4.5.2. Market size and forecast, by Type
          • 6.5.4.5.3. Market size and forecast, by Application
  • CHAPTER 7: COMPETITIVE LANDSCAPE

    • 7.1. Introduction

    • 7.2. Top winning strategies

    • 7.3. Product Mapping of Top 10 Player

    • 7.4. Competitive Dashboard

    • 7.5. Competitive Heatmap

    • 7.6. Top player positioning, 2021

  • CHAPTER 8: COMPANY PROFILES

    • 8.1. Ajinomoto Co., Inc.

      • 8.1.1. Company overview

      • 8.1.2. Key Executives

      • 8.1.3. Company snapshot

      • 8.1.4. Operating business segments

      • 8.1.5. Product portfolio

      • 8.1.6. Business performance

    • 8.2. Archer Daniels Midland Company

      • 8.2.1. Company overview

      • 8.2.2. Key Executives

      • 8.2.3. Company snapshot

      • 8.2.4. Operating business segments

      • 8.2.5. Product portfolio

      • 8.2.6. Business performance

      • 8.2.7. Key strategic moves and developments

    • 8.3. Associated British Foods plc

      • 8.3.1. Company overview

      • 8.3.2. Key Executives

      • 8.3.3. Company snapshot

      • 8.3.4. Operating business segments

      • 8.3.5. Product portfolio

      • 8.3.6. Business performance

    • 8.4. Cargill, Incorporated

      • 8.4.1. Company overview

      • 8.4.2. Key Executives

      • 8.4.3. Company snapshot

      • 8.4.4. Operating business segments

      • 8.4.5. Product portfolio

      • 8.4.6. Business performance

    • 8.5. Celanese Corporation

      • 8.5.1. Company overview

      • 8.5.2. Key Executives

      • 8.5.3. Company snapshot

      • 8.5.4. Operating business segments

      • 8.5.5. Product portfolio

      • 8.5.6. Business performance

    • 8.6. DuPont de Nemours, Inc.

      • 8.6.1. Company overview

      • 8.6.2. Key Executives

      • 8.6.3. Company snapshot

      • 8.6.4. Operating business segments

      • 8.6.5. Product portfolio

      • 8.6.6. Business performance

    • 8.7. Ingredion Incorporated

      • 8.7.1. Company overview

      • 8.7.2. Key Executives

      • 8.7.3. Company snapshot

      • 8.7.4. Operating business segments

      • 8.7.5. Product portfolio

      • 8.7.6. Business performance

      • 8.7.7. Key strategic moves and developments

    • 8.8. Kerry Group Plc

      • 8.8.1. Company overview

      • 8.8.2. Key Executives

      • 8.8.3. Company snapshot

      • 8.8.4. Operating business segments

      • 8.8.5. Product portfolio

      • 8.8.6. Business performance

    • 8.9. Roquette Freres

      • 8.9.1. Company overview

      • 8.9.2. Key Executives

      • 8.9.3. Company snapshot

      • 8.9.4. Operating business segments

      • 8.9.5. Product portfolio

    • 8.10. Sdzucker AG

      • 8.10.1. Company overview

      • 8.10.2. Key Executives

      • 8.10.3. Company snapshot

      • 8.10.4. Operating business segments

      • 8.10.5. Product portfolio

      • 8.10.6. Business performance

    • 8.11. Tate and Lyle, Plc.

      • 8.11.1. Company overview

      • 8.11.2. Key Executives

      • 8.11.3. Company snapshot

      • 8.11.4. Operating business segments

      • 8.11.5. Product portfolio

      • 8.11.6. Business performance

    • 8.12. Akzo Nobel N.V.

      • 8.12.1. Company overview

      • 8.12.2. Key Executives

      • 8.12.3. Company snapshot

      • 8.12.4. Operating business segments

      • 8.12.5. Product portfolio

      • 8.12.6. Business performance

    • 8.13. BASF SE

      • 8.13.1. Company overview

      • 8.13.2. Key Executives

      • 8.13.3. Company snapshot

      • 8.13.4. Operating business segments

      • 8.13.5. Product portfolio

      • 8.13.6. Business performance

    • 8.14. Clariant

      • 8.14.1. Company overview

      • 8.14.2. Key Executives

      • 8.14.3. Company snapshot

      • 8.14.4. Operating business segments

      • 8.14.5. Product portfolio

      • 8.14.6. Business performance

    • 8.15. Evonik

      • 8.15.1. Company overview

      • 8.15.2. Key Executives

      • 8.15.3. Company snapshot

      • 8.15.4. Operating business segments

      • 8.15.5. Product portfolio

      • 8.15.6. Business performance

    • 8.16. Koninklijke DSM N.V.

      • 8.16.1. Company overview

      • 8.16.2. Key Executives

      • 8.16.3. Company snapshot

      • 8.16.4. Operating business segments

      • 8.16.5. Product portfolio

      • 8.16.6. Business performance

      • 8.16.7. Key strategic moves and developments

    • 8.17. Solvay

      • 8.17.1. Company overview

      • 8.17.2. Key Executives

      • 8.17.3. Company snapshot

      • 8.17.4. Operating business segments

      • 8.17.5. Product portfolio

      • 8.17.6. Business performance

    • 8.18. Kemin Industries, Inc.

      • 8.18.1. Company overview

      • 8.18.2. Key Executives

      • 8.18.3. Company snapshot

      • 8.18.4. Operating business segments

      • 8.18.5. Product portfolio

      • 8.18.6. Key strategic moves and developments

    • 8.19. Chemelco International B.V.

      • 8.19.1. Company overview

      • 8.19.2. Key Executives

      • 8.19.3. Company snapshot

      • 8.19.4. Operating business segments

      • 8.19.5. Product portfolio

    • 8.20. Givaudan International SA

      • 8.20.1. Company overview

      • 8.20.2. Key Executives

      • 8.20.3. Company snapshot

      • 8.20.4. Operating business segments

      • 8.20.5. Product portfolio

      • 8.20.6. Business performance

      • 8.20.7. Key strategic moves and developments

    • 8.21. Palsgaard A/S

      • 8.21.1. Company overview

      • 8.21.2. Key Executives

      • 8.21.3. Company snapshot

      • 8.21.4. Operating business segments

      • 8.21.5. Product portfolio

    • 8.22. Univar Solutions Inc.

      • 8.22.1. Company overview

      • 8.22.2. Key Executives

      • 8.22.3. Company snapshot

      • 8.22.4. Operating business segments

      • 8.22.5. Product portfolio

      • 8.22.6. Business performance

    • 8.23. Corbion Inc.

      • 8.23.1. Company overview

      • 8.23.2. Key Executives

      • 8.23.3. Company snapshot

      • 8.23.4. Operating business segments

      • 8.23.5. Product portfolio

      • 8.23.6. Business performance

    • 8.24. J.M. Huber Corporation

      • 8.24.1. Company overview

      • 8.24.2. Key Executives

      • 8.24.3. Company snapshot

      • 8.24.4. Operating business segments

      • 8.24.5. Product portfolio

    • 8.25. Kao Corporation

      • 8.25.1. Company overview

      • 8.25.2. Key Executives

      • 8.25.3. Company snapshot

      • 8.25.4. Operating business segments

      • 8.25.5. Product portfolio

      • 8.25.6. Business performance

    • 8.26. Jungbunzlauer Suisse AG

      • 8.26.1. Company overview

      • 8.26.2. Key Executives

      • 8.26.3. Company snapshot

      • 8.26.4. Operating business segments

      • 8.26.5. Product portfolio

    • 8.27. Ashland

      • 8.27.1. Company overview

      • 8.27.2. Key Executives

      • 8.27.3. Company snapshot

      • 8.27.4. Operating business segments

      • 8.27.5. Product portfolio

      • 8.27.6. Business performance

    • 8.28. Novozymes A/S

      • 8.28.1. Company overview

      • 8.28.2. Key Executives

      • 8.28.3. Company snapshot

      • 8.28.4. Operating business segments

      • 8.28.5. Product portfolio

      • 8.28.6. Business performance

    • 8.29. AromataGroup SRL

      • 8.29.1. Company overview

      • 8.29.2. Key Executives

      • 8.29.3. Company snapshot

      • 8.29.4. Operating business segments

      • 8.29.5. Product portfolio

      • 8.29.6. Key strategic moves and developments

    • 8.30. Kalsec, Inc.

      • 8.30.1. Company overview

      • 8.30.2. Key Executives

      • 8.30.3. Company snapshot

      • 8.30.4. Operating business segments

      • 8.30.5. Product portfolio

    • 8.31. Glanbia PLC

      • 8.31.1. Company overview

      • 8.31.2. Key Executives

      • 8.31.3. Company snapshot

      • 8.31.4. Operating business segments

      • 8.31.5. Product portfolio

    • 8.32. RECKITT BENCKISER GROUP PLC.

      • 8.32.1. Company overview

      • 8.32.2. Key Executives

      • 8.32.3. Company snapshot

      • 8.32.4. Operating business segments

      • 8.32.5. Product portfolio

      • 8.32.6. Business performance

    • 8.33. Nexira

      • 8.33.1. Company overview

      • 8.33.2. Key Executives

      • 8.33.3. Company snapshot

      • 8.33.4. Operating business segments

      • 8.33.5. Product portfolio

      • 8.33.6. Key strategic moves and developments

    • 8.34. FDL Ltd

      • 8.34.1. Company overview

      • 8.34.2. Key Executives

      • 8.34.3. Company snapshot

      • 8.34.4. Operating business segments

      • 8.34.5. Product portfolio

    • 8.35. ATP Group

      • 8.35.1. Company overview

      • 8.35.2. Key Executives

      • 8.35.3. Company snapshot

      • 8.35.4. Operating business segments

      • 8.35.5. Product portfolio

  • LIST OF TABLES

  • TABLE 01. GLOBAL FOOD INGREDIENTS MARKET, BY TYPE, 2021-2031 ($MILLION)
    TABLE 02. FOOD INGREDIENTS MARKET FOR FLAVORS, BY REGION, 2021-2031 ($MILLION)
    TABLE 03. FOOD INGREDIENTS MARKET FOR COLOR ADDITIVES, BY REGION, 2021-2031 ($MILLION)
    TABLE 04. FOOD INGREDIENTS MARKET FOR PRESERVATIVES, BY REGION, 2021-2031 ($MILLION)
    TABLE 05. FOOD INGREDIENTS MARKET FOR FAT REPLACERS, BY REGION, 2021-2031 ($MILLION)
    TABLE 06. FOOD INGREDIENTS MARKET FOR SWEETENERS, BY REGION, 2021-2031 ($MILLION)
    TABLE 07. GLOBAL SWEETENERS FOOD INGREDIENTS MARKET, BY SUB-TYPE, 2021-2031 ($MILLION)
    TABLE 08. FOOD INGREDIENTS MARKET FOR SUCROSE, BY REGION, 2021-2031 ($MILLION)
    TABLE 09. FOOD INGREDIENTS MARKET FOR STARCH SWEETENERS, BY REGION, 2021-2031 ($MILLION)
    TABLE 10. FOOD INGREDIENTS MARKET FOR HIGH-INTENSITY SWEETENERS, BY REGION, 2021-2031 ($MILLION)
    TABLE 11. FOOD INGREDIENTS MARKET FOR SUGAR SUBSTITUTES, BY REGION, 2021-2031 ($MILLION)
    TABLE 12. FOOD INGREDIENTS MARKET FOR STABILIZERS, EMULSIFIERS, AND BINDERS, BY REGION, 2021-2031 ($MILLION)
    TABLE 13. FOOD INGREDIENTS MARKET FOR THICKENERS, BY REGION, 2021-2031 ($MILLION)
    TABLE 14. FOOD INGREDIENTS MARKET FOR PH CONTROL AGENTS, BY REGION, 2021-2031 ($MILLION)
    TABLE 15. FOOD INGREDIENTS MARKET FOR NUTRIENTS, BY REGION, 2021-2031 ($MILLION)
    TABLE 16. FOOD INGREDIENTS MARKET FOR OTHERS, BY REGION, 2021-2031 ($MILLION)
    TABLE 17. GLOBAL FOOD INGREDIENTS MARKET, BY APPLICATION, 2021-2031 ($MILLION)
    TABLE 18. FOOD INGREDIENTS MARKET FOR FOOD AND BEVERAGES, BY REGION, 2021-2031 ($MILLION)
    TABLE 19. GLOBAL FOOD AND BEVERAGES FOOD INGREDIENTS MARKET, BY SUB-TYPE, 2021-2031 ($MILLION)
    TABLE 20. FOOD INGREDIENTS MARKET FOR BEVERAGES, BY REGION, 2021-2031 ($MILLION)
    TABLE 21. FOOD INGREDIENTS MARKET FOR SAUCES, DRESSING, AND CONDIMENTS, BY REGION, 2021-2031 ($MILLION)
    TABLE 22. FOOD INGREDIENTS MARKET FOR BAKERY AND CONFECTIONERY, BY REGION, 2021-2031 ($MILLION)
    TABLE 23. FOOD INGREDIENTS MARKET FOR READY TO EAT MEAL, BY REGION, 2021-2031 ($MILLION)
    TABLE 24. FOOD INGREDIENTS MARKET FOR DAIRY PRODUCTS, BY REGION, 2021-2031 ($MILLION)
    TABLE 25. FOOD INGREDIENTS MARKET FOR OTHERS, BY REGION, 2021-2031 ($MILLION)
    TABLE 26. FOOD INGREDIENTS MARKET FOR NUTRACEUTICALS, BY REGION, 2021-2031 ($MILLION)
    TABLE 27. FOOD INGREDIENTS MARKET FOR ANIMAL FEED, BY REGION, 2021-2031 ($MILLION)
    TABLE 28. FOOD INGREDIENTS MARKET, BY REGION, 2021-2031 ($MILLION)
    TABLE 29. NORTH AMERICA FOOD INGREDIENTS MARKET, BY TYPE, 2021-2031 ($MILLION)
    TABLE 30. NORTH AMERICA SWEETENERS FOOD INGREDIENTS MARKET, BY SUB-TYPE, 2021-2031 ($MILLION)
    TABLE 31. NORTH AMERICA FOOD INGREDIENTS MARKET, BY APPLICATION, 2021-2031 ($MILLION)
    TABLE 32. NORTH AMERICA FOOD AND BEVERAGES FOOD INGREDIENTS MARKET, BY SUB-TYPE, 2021-2031 ($MILLION)
    TABLE 33. NORTH AMERICA FOOD INGREDIENTS MARKET, BY COUNTRY, 2021-2031 ($MILLION)
    TABLE 34. U.S. FOOD INGREDIENTS MARKET, BY TYPE, 2021-2031 ($MILLION)
    TABLE 35. U.S. FOOD INGREDIENTS MARKET, BY APPLICATION, 2021-2031 ($MILLION)
    TABLE 36. CANADA FOOD INGREDIENTS MARKET, BY TYPE, 2021-2031 ($MILLION)
    TABLE 37. CANADA FOOD INGREDIENTS MARKET, BY APPLICATION, 2021-2031 ($MILLION)
    TABLE 38. MEXICO FOOD INGREDIENTS MARKET, BY TYPE, 2021-2031 ($MILLION)
    TABLE 39. MEXICO FOOD INGREDIENTS MARKET, BY APPLICATION, 2021-2031 ($MILLION)
    TABLE 40. EUROPE FOOD INGREDIENTS MARKET, BY TYPE, 2021-2031 ($MILLION)
    TABLE 41. EUROPE SWEETENERS FOOD INGREDIENTS MARKET, BY SUB-TYPE, 2021-2031 ($MILLION)
    TABLE 42. EUROPE FOOD INGREDIENTS MARKET, BY APPLICATION, 2021-2031 ($MILLION)
    TABLE 43. EUROPE FOOD AND BEVERAGES FOOD INGREDIENTS MARKET, BY SUB-TYPE, 2021-2031 ($MILLION)
    TABLE 44. EUROPE FOOD INGREDIENTS MARKET, BY COUNTRY, 2021-2031 ($MILLION)
    TABLE 45. GERMANY FOOD INGREDIENTS MARKET, BY TYPE, 2021-2031 ($MILLION)
    TABLE 46. GERMANY FOOD INGREDIENTS MARKET, BY APPLICATION, 2021-2031 ($MILLION)
    TABLE 47. UK FOOD INGREDIENTS MARKET, BY TYPE, 2021-2031 ($MILLION)
    TABLE 48. UK FOOD INGREDIENTS MARKET, BY APPLICATION, 2021-2031 ($MILLION)
    TABLE 49. FRANCE FOOD INGREDIENTS MARKET, BY TYPE, 2021-2031 ($MILLION)
    TABLE 50. FRANCE FOOD INGREDIENTS MARKET, BY APPLICATION, 2021-2031 ($MILLION)
    TABLE 51. RUSSIA FOOD INGREDIENTS MARKET, BY TYPE, 2021-2031 ($MILLION)
    TABLE 52. RUSSIA FOOD INGREDIENTS MARKET, BY APPLICATION, 2021-2031 ($MILLION)
    TABLE 53. ITALY FOOD INGREDIENTS MARKET, BY TYPE, 2021-2031 ($MILLION)
    TABLE 54. ITALY FOOD INGREDIENTS MARKET, BY APPLICATION, 2021-2031 ($MILLION)
    TABLE 55. SPAIN FOOD INGREDIENTS MARKET, BY TYPE, 2021-2031 ($MILLION)
    TABLE 56. SPAIN FOOD INGREDIENTS MARKET, BY APPLICATION, 2021-2031 ($MILLION)
    TABLE 57. REST OF EUROPE FOOD INGREDIENTS MARKET, BY TYPE, 2021-2031 ($MILLION)
    TABLE 58. REST OF EUROPE FOOD INGREDIENTS MARKET, BY APPLICATION, 2021-2031 ($MILLION)
    TABLE 59. ASIA-PACIFIC FOOD INGREDIENTS MARKET, BY TYPE, 2021-2031 ($MILLION)
    TABLE 60. ASIA-PACIFIC SWEETENERS FOOD INGREDIENTS MARKET, BY SUB-TYPE, 2021-2031 ($MILLION)
    TABLE 61. ASIA-PACIFIC FOOD INGREDIENTS MARKET, BY APPLICATION, 2021-2031 ($MILLION)
    TABLE 62. ASIA-PACIFIC FOOD AND BEVERAGES FOOD INGREDIENTS MARKET, BY SUB-TYPE, 2021-2031 ($MILLION)
    TABLE 63. ASIA-PACIFIC FOOD INGREDIENTS MARKET, BY COUNTRY, 2021-2031 ($MILLION)
    TABLE 64. CHINA FOOD INGREDIENTS MARKET, BY TYPE, 2021-2031 ($MILLION)
    TABLE 65. CHINA FOOD INGREDIENTS MARKET, BY APPLICATION, 2021-2031 ($MILLION)
    TABLE 66. JAPAN FOOD INGREDIENTS MARKET, BY TYPE, 2021-2031 ($MILLION)
    TABLE 67. JAPAN FOOD INGREDIENTS MARKET, BY APPLICATION, 2021-2031 ($MILLION)
    TABLE 68. INDIA FOOD INGREDIENTS MARKET, BY TYPE, 2021-2031 ($MILLION)
    TABLE 69. INDIA FOOD INGREDIENTS MARKET, BY APPLICATION, 2021-2031 ($MILLION)
    TABLE 70. SOUTH KOREA FOOD INGREDIENTS MARKET, BY TYPE, 2021-2031 ($MILLION)
    TABLE 71. SOUTH KOREA FOOD INGREDIENTS MARKET, BY APPLICATION, 2021-2031 ($MILLION)
    TABLE 72. AUSTRALIA FOOD INGREDIENTS MARKET, BY TYPE, 2021-2031 ($MILLION)
    TABLE 73. AUSTRALIA FOOD INGREDIENTS MARKET, BY APPLICATION, 2021-2031 ($MILLION)
    TABLE 74. REST OF ASIA-PACIFIC FOOD INGREDIENTS MARKET, BY TYPE, 2021-2031 ($MILLION)
    TABLE 75. REST OF ASIA-PACIFIC FOOD INGREDIENTS MARKET, BY APPLICATION, 2021-2031 ($MILLION)
    TABLE 76. LAMEA FOOD INGREDIENTS MARKET, BY TYPE, 2021-2031 ($MILLION)
    TABLE 77. LAMEA SWEETENERS FOOD INGREDIENTS MARKET, BY SUB-TYPE, 2021-2031 ($MILLION)
    TABLE 78. LAMEA FOOD INGREDIENTS MARKET, BY APPLICATION, 2021-2031 ($MILLION)
    TABLE 79. LAMEA FOOD AND BEVERAGES FOOD INGREDIENTS MARKET, BY SUB-TYPE, 2021-2031 ($MILLION)
    TABLE 80. LAMEA FOOD INGREDIENTS MARKET, BY COUNTRY, 2021-2031 ($MILLION)
    TABLE 81. BRAZIL FOOD INGREDIENTS MARKET, BY TYPE, 2021-2031 ($MILLION)
    TABLE 82. BRAZIL FOOD INGREDIENTS MARKET, BY APPLICATION, 2021-2031 ($MILLION)
    TABLE 83. ARGENTINA FOOD INGREDIENTS MARKET, BY TYPE, 2021-2031 ($MILLION)
    TABLE 84. ARGENTINA FOOD INGREDIENTS MARKET, BY APPLICATION, 2021-2031 ($MILLION)
    TABLE 85. UAE FOOD INGREDIENTS MARKET, BY TYPE, 2021-2031 ($MILLION)
    TABLE 86. UAE FOOD INGREDIENTS MARKET, BY APPLICATION, 2021-2031 ($MILLION)
    TABLE 87. SOUTH AFRICA FOOD INGREDIENTS MARKET, BY TYPE, 2021-2031 ($MILLION)
    TABLE 88. SOUTH AFRICA FOOD INGREDIENTS MARKET, BY APPLICATION, 2021-2031 ($MILLION)
    TABLE 89. REST OF LAMEA FOOD INGREDIENTS MARKET, BY TYPE, 2021-2031 ($MILLION)
    TABLE 90. REST OF LAMEA FOOD INGREDIENTS MARKET, BY APPLICATION, 2021-2031 ($MILLION)
    TABLE 91. AJINOMOTO CO., INC.: KEY EXECUTIVES
    TABLE 92. AJINOMOTO CO., INC.: COMPANY SNAPSHOT
    TABLE 93. AJINOMOTO CO., INC.: PRODUCT SEGMENTS
    TABLE 94. AJINOMOTO CO., INC.: PRODUCT PORTFOLIO
    TABLE 95. ARCHER DANIELS MIDLAND COMPANY: KEY EXECUTIVES
    TABLE 96. ARCHER DANIELS MIDLAND COMPANY: COMPANY SNAPSHOT
    TABLE 97. ARCHER DANIELS MIDLAND COMPANY: PRODUCT SEGMENTS
    TABLE 98. ARCHER DANIELS MIDLAND COMPANY: PRODUCT PORTFOLIO
    TABLE 99. ARCHER DANIELS MIDLAND COMPANY: KEY STRATERGIES
    TABLE 100. ASSOCIATED BRITISH FOODS PLC: KEY EXECUTIVES
    TABLE 101. ASSOCIATED BRITISH FOODS PLC: COMPANY SNAPSHOT
    TABLE 102. ASSOCIATED BRITISH FOODS PLC: PRODUCT SEGMENTS
    TABLE 103. ASSOCIATED BRITISH FOODS PLC: PRODUCT PORTFOLIO
    TABLE 104. CARGILL, INCORPORATED: KEY EXECUTIVES
    TABLE 105. CARGILL, INCORPORATED: COMPANY SNAPSHOT
    TABLE 106. CARGILL, INCORPORATED: PRODUCT SEGMENTS
    TABLE 107. CARGILL, INCORPORATED: PRODUCT PORTFOLIO
    TABLE 108. CELANESE CORPORATION: KEY EXECUTIVES
    TABLE 109. CELANESE CORPORATION: COMPANY SNAPSHOT
    TABLE 110. CELANESE CORPORATION: PRODUCT SEGMENTS
    TABLE 111. CELANESE CORPORATION: PRODUCT PORTFOLIO
    TABLE 112. DUPONT DE NEMOURS, INC.: KEY EXECUTIVES
    TABLE 113. DUPONT DE NEMOURS, INC.: COMPANY SNAPSHOT
    TABLE 114. DUPONT DE NEMOURS, INC.: PRODUCT SEGMENTS
    TABLE 115. DUPONT DE NEMOURS, INC.: PRODUCT PORTFOLIO
    TABLE 116. INGREDION INCORPORATED: KEY EXECUTIVES
    TABLE 117. INGREDION INCORPORATED: COMPANY SNAPSHOT
    TABLE 118. INGREDION INCORPORATED: PRODUCT SEGMENTS
    TABLE 119. INGREDION INCORPORATED: PRODUCT PORTFOLIO
    TABLE 120. INGREDION INCORPORATED: KEY STRATERGIES
    TABLE 121. KERRY GROUP PLC: KEY EXECUTIVES
    TABLE 122. KERRY GROUP PLC: COMPANY SNAPSHOT
    TABLE 123. KERRY GROUP PLC: PRODUCT SEGMENTS
    TABLE 124. KERRY GROUP PLC: PRODUCT PORTFOLIO
    TABLE 125. ROQUETTE FRERES: KEY EXECUTIVES
    TABLE 126. ROQUETTE FRERES: COMPANY SNAPSHOT
    TABLE 127. ROQUETTE FRERES: PRODUCT SEGMENTS
    TABLE 128. ROQUETTE FRERES: PRODUCT PORTFOLIO
    TABLE 129. SDZUCKER AG: KEY EXECUTIVES
    TABLE 130. SDZUCKER AG: COMPANY SNAPSHOT
    TABLE 131. SDZUCKER AG: PRODUCT SEGMENTS
    TABLE 132. SDZUCKER AG: PRODUCT PORTFOLIO
    TABLE 133. TATE AND LYLE, PLC.: KEY EXECUTIVES
    TABLE 134. TATE AND LYLE, PLC.: COMPANY SNAPSHOT
    TABLE 135. TATE AND LYLE, PLC.: PRODUCT SEGMENTS
    TABLE 136. TATE AND LYLE, PLC.: PRODUCT PORTFOLIO
    TABLE 137. AKZO NOBEL N.V.: KEY EXECUTIVES
    TABLE 138. AKZO NOBEL N.V.: COMPANY SNAPSHOT
    TABLE 139. AKZO NOBEL N.V.: PRODUCT SEGMENTS
    TABLE 140. AKZO NOBEL N.V.: PRODUCT PORTFOLIO
    TABLE 141. BASF SE: KEY EXECUTIVES
    TABLE 142. BASF SE: COMPANY SNAPSHOT
    TABLE 143. BASF SE: PRODUCT SEGMENTS
    TABLE 144. BASF SE: PRODUCT PORTFOLIO
    TABLE 145. CLARIANT: KEY EXECUTIVES
    TABLE 146. CLARIANT: COMPANY SNAPSHOT
    TABLE 147. CLARIANT: PRODUCT SEGMENTS
    TABLE 148. CLARIANT: PRODUCT PORTFOLIO
    TABLE 149. EVONIK: KEY EXECUTIVES
    TABLE 150. EVONIK: COMPANY SNAPSHOT
    TABLE 151. EVONIK: PRODUCT SEGMENTS
    TABLE 152. EVONIK: PRODUCT PORTFOLIO
    TABLE 153. KONINKLIJKE DSM N.V.: KEY EXECUTIVES
    TABLE 154. KONINKLIJKE DSM N.V.: COMPANY SNAPSHOT
    TABLE 155. KONINKLIJKE DSM N.V.: PRODUCT SEGMENTS
    TABLE 156. KONINKLIJKE DSM N.V.: PRODUCT PORTFOLIO
    TABLE 157. KONINKLIJKE DSM N.V.: KEY STRATERGIES
    TABLE 158. SOLVAY: KEY EXECUTIVES
    TABLE 159. SOLVAY: COMPANY SNAPSHOT
    TABLE 160. SOLVAY: PRODUCT SEGMENTS
    TABLE 161. SOLVAY: PRODUCT PORTFOLIO
    TABLE 162. KEMIN INDUSTRIES, INC.: KEY EXECUTIVES
    TABLE 163. KEMIN INDUSTRIES, INC.: COMPANY SNAPSHOT
    TABLE 164. KEMIN INDUSTRIES, INC.: PRODUCT SEGMENTS
    TABLE 165. KEMIN INDUSTRIES, INC.: PRODUCT PORTFOLIO
    TABLE 166. KEMIN INDUSTRIES, INC.: KEY STRATERGIES
    TABLE 167. CHEMELCO INTERNATIONAL B.V.: KEY EXECUTIVES
    TABLE 168. CHEMELCO INTERNATIONAL B.V.: COMPANY SNAPSHOT
    TABLE 169. CHEMELCO INTERNATIONAL B.V.: PRODUCT SEGMENTS
    TABLE 170. CHEMELCO INTERNATIONAL B.V.: PRODUCT PORTFOLIO
    TABLE 171. GIVAUDAN INTERNATIONAL SA: KEY EXECUTIVES
    TABLE 172. GIVAUDAN INTERNATIONAL SA: COMPANY SNAPSHOT
    TABLE 173. GIVAUDAN INTERNATIONAL SA: SERVICE SEGMENTS
    TABLE 174. GIVAUDAN INTERNATIONAL SA: PRODUCT PORTFOLIO
    TABLE 175. GIVAUDAN INTERNATIONAL SA: KEY STRATERGIES
    TABLE 176. PALSGAARD A/S: KEY EXECUTIVES
    TABLE 177. PALSGAARD A/S: COMPANY SNAPSHOT
    TABLE 178. PALSGAARD A/S: PRODUCT SEGMENTS
    TABLE 179. PALSGAARD A/S: SERVICE SEGMENTS
    TABLE 180. PALSGAARD A/S: PRODUCT PORTFOLIO
    TABLE 181. UNIVAR SOLUTIONS INC.: KEY EXECUTIVES
    TABLE 182. UNIVAR SOLUTIONS INC.: COMPANY SNAPSHOT
    TABLE 183. UNIVAR SOLUTIONS INC.: PRODUCT SEGMENTS
    TABLE 184. UNIVAR SOLUTIONS INC.: PRODUCT PORTFOLIO
    TABLE 185. CORBION INC.: KEY EXECUTIVES
    TABLE 186. CORBION INC.: COMPANY SNAPSHOT
    TABLE 187. CORBION INC.: PRODUCT SEGMENTS
    TABLE 188. CORBION INC.: PRODUCT PORTFOLIO
    TABLE 189. J.M. HUBER CORPORATION: KEY EXECUTIVES
    TABLE 190. J.M. HUBER CORPORATION: COMPANY SNAPSHOT
    TABLE 191. J.M. HUBER CORPORATION: PRODUCT SEGMENTS
    TABLE 192. J.M. HUBER CORPORATION: PRODUCT PORTFOLIO
    TABLE 193. KAO CORPORATION: KEY EXECUTIVES
    TABLE 194. KAO CORPORATION: COMPANY SNAPSHOT
    TABLE 195. KAO CORPORATION: PRODUCT SEGMENTS
    TABLE 196. KAO CORPORATION: PRODUCT PORTFOLIO
    TABLE 197. JUNGBUNZLAUER SUISSE AG: KEY EXECUTIVES
    TABLE 198. JUNGBUNZLAUER SUISSE AG: COMPANY SNAPSHOT
    TABLE 199. JUNGBUNZLAUER SUISSE AG: PRODUCT SEGMENTS
    TABLE 200. JUNGBUNZLAUER SUISSE AG: PRODUCT PORTFOLIO
    TABLE 201. ASHLAND: KEY EXECUTIVES
    TABLE 202. ASHLAND: COMPANY SNAPSHOT
    TABLE 203. ASHLAND: PRODUCT SEGMENTS
    TABLE 204. ASHLAND: PRODUCT PORTFOLIO
    TABLE 205. NOVOZYMES A/S: KEY EXECUTIVES
    TABLE 206. NOVOZYMES A/S: COMPANY SNAPSHOT
    TABLE 207. NOVOZYMES A/S: PRODUCT SEGMENTS
    TABLE 208. NOVOZYMES A/S: PRODUCT PORTFOLIO
    TABLE 209. AROMATAGROUP SRL: KEY EXECUTIVES
    TABLE 210. AROMATAGROUP SRL: COMPANY SNAPSHOT
    TABLE 211. AROMATAGROUP SRL: PRODUCT SEGMENTS
    TABLE 212. AROMATAGROUP SRL: PRODUCT PORTFOLIO
    TABLE 213. AROMATAGROUP SRL: KEY STRATERGIES
    TABLE 214. KALSEC, INC.: KEY EXECUTIVES
    TABLE 215. KALSEC, INC.: COMPANY SNAPSHOT
    TABLE 216. KALSEC, INC.: PRODUCT SEGMENTS
    TABLE 217. KALSEC, INC.: PRODUCT PORTFOLIO
    TABLE 218. GLANBIA PLC: KEY EXECUTIVES
    TABLE 219. GLANBIA PLC: COMPANY SNAPSHOT
    TABLE 220. GLANBIA PLC: PRODUCT SEGMENTS
    TABLE 221. GLANBIA PLC: PRODUCT PORTFOLIO
    TABLE 222. RECKITT BENCKISER GROUP PLC.: KEY EXECUTIVES
    TABLE 223. RECKITT BENCKISER GROUP PLC.: COMPANY SNAPSHOT
    TABLE 224. RECKITT BENCKISER GROUP PLC.: PRODUCT SEGMENTS
    TABLE 225. RECKITT BENCKISER GROUP PLC.: PRODUCT PORTFOLIO
    TABLE 226. NEXIRA: KEY EXECUTIVES
    TABLE 227. NEXIRA: COMPANY SNAPSHOT
    TABLE 228. NEXIRA: PRODUCT SEGMENTS
    TABLE 229. NEXIRA: PRODUCT PORTFOLIO
    TABLE 230. NEXIRA: KEY STRATERGIES
    TABLE 231. FDL LTD: KEY EXECUTIVES
    TABLE 232. FDL LTD: COMPANY SNAPSHOT
    TABLE 233. FDL LTD: PRODUCT SEGMENTS
    TABLE 234. FDL LTD: PRODUCT PORTFOLIO
    TABLE 235. ATP GROUP: KEY EXECUTIVES
    TABLE 236. ATP GROUP: COMPANY SNAPSHOT
    TABLE 237. ATP GROUP: PRODUCT SEGMENTS
    TABLE 238. ATP GROUP: PRODUCT PORTFOLIO
  • LIST OF FIGURES

  • FIGURE 1.FOOD INGREDIENTS MARKET SEGMENTATION
    FIGURE 2.FOOD INGREDIENTS MARKET,2021-2031
    FIGURE 3.FOOD INGREDIENTS MARKET,2021-2031
    FIGURE 4. TOP INVESTMENT POCKETS, BY REGION
    FIGURE 5.PORTER FIVE-1
    FIGURE 6.PORTER FIVE-2
    FIGURE 7.PORTER FIVE-3
    FIGURE 8.PORTER FIVE-4
    FIGURE 9.PORTER FIVE-5
    FIGURE 10.TOP PLAYER POSITIONING
    FIGURE 11.FOOD INGREDIENTS MARKET:DRIVERS, RESTRAINTS AND OPPORTUNITIES
    FIGURE 12.PRICING ANALYSIS
    FIGURE 13.VALUE CHAIN ANALYSIS
    FIGURE 14.MARKET SHARE ANALYSIS
    FIGURE 15.FOOD INGREDIENTS MARKET,BY TYPE,2021(%)
    FIGURE 16.COMPARATIVE SHARE ANALYSIS OF FLAVORS FOOD INGREDIENTS MARKET,2021-2031(%)
    FIGURE 17.COMPARATIVE SHARE ANALYSIS OF COLOR ADDITIVES FOOD INGREDIENTS MARKET,2021-2031(%)
    FIGURE 18.COMPARATIVE SHARE ANALYSIS OF PRESERVATIVES FOOD INGREDIENTS MARKET,2021-2031(%)
    FIGURE 19.COMPARATIVE SHARE ANALYSIS OF FAT REPLACERS FOOD INGREDIENTS MARKET,2021-2031(%)
    FIGURE 20.COMPARATIVE SHARE ANALYSIS OF SWEETENERS FOOD INGREDIENTS MARKET,2021-2031(%)
    FIGURE 21.COMPARATIVE SHARE ANALYSIS OF STABILIZERS, EMULSIFIERS, AND BINDERS FOOD INGREDIENTS MARKET,2021-2031(%)
    FIGURE 22.COMPARATIVE SHARE ANALYSIS OF THICKENERS FOOD INGREDIENTS MARKET,2021-2031(%)
    FIGURE 23.COMPARATIVE SHARE ANALYSIS OF PH CONTROL AGENTS FOOD INGREDIENTS MARKET,2021-2031(%)
    FIGURE 24.COMPARATIVE SHARE ANALYSIS OF NUTRIENTS FOOD INGREDIENTS MARKET,2021-2031(%)
    FIGURE 25.COMPARATIVE SHARE ANALYSIS OF OTHERS FOOD INGREDIENTS MARKET,2021-2031(%)
    FIGURE 26.FOOD INGREDIENTS MARKET,BY APPLICATION,2021(%)
    FIGURE 27.COMPARATIVE SHARE ANALYSIS OF FOOD AND BEVERAGES FOOD INGREDIENTS MARKET,2021-2031(%)
    FIGURE 28.COMPARATIVE SHARE ANALYSIS OF NUTRACEUTICALS FOOD INGREDIENTS MARKET,2021-2031(%)
    FIGURE 29.COMPARATIVE SHARE ANALYSIS OF ANIMAL FEED FOOD INGREDIENTS MARKET,2021-2031(%)
    FIGURE 30.FOOD INGREDIENTS MARKET BY REGION,2021
    FIGURE 31.U.S. FOOD INGREDIENTS MARKET,2021-2031($MILLION)
    FIGURE 32.CANADA FOOD INGREDIENTS MARKET,2021-2031($MILLION)
    FIGURE 33.MEXICO FOOD INGREDIENTS MARKET,2021-2031($MILLION)
    FIGURE 34.GERMANY FOOD INGREDIENTS MARKET,2021-2031($MILLION)
    FIGURE 35.UK FOOD INGREDIENTS MARKET,2021-2031($MILLION)
    FIGURE 36.FRANCE FOOD INGREDIENTS MARKET,2021-2031($MILLION)
    FIGURE 37.RUSSIA FOOD INGREDIENTS MARKET,2021-2031($MILLION)
    FIGURE 38.ITALY FOOD INGREDIENTS MARKET,2021-2031($MILLION)
    FIGURE 39.SPAIN FOOD INGREDIENTS MARKET,2021-2031($MILLION)
    FIGURE 40.REST OF EUROPE FOOD INGREDIENTS MARKET,2021-2031($MILLION)
    FIGURE 41.CHINA FOOD INGREDIENTS MARKET,2021-2031($MILLION)
    FIGURE 42.JAPAN FOOD INGREDIENTS MARKET,2021-2031($MILLION)
    FIGURE 43.INDIA FOOD INGREDIENTS MARKET,2021-2031($MILLION)
    FIGURE 44.SOUTH KOREA FOOD INGREDIENTS MARKET,2021-2031($MILLION)
    FIGURE 45.AUSTRALIA FOOD INGREDIENTS MARKET,2021-2031($MILLION)
    FIGURE 46.REST OF ASIA-PACIFIC FOOD INGREDIENTS MARKET,2021-2031($MILLION)
    FIGURE 47.BRAZIL FOOD INGREDIENTS MARKET,2021-2031($MILLION)
    FIGURE 48.ARGENTINA FOOD INGREDIENTS MARKET,2021-2031($MILLION)
    FIGURE 49.UAE FOOD INGREDIENTS MARKET,2021-2031($MILLION)
    FIGURE 50.SOUTH AFRICA FOOD INGREDIENTS MARKET,2021-2031($MILLION)
    FIGURE 51.REST OF LAMEA FOOD INGREDIENTS MARKET,2021-2031($MILLION)
    FIGURE 52. TOP WINNING STRATEGIES, BY YEAR
    FIGURE 53. TOP WINNING STRATEGIES, BY DEVELOPMENT
    FIGURE 54. TOP WINNING STRATEGIES, BY COMPANY
    FIGURE 55.PRODUCT MAPPING OF TOP 10 PLAYERS
    FIGURE 56.COMPETITIVE DASHBOARD
    FIGURE 57.COMPETITIVE HEATMAP OF TOP 10 KEY PLAYERS
    FIGURE 58.AJINOMOTO CO., INC..: NET SALES ($MILLION)
    FIGURE 59.ASSOCIATED BRITISH FOODS PLC.: NET SALES ($MILLION)
    FIGURE 60.CELANESE CORPORATION.: NET SALES ($MILLION)
    FIGURE 61.DUPONT DE NEMOURS, INC..: NET SALES ($MILLION)
    FIGURE 62. KERRY GROUP PLC.: NET SALES ($MILLION)
    FIGURE 63.ROQUETTE FRERES.: NET SALES ($MILLION)
    FIGURE 64.SDZUCKER AG.: NET SALES ($MILLION)
    FIGURE 65.TATE AND LYLE, PLC..: NET SALES ($MILLION)
    FIGURE 66.AKZO NOBEL N.V..: NET SALES ($MILLION)
    FIGURE 67.BASF SE.: NET SALES ($MILLION)
    FIGURE 68.CLARIANT.: NET SALES ($MILLION)
    FIGURE 69.EVONIK.: NET SALES ($MILLION)
    FIGURE 70.KONINKLIJKE DSM N.V..: NET SALES ($MILLION)
    FIGURE 71.SOLVAY.: NET SALES ($MILLION)
    FIGURE 72.KEMIN INDUSTRIES, INC..: NET SALES ($MILLION)
    FIGURE 73.CHEMELCO INTERNATIONAL B.V..: NET SALES ($MILLION)
    FIGURE 74.GIVAUDAN INTERNATIONAL SA.: NET SALES ($MILLION)
    FIGURE 75.PALSGAARD A/S.: NET SALES ($MILLION)
    FIGURE 76.UNIVAR SOLUTIONS INC..: NET SALES ($MILLION)
    FIGURE 77.CORBION INC..: NET SALES ($MILLION)
    FIGURE 78.J.M. HUBER CORPORATION.: NET SALES ($MILLION)
    FIGURE 79.KAO CORPORATION.: NET SALES ($MILLION)
    FIGURE 80.JUNGBUNZLAUER SUISSE AG.: NET SALES ($MILLION)
    FIGURE 81.ASHLAND.: NET SALES ($MILLION)
    FIGURE 82.NOVOZYMES A/S.: NET SALES ($MILLION)
    FIGURE 83.KALSEC, INC..: NET SALES ($MILLION)
    FIGURE 84.GLANBIA PLC.: NET SALES ($MILLION)
    FIGURE 85.RECKITT BENCKISER GROUP PLC..: NET SALES ($MILLION)
    FIGURE 86.NEXIRA.: NET SALES ($MILLION)
    FIGURE 87.FDL LTD.: NET SALES ($MILLION)
    FIGURE 88.ATP GROUP.: NET SALES ($MILLION)
    FIGURE 89.ARCHER DANIELS MIDLAND COMPANY.: NET SALES ($MILLION)
    FIGURE 90.CARGILL, INCORPORATED.: NET SALES ($MILLION)
    FIGURE 91.INGREDION INCORPORATED.: NET SALES ($MILLION)
    FIGURE 92.AROMATAGROUP SRL.: NET SALES ($MILLION)


PURCHASE OPTIONS

Call or Email us

U.S.-Canada Toll-free: +1-800-792-5285
Int'l : +1-503-894-6022
Europe : +44-845-528-1300
Email : help@alliedmarketresearch.com
 
FREQUENTLY ASKED QUESTIONS?

A. The global food ingredients market size was valued at $270,203.2 million in 2021, and is estimated to reach $475,396.8 million by 2031, registering a CAGR of 5.8% from 2022 to 2031.

A. The global food ingredients market registered a CAGR of 5.8% from 2022 to 2031.

A. Raise the query and paste the link of the specific report and our sales executive will revert with the sample.

A. The forecast period in the food ingredients market report is from 2022 to 2031.

A. The top companies that hold the market share in the food ingredients market include Archer Daniels Midland Company, Associated British Foods plc, Cargill, Incorporated, Celanese Corporation, DuPont de Nemours, Inc. (Danisco), Ingredion Incorporated (TIC Gums, Inc), Kerry Group, Roquette Freres, Südzucker Group (BENEO), Tate and Lyle PLC, AkzoNobel N.V., BASF SE, Clariant AG, Evonik Industries AG, Koninklijke DSM N.V., and Others.

A. The food ingredients market report has 2 segments. The segments are type and application.

A. The emerging countries in the food ingredients market are likely to grow at a CAGR of more than 9% from 2022 to 2031.

A. Post-COVID-19, the ease of lockdown had improved the supply chain for food ingredient products, and the governments have lifted the lockdown which has eased the difficulties in the supply chain. The food ingredients market is witnessing new heights of growth and is expected to recover its losses in the next 1-2 years.

A. Asia-Pacific will dominate the food ingredients market by the end of 2031.

Looking for Customization?

 Customization Request

Have a Question?

 Speak with Analyst

Any Confusion?

 Inquire Before Buying

Have a glance of the Report

  Request Sample
RELATED TAGS

Purchase Full Report of
Food Ingredients Market

Start reading instantly.
This Report and over 66,804+ more Reports, Available with Avenue Library. T&C*.

  • Online Only
  • $3,570
  • Online cloud access only
  • Restricted print, copy, paste & download
  • Read only
  • Free industry update
    (Within 180 days)
  • Free report update in next update cycle
    (May 2024 - May 2025)
  • Data Pack
  • $3,840
  • Restricted to one authorized user
  • One print only
  • Available in
    Excel
  • Free industry update
    (Within 180 days)
  •   Free report update in next update cycle
    (May 2024 - May 2025)
  • Single User
  • $5,730
  • Restricted to one authorized user
  • One print only
  • Available in
    PDF
  • Free industry update
    (Within 180 days)
  •   Free report update in next update cycle
    (May 2024 - May 2025)
  • Five Users
  • $6,450
  • Limited to five authorized users
  • Print upto five copies
  • Available in
    PDF
  • Free industry update
    (Within 180 days)
  •   Free report update in next update cycle
    (May 2024 - May 2025)
  • Enterprise
    License/PDF

  • $9,600
  • Unlimited
    within
    company/enterprise
  • Available in Excel & PDF
  • Free industry update
    (Within 180 days)
  •   Free report update in next update cycle
    (May 2024 - May 2025)
  • Library
    Membership

  • $999 $ 1,175
    Per User/ Per month/ Billed annually
  • Published Content
    E-access
  • Company Profiles
    E-access
  • Newly Added Content Access
  • 10 PDF
    Downloads
  • 5 Excel Data
    Pack Downloads
  • 250 Company Profiles PDF Downloads
  • Buy Now

*Taxes/Fees, if applicable will be added during checkout. All prices in USD

RELATED REPORTS
 

Why Allied Market Research?


Infallible Methodology

To ensure high-level data integrity, accurate analysis, and impeccable forecasts

Analyst Support

For complete satisfaction

Customization

On-demand customization of scope of the report to exactly meet your needs

TARGETED MARKET VIEW

Targeted market view to provide pertinent information and save time of readers

Get fresh content delivered

Get insights on topics that are crucial for your business. Stay abreast of your interest areas.

Get Industry Data Alerts

Why Allied Market Research?

Infallible Methodology

To ensure high-level data integrity, accurate analysis, and impeccable forecasts

Analyst Support

For complete satisfaction

Customization

On-demand customization of scope of the report to exactly meet your needs

TARGETED MARKET VIEW

Targeted market view to provide pertinent information and save time of readers