0
2022
Commercial Seaweeds Market

Commercial Seaweeds Market

by Product (Red, Brown, Green), by Form (Flakes, Powder, Liquid), by Application (Food and beverage Industry, Cosmetics and personal care, Agricultural fertilizers, Animal feed additives, Others): Global Opportunity Analysis and Industry Forecast, 2021-2031

Report Code: A01291
Oct 2022 | Pages: 300
Tables: 188
Charts: 65
  • Formats*:

  • pdf

    Single User License, Five User
    License & Enterprise User License

  • xls

    Data Pack Excel License

  • ppt

    It comes with the additional cost
    of $2500.00 contact sales.


Commercial Seaweeds Market Research, 2031

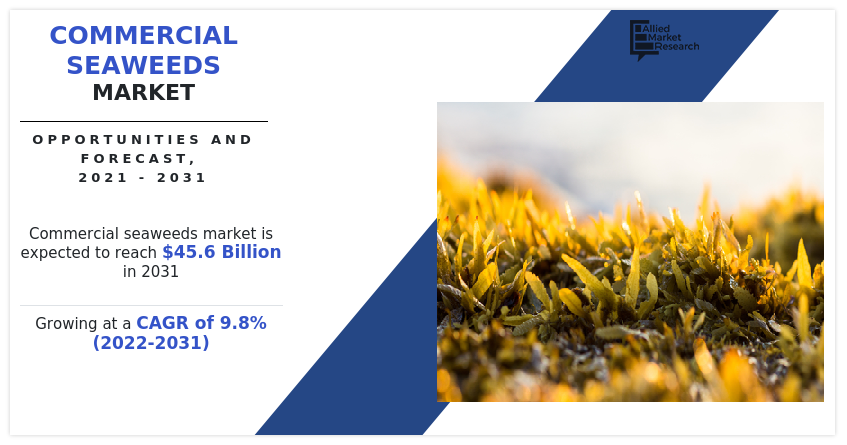
The global commercial seaweeds market size was valued at $17.9 billion in 2021, and is projected to reach $45.6 billion by 2031, growing at a CAGR of 9.8% from 2022 to 2031.

The market for commercial seaweeds is driven mainly by an increase in awareness about the benefits and medicinal uses of these seaweeds. Commercial seaweeds are used in many applications such as animal feed, human food, agriculture, and pharmaceuticals due to their thickening and gelling properties. In addition, they have various nutritive values and are therefore used in various industries.
The Commercial seaweeds market is facing a period of short-term negative growth, which can be attributed to factors such as a decline in the product demand from major end-users, limited operations in most of industries, inadequate funding to research and academic institutes, and disrupted supply chain and challenges in terms of providing essential/post-sales services.

Commercial Seaweeds Market

Seaweed extract is used by farmers in agriculture because it is an effective fertilizer for crop growth. Complex liquid seaweed extracts have been shown to have innovative methods for boosting agricultural output. Farmers have noticed some additional benefits as a result of the increased understanding of seaweed used in agricultural production, including enhanced plant root systems. Seaweed also significantly contributes to the improvement of these plants' ability to withstand plant diseases and environmental challenges like cold or drought, as well as the development of their flowers, leaves, and fruit. Additionally, seaweeds enhance the microbiology, water-holding capacity, and soil structure of the soil.

The global market is analyzed on the basis of product, form, application, and region. By product, the commercial seaweeds market is divided into red, brown, and green. By form, the market is divided into flakes, powder, and liquid. By application, it is classified into food & beverage industry, cosmetics & personal care, agricultural fertilizers, animal feed additives, and others. Region wise, the market is analyzed across North America, Europe, Asia-Pacific, and LAMEA.
Commercial Seaweeds Market

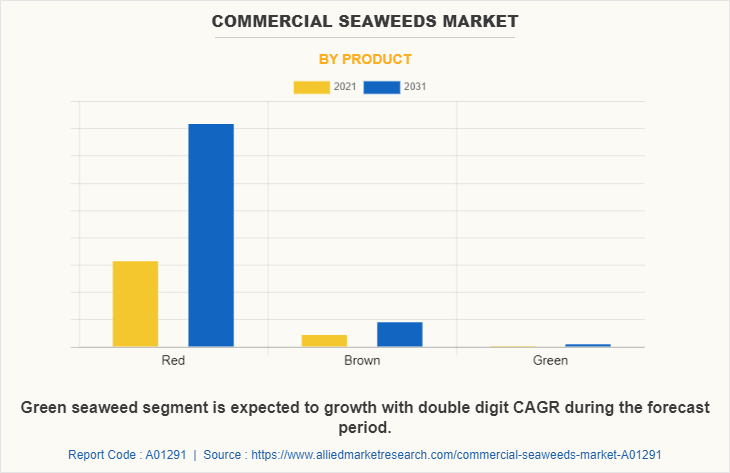
The red seaweed segment, as per product type, dominated the global commercial seaweeds market in 2021 and is anticipated to maintain its dominance throughout the commercial seaweeds market forecast period. The red color of seaweed is caused by the pigments phycoerythrin and phycocyanin, which cover up other pigments like chlorophyll, beta-carotene, and several other xanthophylls. Green seaweed is a good source of organic beta-carotene, which is helpful in avoiding some malignancies, particularly lung cancer. Green seaweed also has a variety of uses in the food business. Red seaweeds are the largest and most prevalent seaweeds, which is why this is the case. Moreover, because phycocolloids like carrageenan are present, they play a significant economic role throughout the Asia-Pacific region. As a thickening and stabilizer in food processing, carrageenan made from seaweed has many uses. Thus, it is anticipated that increased red seaweed consumption in the food industry will fuel commercial seaweeds market expansion.
Commercial Seaweeds Market

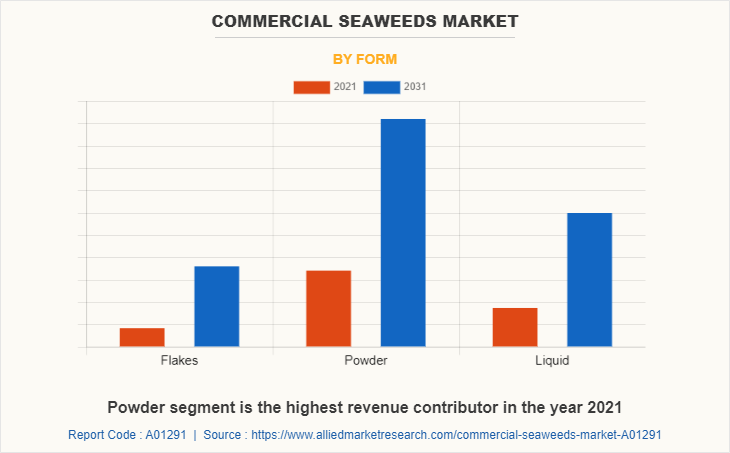
The powder segment dominates the global market. A small number of marine microalgae is added to the natural seaweed used to make seaweed powder. Seaweed polysaccharides, mannitol, amino acids, proteins, vitamins, potassium, iron, calcium, phosphorus, iodine, selenium, cobalt, and other trace elements are all abundant in natural seaweed powder.
Commercial Seaweeds Market

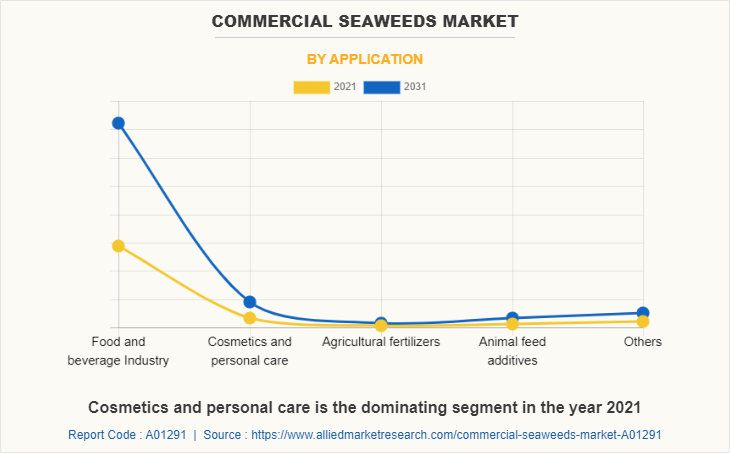
The food & beverage industry segment exhibits the fastest growth in the global market. The demand for seaweed is rising as a result of the increased use of this natural thickening and gelling agent in the manufacture of cheese, creams, sweets, and other products. The food and beverage industries are seeing a huge increase in demand for healthier ingredients. This is encouraging consumers to purchase and favor plant-based food products.
Commercial Seaweeds Market

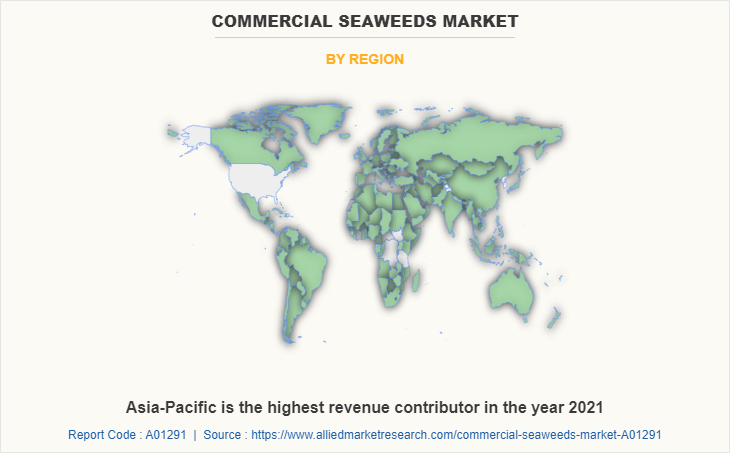
Region wise, Asia-Pacific dominated the market with the largest commercial seaweeds market share during the forecast period. The population of the Asia-Pacific region is largely concentrated in coastal regions, making it strongly related to the sea and its food supplies. Seaweed farming thus has its roots in the Asia-Pacific region. With a roughly one-fourth share of the global commercial seaweeds market in terms of value, China is the largest producer of seaweed in the world.

Due to its effectiveness in enhancing the nutritional content of food products, seaweed is in greater demand worldwide in the food sector. Prior to the migration of the Asian population into nations like the U.S., France, and Canada, macroalgae were primarily consumed in Asia; however, these days, it is often utilized as a food ingredient or added fresh. In addition, a number of hydrocolloids produced from seaweed are utilized to thicken and stabilize food products. Gels and water-soluble films are also made with it. Alginate, agar, and carrageenan are the three algal extracts that are most frequently utilized. They are employed in a wide range of food products, including ice cream, jams, fruit juices, bakery goods, and others, as gelling, stabilizing, emulsifying, and thickening agents.

The combination of hazardous waste chemicals and polymers from industrial effluents has greatly increased water contamination in recent years. Due to the numerous challenges, this causes while harvesting seaweed from ocean floors, its market price increases. According to predictions, the commercial seaweeds market expansion would be constrained by the high cost of cultivation. Due to the lack of productivity and efficiency among business units, many companies are compelled to shut down their manufacturing facilities. Farmers and manufacturers should be helped to overcome this challenge by the growing government assistance for macroalgae collection and production to fulfil the growing demand in the food business.

Due to the advantages, they provide for our health, seaweeds are presently receiving a lot of attention. Seaweeds have a high nutritional value, and their bioactive components have potent therapeutic effects that help treat a variety of medical conditions. Unique chemicals found in species of the class Phaeophyceae, phylum Rhodophyta, and Chlorophyta have a variety of qualities that could be beneficial to our health, making them valuable compounds for use in biotechnological and medicinal applications. Due to the wide variety of their metabolites, seaweeds have been used in medicine for the past three decades to treat a variety of conditions, including gallstones, stomach disorders, eczema, cancer, renal disorders, scabies, psoriasis, asthma, arteriosclerosis, heart disease, lung diseases, ulcers, etc.

The largest market is in Asia-Pacific. As the area with the largest population in the world, it has a higher market share. Additionally, the commercial seaweeds market demand is rising sharply as a result of consumers' growing consciousness. Japan and the Republic of Korea are the next-largest producers of seaweed after China. On all continents, nevertheless, seaweed is currently being grown. Seaweeds are utilized in a variety of Chinese cuisines because they contain some nutrients. Seaweeds provide cuisine with new flavors, textures, and a natural scent. As a result, the Asia-Pacific region is seeing an increase in seaweed demand.

The trend of being vegan or adopting a vegetarian diet has quickened, leading to an increase in the consumption of plant-based products. Plant-based goods are becoming more and more popular in many areas, including food and cosmetics, as people begin to believe they are healthier and safer than goods generated from animals. The development of plant-based protein substitutes currently frequently uses macroalgae as a good source of protein, which is promoting the expansion of this sector.

The rise in the use of seaweed supplements, which are rich in vitamins and minerals, is one of the main factors boosting the global market for commercial seaweeds. The commercial seaweeds market is also growing as consumers become more aware of the health advantages of seaweed, including its anti-microbial, anti-inflammatory, and anti-cancer properties. Additionally, the expanding use of seaweed in the agricultural, pharmaceutical, cosmetic, and food & beverage industries is fueling the expansion of the commercial seaweeds industry due to the product's nutritional value.

The major players analyzed for the commercial seaweeds industry are Cargill Incorporated, CJ Cheiljedang Corporation, Corbion NV, Gimme Health Foods Inc., Irish Seaweeds, J.M. Huber Corporation, Mara Seaweed, Ocean Harvest Technology Limited, Qingdao Gather Great Ocean Algae Industry Group Co., Ltd (GGOG), Roland Foods, LLC, SeaSnax, Seasol, Seaweed & Co., Singha Corporation Co. Ltd., and Taokaenoi Food & Marketing PCL. Key players operating in the market have adopted product launch, business expansion, and mergers & acquisitions as key strategies to expand their commercial seaweeds market share, increase profitability, and remain competitive in the market.

The companies in market focus on expansions, new launches and acquisitions, which drives the market. Brown commercial seaweeds find their use in food products and as raw material for the extraction of the hydrocolloid and alginate. New and innovative product offerings made by commercial seaweeds manufacturers to match different demands of the end users fuel the market.

Key Benefits For Stakeholders

  • This report provides a quantitative analysis of the market segments, current commercial seaweeds market trends, estimations, and dynamics of the commercial seaweeds market analysis from 2021 to 2031 to identify the prevailing commercial seaweeds market opportunities.
  • The market research is offered along with information related to key drivers, restraints, and opportunities.
  • Porter's five forces analysis highlights the potency of buyers and suppliers to enable stakeholders make profit-oriented business decisions and strengthen their supplier-buyer network.
  • In-depth analysis of the commercial seaweeds market segmentation assists to determine the prevailing market opportunities.
  • Major countries in each region are mapped according to their revenue contribution to the global market.
  • Market player positioning facilitates benchmarking and provides a clear understanding of the present position of the market players.
  • The report includes the analysis of the regional as well as global commercial seaweeds market size, trends, key players, market segments, application areas, and commercial seaweeds market growth strategies.

Commercial Seaweeds Market Report Highlights

Aspects Details
Market Size By 2031 USD 45.6 billion
Growth Rate CAGR of 9.8%
Forecast period 2021 - 2031
Report Pages 300
By Product
  • Brown
  • Green
  • Red
By Form
  • Flakes
  • Powder
  • Liquid
By Application
  • Food and beverage Industry
    • Sub-Type
      • Food service
      • Food processing
  • Cosmetics and personal care
  • Agricultural fertilizers
  • Animal feed additives
  • Others
By Region
  • North America  (U.S., Canada, Mexico)
  • Europe  (UK, Germany, France, Italy, Spain, Denmark, Rest Of Europe)
  • Asia-Pacific  (China, Indonesia, Philippines, South Korea, Japan, Rest Of Asia-Pacific)
  • LAMEA  (Saudi Arabia, United Arab Emirates, South Africa, Tanzania, Rest Of LAMEA)
Key Market Players Seaweed & Co., Roland Foods LLC, SeaSnax, GIMMESEAWEED, Cargill, Incorporated, seasol international pty ltd, Ocean Harvest Technology Limited, SINGHA CORPORATION CO., LTD., TAOKAENOI FOOD & MARKETING PCL, IrishSeaweeds, qingdao bright moon seaweed group co.,ltd., HUBER, MaraSeaweed, cj foods, corbion
 

CHAPTER 1:INTRODUCTION

1.1.Report description
1.2.Key benefits for stakeholders
1.3.Key market segments
1.4.Research methodology

1.4.1.Secondary research
1.4.2.Primary research
1.4.3.Analyst tools and models

CHAPTER 2:EXECUTIVE SUMMARY

2.1.Snapshot
2.2.CXO perspective

CHAPTER 3:MARKET OVERVIEW

3.1.Market definition and scope
3.2.Key findings

3.2.1.Top investment pockets

3.3.Top Player Positioning
3.4.Porter's five force analysis
3.5.Market dynamics

3.5.1.Drivers

3.5.1.1.Increase in consumption of processed food
3.5.1.2.Increase in adoption of commercial seaweed as hydrocolloids to propel market growth
3.5.1.3.Rise in consumption of plant-based products

3.5.2.Restraints

3.5.2.1.High cost of seaweed cultivation
3.5.2.2.Availability of substitute products

3.5.3.Opportunities

3.5.3.1.Increase in demand for seaweed in the pharmaceutical industry
3.5.3.2.Rise in usage of seaweed in the cosmetic industry

3.6.Commercial seaweeds market: Market Share Analysis

3.6.1.By Product
3.6.2.By Form
3.6.3.By Application
3.6.4.By Region

3.7.COVID-19 Impact on the commercial seaweeds market

CHAPTER 4:COMMERCIAL SEAWEEDS MARKET, BY PRODUCT

4.1.Overview

4.1.1.Market size and forecast by product

4.2.Red

4.2.1.Key market trends, growth factors, and opportunities
4.2.2.Market size and forecast, by region

4.3.Brown

4.3.1.Key market trends, growth factors, and opportunities
4.3.2.Market size and forecast, by region

4.4.Green

4.4.1.Key market trends, growth factors, and opportunities
4.4.2.Market size and forecast, by region

CHAPTER 5:COMMERCIAL SEAWEEDS MARKET, BY FORM

5.1.Overview

5.1.1.Market size and forecast by form

5.2.Flakes

5.2.1.Key market trends, growth factors, and opportunities
5.2.2.Market size and forecast, by region

5.3.Powder

5.3.1.Key market trends, growth factors, and opportunities
5.3.2.Market size and forecast, by region

5.4.Liquid

5.4.1.Key market trends, growth factors, and opportunities
5.4.2.Market size and forecast, by region

CHAPTER 6:COMMERCIAL SEAWEEDS MARKET, BY APPLICATION

6.1.Overview

6.1.1.Market size and forecast by application

6.2.Food & beverage industry

6.2.1.Key market trends, growth factors, and opportunities
6.2.2.Market size and forecast, by region
6.2.3.Market size and forecast, by food & beverage industry

6.2.3.1.Food Service

6.2.3.1.1.Market size and forecast for food service, by region

6.2.3.2.Food Processing

6.2.3.2.1.Market size and forecast for food processing, by region

6.3.Cosmetics & personal care

6.3.1.Key market trends, growth factors, and opportunities
6.3.2.Market size and forecast, by region

6.4.Agricultural fertilizers

6.4.1.Key market trends, growth factors, and opportunities
6.4.2.Market size and forecast, by region

6.5.Animal feed additives

6.5.1.Key market trends, growth factors, and opportunities
6.5.2.Market size and forecast, by region

6.6.Others

6.6.1.Key market trends, growth factors, and opportunities
6.6.2.Market size and forecast, by region

CHAPTER 7:COMMERCIAL SEAWEEDS MARKET, BY REGION

7.1.Overview

7.1.1.Market size and forecast

7.2.North America

7.2.1.Key market trends, growth factors, and opportunities
7.2.2.Market size and forecast, by product
7.2.3.Market size and forecast, by form
7.2.4.Market size and forecast, by application

7.2.4.1.Market size and forecast, by food & beverage industry

7.2.5.Market size and forecast, by country

7.2.5.1.U.S.

7.2.5.1.1.Market size and forecast, by product
7.2.5.1.2.Market size and forecast, by form
7.2.5.1.3.Market size and forecast, by application

7.2.5.2.Canada

7.2.5.2.1.Market size and forecast, by product
7.2.5.2.2.Market size and forecast, by form
7.2.5.2.3.Market size and forecast, by application

7.2.5.3.Mexico

7.2.5.3.1.Market size and forecast, by product
7.2.5.3.2.Market size and forecast, by form
7.2.5.3.3.Market size and forecast, by application

7.3.Europe

7.3.1.Key market trends, growth factors, and opportunities
7.3.2.Market size and forecast, by product
7.3.3.Market size and forecast, by form
7.3.4.Market size and forecast, by application

7.3.4.1.Market size and forecast, by food & beverage industry

7.3.5.Market size and forecast, by country

7.3.5.1.UK

7.3.5.1.1.Market size and forecast, by product
7.3.5.1.2.Market size and forecast, by form
7.3.5.1.3.Market size and forecast, by application

7.3.5.2.Germany

7.3.5.2.1.Market size and forecast, by product
7.3.5.2.2.Market size and forecast, by form
7.3.5.2.3.Market size and forecast, by application

7.3.5.3.France

7.3.5.3.1.Market size and forecast, by product
7.3.5.3.2.Market size and forecast, by form
7.3.5.3.3.Market size and forecast, by application

7.3.5.4.Italy

7.3.5.4.1.Market size and forecast, by product
7.3.5.4.2.Market size and forecast, by form
7.3.5.4.3.Market size and forecast, by application

7.3.5.5.Spain

7.3.5.5.1.Market size and forecast, by product
7.3.5.5.2.Market size and forecast, by form
7.3.5.5.3.Market size and forecast, by application

7.3.5.6.Denmark

7.3.5.6.1.Market size and forecast, by product
7.3.5.6.2.Market size and forecast, by form
7.3.5.6.3.Market size and forecast, by application

7.3.5.7.Rest of Europe

7.3.5.7.1.Market size and forecast, by product
7.3.5.7.2.Market size and forecast, by form
7.3.5.7.3.Market size and forecast, by application

7.4.Asia-Pacific

7.4.1.Key market trends, growth factors, and opportunities
7.4.2.Market size and forecast, by product
7.4.3.Market size and forecast, by form
7.4.4.Market size and forecast, by application

7.4.4.1.Market size and forecast, by food & beverage industry

7.4.5.Market size and forecast, by country

7.4.5.1.China

7.4.5.1.1.Market size and forecast, by product
7.4.5.1.2.Market size and forecast, by form
7.4.5.1.3.Market size and forecast, by application

7.4.5.2.Indonesia

7.4.5.2.1.Market size and forecast, by product
7.4.5.2.2.Market size and forecast, by form
7.4.5.2.3.Market size and forecast, by application

7.4.5.3.Philippines

7.4.5.3.1.Market size and forecast, by product
7.4.5.3.2.Market size and forecast, by form
7.4.5.3.3.Market size and forecast, by application

7.4.5.4.South Korea

7.4.5.4.1.Market size and forecast, by product
7.4.5.4.2.Market size and forecast, by form
7.4.5.4.3.Market size and forecast, by application

7.4.5.5.Japan

7.4.5.5.1.Market size and forecast, by product
7.4.5.5.2.Market size and forecast, by form
7.4.5.5.3.Market size and forecast, by application

7.4.5.6.Rest of Asia-Pacific

7.4.5.6.1.Market size and forecast, by product
7.4.5.6.2.Market size and forecast, by form
7.4.5.6.3.Market size and forecast, by application

7.5.LAMEA

7.5.1.Key market trends, growth factors, and opportunities
7.5.2.Market size and forecast, by product
7.5.3.Market size and forecast, by form
7.5.4.Market size and forecast, by application

7.5.4.1.Market size and forecast, by food & beverage industry

7.5.5.Market size and forecast, by country

7.5.5.1.Saudi Arabia

7.5.5.1.1.Market size and forecast, by product
7.5.5.1.2.Market size and forecast, by form
7.5.5.1.3.Market size and forecast, by application

7.5.5.2.United Arab Emirates

7.5.5.2.1.Market size and forecast, by product
7.5.5.2.2.Market size and forecast, by form
7.5.5.2.3.Market size and forecast, by application

7.5.5.3.South Africa

7.5.5.3.1.Market size and forecast, by product
7.5.5.3.2.Market size and forecast, by form
7.5.5.3.3.Market size and forecast, by application

7.5.5.4.Tanzania

7.5.5.4.1.Market size and forecast, by product
7.5.5.4.2.Market size and forecast, by form
7.5.5.4.3.Market size and forecast, by application

7.5.5.5.Rest of LAMEA

7.5.5.5.1.Market size and forecast, by product
7.5.5.5.2.Market size and forecast, by form
7.5.5.5.3.Market size and forecast, by application

CHAPTER 8:COMPETITION LANDSCAPE

8.1.Top winning strategies
8.2.Product mapping
8.3.Competitive dashboard
8.4.Competitive heat map
8.5.Key developments

8.5.1.Acquisition
8.5.2.Business expansion
8.5.3.Product launch
8.5.4.Partnership

CHAPTER 9:COMPANY PROFILES

9.1.CARGILL, INCORPORATED.

9.1.1.Company overview
9.1.2.Key executives
9.1.3.Company snapshot
9.1.4.Operating business segments
9.1.5.Product portfolio
9.1.6.Business performance
9.1.7.Key strategic moves and developments

9.2.CJ CHEILJEDANG CORP.

9.2.1.Company overview
9.2.2.Key executives
9.2.3.Company snapshot
9.2.4.Operating business segments
9.2.5.Product portfolio
9.2.6.Key strategic moves and developments

9.3.CORBION N.V.

9.3.1.Company overview
9.3.2.Key executives
9.3.3.Company snapshot
9.3.4.Operating business segments
9.3.5.Product portfolio
9.3.6.R&D expenditure
9.3.7.Business performance
9.3.8.Key strategic moves and developments

9.4.GIMME HEALTH FOODS INC.

9.4.1.Company overview
9.4.2.Key executives
9.4.3.Company snapshot
9.4.4.Operating business segments
9.4.5.Product portfolio

9.5.IRISH SEAWEEDS

9.5.1.Company overview
9.5.2.Key executives
9.5.3.Company snapshot
9.5.4.Operating business segments
9.5.5.Product portfolio

9.6.J.M. HUBER CORPORATION

9.6.1.Company overview
9.6.2.Key executives
9.6.3.Company snapshot
9.6.4.Operating business segments
9.6.5.Product portfolio

9.7.Mara Seaweed

9.7.1.Company overview
9.7.2.Key executives
9.7.3.Company snapshot
9.7.4.Operating business segments
9.7.5.Product portfolio

9.8.Ocean Harvest Technology Limited

9.8.1.Company overview
9.8.2.Key executives
9.8.3.Company snapshot
9.8.4.Operating business segments
9.8.5.Product portfolio

9.9.QINGDAO GATHER GREAT OCEAN ALGAE INDUSTRY GROUP CO., LTD

9.9.1.Company overview
9.9.2.Key executives
9.9.3.Company snapshot
9.9.4.Operating business segments
9.9.5.Product portfolio

9.10.ROLAND FOODS, LLC.

9.10.1.Company overview
9.10.2.Key executives
9.10.3.Company snapshot
9.10.4.Operating business segments
9.10.5.Product portfolio
9.10.6.Key strategic moves and developments

9.11.SEASNAX.

9.11.1.Company overview
9.11.2.Key executives
9.11.3.Company snapshot
9.11.4.Operating business segments
9.11.5.Product portfolio

9.12.SEASOL

9.12.1.Company overview
9.12.2.Key executives
9.12.3.Company snapshot
9.12.4.Operating business segments
9.12.5.Product portfolio
9.12.6.Key Innovations and its Impact Over the Market

9.13.SEAWEED & CO.

9.13.1.Company overview
9.13.2.Key executives
9.13.3.Company snapshot
9.13.4.Operating business segments
9.13.5.Product portfolio

9.14.SINGHA CORPORATION CO.LTD.

9.14.1.Company overview
9.14.2.Key executives
9.14.3.Company snapshot
9.14.4.Operating business segments
9.14.5.Product portfolio

9.15.TAOKAENOI FOOD & MARKETING PCL.

9.15.1.Company overview
9.15.2.Key executives
9.15.3.Company snapshot
9.15.4.Operating business segments
9.15.5.Product portfolio
9.15.6.Business performance

LIST OF TABLES

TABLE 01.COMMERCIAL SEAWEEDS MARKET, BY PRODUCT, 2021–2031 ($MILLION)
TABLE 02.RED COMMERCIAL SEAWEEDS MARKET, BY REGION, 2021–2031 ($MILLION)
TABLE 03.BROWN COMMERCIAL SEAWEEDS MARKET, BY REGION, 2021–2031 ($MILLION)
TABLE 04.GREEN COMMERCIAL SEAWEEDS MARKET, BY REGION, 2021–2031 ($MILLION)
TABLE 05.COMMERCIAL SEAWEEDS MARKET, BY FORM, 2021–2031 ($MILLION)
TABLE 06.COMMERCIAL SEAWEEDS MARKET FOR FLAKES, BY REGION, 2021–2031 ($MILLION)
TABLE 07.COMMERCIAL SEAWEEDS MARKET FOR POWDER, BY REGION, 2021–2031 ($MILLION)
TABLE 08.COMMERCIAL SEAWEEDS MARKET FOR LIQUID, BY REGION, 2021–2031 ($MILLION)
TABLE 09.COMMERCIAL SEAWEEDS MARKET, BY APPLICATION, 2021–2031 ($MILLION)
TABLE 10.COMMERCIAL SEAWEEDS MARKET FOR FOOD & BEVERAGE INDUSTRY, BY REGION, 2021–2031 ($MILLION)
TABLE 11.COMMERCIAL SEAWEEDS MARKET FOR FOOD & BEVERAGE INDUSTRY, 2021–2031 ($MILLION)
TABLE 12.COMMERCIAL SEAWEEDS MARKET FOR FOOD SERVICE, BY REGION, 2021–2031 ($MILLION)
TABLE 13.COMMERCIAL SEAWEEDS MARKET FOR FOOD PROCESSING, BY REGION, 2021–2031 ($MILLION)
TABLE 14.COMMERCIAL SEAWEEDS MARKET FOR COSMETICS & PERSONAL CARE, BY REGION, 2021–2031 ($MILLION)
TABLE 15.COMMERCIAL SEAWEEDS MARKET FOR AGRICULTURAL FERTILIZERS, BY REGION, 2021–2031 ($MILLION)
TABLE 16.COMMERCIAL SEAWEEDS MARKET FOR ANIMAL FEED ADDITIVES, BY REGION, 2021–2031 ($MILLION)
TABLE 17.COMMERCIAL SEAWEEDS MARKET FOR OTHERS, BY REGION, 2021–2031 ($MILLION)
TABLE 18.COMMERCIAL SEAWEEDS MARKET, BY REGION, 2021–2031 ($MILLION)
TABLE 19.NORTH AMERICA COMMERCIAL SEAWEEDS MARKET, BY PRODUCT, 2021–2031 ($MILLION)
TABLE 20.NORTH AMERICA COMMERCIAL SEAWEEDS MARKET, BY FORM, 2021–2031 ($MILLION)
TABLE 21.NORTH AMERICA COMMERCIAL SEAWEEDS MARKET, BY APPLICATION, 2021–2031 ($MILLION)
TABLE 22.NORTH AMERICA COMMERCIAL SEAWEEDS MARKET, BY FOOD & BEVERAGE INDUSTRY, 2021–2031 ($MILLION)
TABLE 23.NORTH AMERICA COMMERCIAL SEAWEEDS MARKET, BY COUNTRY, 2021–2031 ($MILLION)
TABLE 24.U.S. COMMERCIAL SEAWEEDS MARKET, BY PRODUCT, 2021–2031 ($MILLION)
TABLE 25.U.S. COMMERCIAL SEAWEEDS MARKET, BY FORM, 2021–2031 ($MILLION)
TABLE 26.U.S. COMMERCIAL SEAWEEDS MARKET, BY APPLICATION, 2021–2031 ($MILLION)
TABLE 27.CANADA COMMERCIAL SEAWEEDS MARKET, BY PRODUCT, 2021–2031 ($MILLION)
TABLE 28.CANADA COMMERCIAL SEAWEEDS MARKET, BY FORM, 2021–2031 ($MILLION)
TABLE 29.CANADA COMMERCIAL SEAWEEDS MARKET, BY APPLICATION, 2021–2031 ($MILLION)
TABLE 30.MEXICO COMMERCIAL SEAWEEDS MARKET, BY PRODUCT, 2021–2031 ($MILLION)
TABLE 31.MEXICO COMMERCIAL SEAWEEDS MARKET, BY FORM, 2021–2031 ($MILLION)
TABLE 32.MEXICO COMMERCIAL SEAWEEDS MARKET, BY APPLICATION, 2021–2031 ($MILLION)
TABLE 33.EUROPE COMMERCIAL SEAWEEDS MARKET, BY PRODUCT, 2021–2031 ($MILLION)
TABLE 34.EUROPE COMMERCIAL SEAWEEDS MARKET, BY FORM, 2021–2031 ($MILLION)
TABLE 35.EUROPE COMMERCIAL SEAWEEDS MARKET, BY APPLICATION, 2021–2031 ($MILLION)
TABLE 36.EUROPE COMMERCIAL SEAWEEDS MARKET, BY FOOD & BEVERAGE INDUSTRY, 2021–2031 ($MILLION)
TABLE 37.EUROPE COMMERCIAL SEAWEEDS MARKET, BY COUNTRY, 2021–2031 ($MILLION)
TABLE 38.UK COMMERCIAL SEAWEEDS MARKET, BY PRODUCT, 2021–2031 ($MILLION)
TABLE 39.UK COMMERCIAL SEAWEEDS MARKET, BY FORM, 2021–2031 ($MILLION)
TABLE 40.UK COMMERCIAL SEAWEEDS MARKET, BY APPLICATION, 2021–2031 ($MILLION)
TABLE 41.GERMANY COMMERCIAL SEAWEEDS MARKET, BY PRODUCT, 2021–2031 ($MILLION)
TABLE 42.GERMANY COMMERCIAL SEAWEEDS MARKET, BY FORM, 2021–2031 ($MILLION)
TABLE 43.GERMANY COMMERCIAL SEAWEEDS MARKET, BY APPLICATION, 2021–2031 ($MILLION)
TABLE 44.FRANCE COMMERCIAL SEAWEEDS MARKET, BY PRODUCT, 2021–2031 ($MILLION)
TABLE 45.FRANCE COMMERCIAL SEAWEEDS MARKET, BY FORM, 2021–2031 ($MILLION)
TABLE 46.FRANCE COMMERCIAL SEAWEEDS MARKET, BY APPLICATION, 2021–2031 ($MILLION)
TABLE 47.ITALY COMMERCIAL SEAWEEDS MARKET, BY PRODUCT, 2021–2031 ($MILLION)
TABLE 48.ITALY COMMERCIAL SEAWEEDS MARKET, BY FORM, 2021–2031 ($MILLION)
TABLE 49.ITALY COMMERCIAL SEAWEEDS MARKET, BY APPLICATION, 2021–2031 ($MILLION)
TABLE 50.SPAIN COMMERCIAL SEAWEEDS MARKET, BY PRODUCT, 2021–2031 ($MILLION)
TABLE 51.SPAIN COMMERCIAL SEAWEEDS MARKET, BY FORM, 2021–2031 ($MILLION)
TABLE 52.SPAIN COMMERCIAL SEAWEEDS MARKET, BY APPLICATION, 2021–2031 ($MILLION)
TABLE 53.DENMARK COMMERCIAL SEAWEEDS MARKET, BY PRODUCT, 2021–2031 ($MILLION)
TABLE 54.DENMARK COMMERCIAL SEAWEEDS MARKET, BY FORM, 2021–2031 ($MILLION)
TABLE 55.DENMARK COMMERCIAL SEAWEEDS MARKET, BY APPLICATION, 2021–2031 ($MILLION)
TABLE 56.REST OF EUROPE COMMERCIAL SEAWEEDS MARKET, BY PRODUCT, 2021–2031 ($MILLION)
TABLE 57.REST OF EUROPE COMMERCIAL SEAWEEDS MARKET, BY FORM, 2021–2031 ($MILLION)
TABLE 58.REST OF EUROPE COMMERCIAL SEAWEEDS MARKET, BY APPLICATION, 2021–2031 ($MILLION)
TABLE 59.ASIA-PACIFIC COMMERCIAL SEAWEEDS MARKET, BY PRODUCT, 2021–2031 ($MILLION)
TABLE 60.ASIA-PACIFIC COMMERCIAL SEAWEEDS MARKET, BY FORM, 2021–2031 ($MILLION)
TABLE 61.ASIA-PACIFIC COMMERCIAL SEAWEEDS MARKET, BY APPLICATION, 2021–2031 ($MILLION)
TABLE 62.ASIA-PACIFIC COMMERCIAL SEAWEEDS MARKET, BY FOOD & BEVERAGE INDUSTRY, 2021–2031 ($MILLION)
TABLE 63.ASIA-PACIFIC COMMERCIAL SEAWEEDS MARKET, BY COUNTRY, 2021–2031 ($MILLION)
TABLE 64.CHINA COMMERCIAL SEAWEEDS MARKET, BY PRODUCT, 2021–2031 ($MILLION)
TABLE 65.CHINA COMMERCIAL SEAWEEDS MARKET, BY FORM, 2021–2031 ($MILLION)
TABLE 66.CHINA COMMERCIAL SEAWEEDS MARKET, BY APPLICATION, 2021–2031 ($MILLION)
TABLE 67.INDONESIA COMMERCIAL SEAWEEDS MARKET, BY PRODUCT, 2021–2031 ($MILLION)
TABLE 68.JAPAN COMMERCIAL SEAWEEDS MARKET, BY FORM, 2021–2031 ($MILLION)
TABLE 69.INDONESIA COMMERCIAL SEAWEEDS MARKET, BY APPLICATION, 2021–2031 ($MILLION)
TABLE 70.PHILIPPINES COMMERCIAL SEAWEEDS MARKET, BY PRODUCT, 2021–2031 ($MILLION)
TABLE 71.PHILIPPINES COMMERCIAL SEAWEEDS MARKET, BY FORM, 2021–2031 ($MILLION)
TABLE 72.PHILIPPINES COMMERCIAL SEAWEEDS MARKET, BY APPLICATION, 2021–2031 ($MILLION)
TABLE 73.SOUTH KOREA COMMERCIAL SEAWEEDS MARKET, BY PRODUCT, 2021–2031 ($MILLION)
TABLE 74.SOUTH KOREA COMMERCIAL SEAWEEDS MARKET, BY FORM, 2021–2031 ($MILLION)
TABLE 75.SOUTH KOREA COMMERCIAL SEAWEEDS MARKET, BY APPLICATION, 2021–2031 ($MILLION)
TABLE 76.JAPAN COMMERCIAL SEAWEEDS MARKET, BY PRODUCT, 2021–2031 ($MILLION)
TABLE 77.JAPAN COMMERCIAL SEAWEEDS MARKET, BY FORM, 2021–2031 ($MILLION)
TABLE 78.JAPAN COMMERCIAL SEAWEEDS MARKET, BY APPLICATION, 2021–2031 ($MILLION)
TABLE 79.REST OF ASIA-PACIFIC COMMERCIAL SEAWEEDS MARKET, BY PRODUCT, 2021–2031 ($MILLION)
TABLE 80.REST OF ASIA-PACIFIC COMMERCIAL SEAWEEDS MARKET, BY FORM, 2021–2031 ($MILLION)
TABLE 81.REST OF ASIA-PACIFIC COMMERCIAL SEAWEEDS MARKET, BY APPLICATION, 2021–2031 ($MILLION)
TABLE 82.LAMEA COMMERCIAL SEAWEEDS MARKET, BY PRODUCT, 2021–2031 ($MILLION)
TABLE 83.LAMEA COMMERCIAL SEAWEEDS MARKET, BY FORM, 2021–2031 ($MILLION)
TABLE 84.LAMEA COMMERCIAL SEAWEEDS MARKET, BY APPLICATION, 2021–2031 ($MILLION)
TABLE 85.LAMEA COMMERCIAL SEAWEEDS MARKET, BY FOOD & BEVERAGE INDUSTRY, 2021–2031 ($MILLION)
TABLE 86.LAMEA COMMERCIAL SEAWEEDS MARKET, BY COUNTRY, 2021–2031 ($MILLION)
TABLE 87.SAUDI ARABIA COMMERCIAL SEAWEEDS MARKET, BY PRODUCT, 2021–2031 ($MILLION)
TABLE 88.SAUDI ARABIA COMMERCIAL SEAWEEDS MARKET, BY FORM, 2021–2031 ($MILLION)
TABLE 89.SAUDI ARABIA COMMERCIAL SEAWEEDS MARKET, BY APPLICATION, 2021–2031 ($MILLION)
TABLE 90.UNITED ARAB EMIRATES COMMERCIAL SEAWEEDS MARKET, BY PRODUCT, 2021–2031 ($MILLION)
TABLE 91.UNITED ARAB EMIRATES COMMERCIAL SEAWEEDS MARKET, BY FORM, 2021–2031 ($MILLION)
TABLE 92.UNITED ARAB EMIRATES COMMERCIAL SEAWEEDS MARKET, BY APPLICATION, 2021–2031 ($MILLION)
TABLE 93.SOUTH AFRICA COMMERCIAL SEAWEEDS MARKET, BY PRODUCT, 2021–2031 ($MILLION)
TABLE 94.SOUTH AFRICA COMMERCIAL SEAWEEDS MARKET, BY FORM, 2021–2031 ($MILLION)
TABLE 95.SOUTH AFRICA COMMERCIAL SEAWEEDS MARKET, BY APPLICATION, 2021–2031 ($MILLION)
TABLE 96.TANZANIA COMMERCIAL SEAWEEDS MARKET, BY PRODUCT, 2021–2031 ($MILLION)
TABLE 97.TANZANIA COMMERCIAL SEAWEEDS MARKET, BY FORM, 2021–2031 ($MILLION)
TABLE 98.TANZANIA COMMERCIAL SEAWEEDS MARKET, BY APPLICATION, 2021–2031 ($MILLION)
TABLE 99.REST OF LAMEA COMMERCIAL SEAWEEDS MARKET, BY PRODUCT, 2021–2031 ($MILLION)
TABLE 100.REST OF LAMEA COMMERCIAL SEAWEEDS MARKET, BY FORM, 2021–2031 ($MILLION)
TABLE 101.REST OF LAMEA COMMERCIAL SEAWEEDS MARKET, BY APPLICATION, 2021–2031 ($MILLION)
TABLE 102.CARGILL, INCORPORATED. - KEY EXECUTIVES
TABLE 103.CARGILL, INCORPORATED. - COMPANY SNAPSHOT
TABLE 104.CARGILL, INCORPORATED. - OPERATING BUSINESS SEGMENTS
TABLE 105.CARGILL, INCORPORATED. - PRODUCT PORTFOLIO
TABLE 106.CARGILL INCORPORATED.: NET SALES, 2019–2021 ($MILLION)
TABLE 107.CARGILL, INCORPORATED. - KEY STRATEGIC MOVE(S)
TABLE 108.CJ CHEILJEDANG CORP.- KEY EXECUTIVES
TABLE 109.CJ CHEILJEDANG CORP.- COMPANY SNAPSHOT
TABLE 110.CJ CHEILJEDANG CORP.-OPERATING BUSINESS SEGMENTS
TABLE 111.CJ CHEILJEDANG CORP.- PRODUCT PORTFOLIO
TABLE 112.CJ CHEILJEDANG CORP. -KEY STRATEGIC MOVES AND DEVELOPMENTS
TABLE 113.CORBION N.V. - KEY EXECUTIVES
TABLE 114.CORBION N.V. - COMPANY SNAPSHOT
TABLE 115.CORBION N.V. -OPERATING BUSINESS SEGMENTS
TABLE 116.CORBION N.V. - PRODUCT PORTFOLIO
TABLE 117.CORBION N.V. - R&D EXPENDITURES, 2019–2021 ($MILLION)
TABLE 118.CORBION N.V. - NET SALES, 2019-2021 ($MILLION)
TABLE 119.CORBION N.V. -KEY STRATEGIC MOVES AND DEVELOPMENTS
TABLE 120.GIMMESEAWEED - KEY EXECUTIVES
TABLE 121.GIMMESEAWEED - COMPANY SNAPSHOT
TABLE 122.GIMMESEAWEED -OPERATING BUSINESS SEGMENTS
TABLE 123.GIMMESEAWEED - PRODUCT PORTFOLIO
TABLE 124.IRISH SEAWEEDS - KEY EXECUTIVES
TABLE 125.IRISH SEAWEEDS - COMPANY SNAPSHOT
TABLE 126.IRISH SEAWEEDS -OPERATING BUSINESS SEGMENTS
TABLE 127.IRISH SEAWEEDS - PRODUCT PORTFOLIO
TABLE 128.J.M. HUBER CORPORATION - KEY EXECUTIVES
TABLE 129.J.M. HUBER CORPORATION - COMPANY SNAPSHOT
TABLE 130.J.M. HUBER CORPORATION -OPERATING BUSINESS SEGMENTS
TABLE 131.J.M. HUBER CORPORATION - PRODUCT PORTFOLIO
TABLE 132.MARA SEAWEED - KEY EXECUTIVES
TABLE 133.MARA SEAWEED - COMPANY SNAPSHOT
TABLE 134.MARA SEAWEED -OPERATING BUSINESS SEGMENTS
TABLE 135.MARA SEAWEED - PRODUCT PORTFOLIO
TABLE 136.OCEAN HARVEST TECHNOLOGY LIMITED - KEY EXECUTIVES
TABLE 137.OCEAN HARVEST TECHNOLOGY LIMITED - COMPANY SNAPSHOT
TABLE 138.OCEAN HARVEST TECHNOLOGY LIMITED -OPERATING BUSINESS SEGMENTS
TABLE 139.OCEAN HARVEST TECHNOLOGY LIMITED - PRODUCT PORTFOLIO
TABLE 140.QINGDAO GATHER GREAT OCEAN ALGAE INDUSTRY GROUP CO., LTD.- KEY EXECUTIVES
TABLE 141.QINGDAO GATHER GREAT OCEAN ALGAE INDUSTRY GROUP CO., LTD.- COMPANY SNAPSHOT
TABLE 142.QINGDAO GATHER GREAT OCEAN ALGAE INDUSTRY GROUP CO., LTD. -OPERATING BUSINESS SEGMENTS
TABLE 143.QINGDAO GATHER GREAT OCEAN ALGAE INDUSTRY GROUP CO., LTD - PRODUCT PORTFOLIO
TABLE 144.ROLAND FOODS, LLC. - KEY EXECUTIVES
TABLE 145.ROLAND FOODS, LLC. - COMPANY SNAPSHOT
TABLE 146.ROLAND FOODS, LLC. -OPERATING BUSINESS SEGMENTS
TABLE 147.ROLAND FOODS, LLC. - PRODUCT PORTFOLIO
TABLE 148.ROLAND FOODS, LLC. -KEY STRATEGIC MOVES AND DEVELOPMENTS
TABLE 149.SEASNAX. - KEY EXECUTIVES
TABLE 150.SEASNAX. - COMPANY SNAPSHOT
TABLE 151.SEASNAX. -OPERATING BUSINESS SEGMENTS
TABLE 152.SEASNAX. - PRODUCT PORTFOLIO
TABLE 153.SEASOL - KEY EXECUTIVES
TABLE 154.SEASOL - COMPANY SNAPSHOT
TABLE 155.SEASOL -OPERATING BUSINESS SEGMENTS
TABLE 156.SEASOL - PRODUCT PORTFOLIO
TABLE 157.SEAWEED & CO. - KEY EXECUTIVES
TABLE 158.SEAWEED & CO. - COMPANY SNAPSHOT
TABLE 159.SEAWEED & CO.-OPERATING BUSINESS SEGMENTS
TABLE 160.SEAWEED & CO. - PRODUCT PORTFOLIO
TABLE 161.SINGHA CORPORATION CO. LTD. - KEY EXECUTIVES
TABLE 162.SINGHA CORPORATION CO. LTD.- COMPANY SNAPSHOT
TABLE 163.SINGHA CORPORATION CO. LTD.-OPERATING BUSINESS SEGMENTS
TABLE 164.SINGHA CORPORATION CO. LTD.- PRODUCT PORTFOLIO
TABLE 165.TAOKAENOI FOOD & MARKETING PCL. - KEY EXECUTIVES
TABLE 166.TAOKAENOI FOOD & MARKETING PCL. - COMPANY SNAPSHOT
TABLE 167.TAOKAENOI FOOD & MARKETING PCL. -OPERATING BUSINESS SEGMENTS
TABLE 168.TAOKAENOI FOOD & MARKETING PCL. - PRODUCT PORTFOLIO
TABLE 169.TAOKAENOI FOOD & MARKETING PCL. - NET SALES, 2019-2021 ($MILLION)

LIST OF FIGURES

FIGURE 01.COMMERCIAL SEAWEEDS MARKET SNAPSHOT
FIGURE 02.COMMERCIAL SEAWEEDS MARKET SEGMENTATION
FIGURE 03.TOP INVESTMENT POCKETS, 2021–2031
FIGURE 04.PLAYER POSITIONING OF TOP 15 KEY PLAYERS
FIGURE 05.LOW BARGAINING POWER OF SUPPLIERS
FIGURE 06.HIGH BARGAINING POWER OF BUYERS
FIGURE 07.LOW THREAT OF NEW ENTRANTS
FIGURE 08.LOW THREAT OF SUBSTITUTION
FIGURE 09.MODERATE INTENSITY OF COMPETITIVE RIVALRY
FIGURE 10.COMMERCIAL SEAWEEDS MARKET: DRIVERS, RESTRAINTS, AND OPPORTUNITIES, 2021–2031
FIGURE 11.MARKET SHARE ANALYSIS, BY PRODUCT, 2021 & 2031 (%)
FIGURE 12.MARKET SHARE ANALYSIS, BY FORM, 2021 & 2031 (%)
FIGURE 13.MARKET SHARE ANALYSIS, BY APPLICATION, 2021 & 2031 (%)
FIGURE 14.MARKET SHARE ANALYSIS, BY REGION, 2021 & 2031 (%)
FIGURE 15.COMMERCIAL SEAWEEDS MARKET, BY PRODUCT, 2021 (%)
FIGURE 16.COMPARATIVE SHARE ANALYSIS OF RED COMMERCIAL SEAWEEDS MARKET REVENUE, BY COUNTRY, 2021 & 2031 (%)
FIGURE 17.COMPARATIVE SHARE ANALYSIS OF BROWN COMMERCIAL SEAWEEDS MARKET REVENUE, BY COUNTRY,  2021 & 2031 (%)
FIGURE 18.COMPARATIVE SHARE ANALYSIS OF GREEN COMMERCIAL SEAWEEDS MARKET REVENUE, BY COUNTRY,  2021 & 2031 (%)
FIGURE 19.COMMERCIAL SEAWEEDS MARKET, BY FORM, 2021 (%)
FIGURE 20.COMPARATIVE SHARE ANALYSIS OF COMMERCIAL SEAWEEDS MARKET REVENUE FOR FLAKES, BY COUNTRY, 2021 & 2031 (%)
FIGURE 21.COMPARATIVE SHARE ANALYSIS OF COMMERCIAL SEAWEEDS MARKET REVENUE FOR POWDER, BY COUNTRY, 2021 & 2031 (%)
FIGURE 22.COMPARATIVE SHARE ANALYSIS OF COMMERCIAL SEAWEEDS MARKET REVENUE FOR LIQUID, BY COUNTRY, 2021 & 2031 (%)
FIGURE 23.COMMERCIAL SEAWEEDS MARKET, BY APPLICATION, 2021 (%)
FIGURE 24.COMPARATIVE SHARE ANALYSIS OF COMMERCIAL SEAWEEDS MARKET REVENUE FOR FOOD & BEVERAGE INDUSTRY, BY COUNTRY, 2021 & 2031 (%)
FIGURE 25.COMPARATIVE SHARE ANALYSIS OF COMMERCIAL SEAWEEDS MARKET REVENUE FOR COSMETICS & PERSONAL CARE, BY COUNTRY, 2021 & 2031 (%)
FIGURE 26.COMPARATIVE SHARE ANALYSIS OF COMMERCIAL SEAWEEDS MARKET REVENUE FOR AGRICULTURAL FERTILIZERS, BY COUNTRY, 2021 & 2031 (%)
FIGURE 27.COMPARATIVE SHARE ANALYSIS OF COMMERCIAL SEAWEEDS MARKET REVENUE FOR ANIMAL FEED ADDITIVES, BY COUNTRY, 2021 & 2031 (%)
FIGURE 28.COMPARATIVE SHARE ANALYSIS OF COMMERCIAL SEAWEEDS MARKET REVENUE FOR OTHERS, BY COUNTRY, 2021 & 2031 (%)
FIGURE 29.COMMERCIAL SEAWEEDS MARKET, BY REGION, 2021 (%)
FIGURE 30.U.S. COMMERCIAL SEAWEEDS MARKET, 2021–2031 ($MILLION)
FIGURE 31.CANADA COMMERCIAL SEAWEEDS MARKET, 2021–2031 ($MILLION)
FIGURE 32.MEXICO COMMERCIAL SEAWEEDS MARKET, 2021–2031 ($MILLION)
FIGURE 33.UK COMMERCIAL SEAWEEDS MARKET, 2021–2031 ($MILLION)
FIGURE 34.GERMANY COMMERCIAL SEAWEEDS MARKET, 2021–2031 ($MILLION)
FIGURE 35.FRANCE COMMERCIAL SEAWEEDS MARKET, 2021–2031 ($MILLION)
FIGURE 36.ITALY COMMERCIAL SEAWEEDS MARKET, 2021–2031 ($MILLION)
FIGURE 37.SPAIN COMMERCIAL SEAWEEDS MARKET, 2021–2031 ($MILLION)
FIGURE 38.DENMARK COMMERCIAL SEAWEEDS MARKET, 2021–2031 ($MILLION)
FIGURE 39.REST OF EUROPE COMMERCIAL SEAWEEDS MARKET, 2021–2031 ($MILLION)
FIGURE 40.CHINA COMMERCIAL SEAWEEDS MARKET, 2021–2031 ($MILLION)
FIGURE 41.INDONESIA COMMERCIAL SEAWEEDS MARKET, 2021–2031 ($MILLION)
FIGURE 42.PHILIPPINES COMMERCIAL SEAWEEDS MARKET, 2021–2031 ($MILLION)
FIGURE 43.SOUTH KOREA COMMERCIAL SEAWEEDS MARKET, 2021–2031 ($MILLION)
FIGURE 44.JAPAN COMMERCIAL SEAWEEDS MARKET, 2021–2031 ($MILLION)
FIGURE 45.REST OF ASIA-PACIFIC COMMERCIAL SEAWEEDS MARKET, 2021–2031 ($MILLION)
FIGURE 46.SAUDI ARABIA COMMERCIAL SEAWEEDS MARKET, 2021–2031 ($MILLION)
FIGURE 47.UNITED ARAB EMIRATES COMMERCIAL SEAWEEDS MARKET, 2021–2031 ($MILLION)
FIGURE 48.SOUTH AFRICA COMMERCIAL SEAWEEDS MARKET, 2021–2031 ($MILLION)
FIGURE 49.TANZANIA COMMERCIAL SEAWEEDS MARKET, 2021–2031 ($MILLION)
FIGURE 50.REST OF LAMEA COMMERCIAL SEAWEEDS MARKET, 2021–2031 ($MILLION)
FIGURE 51.TOP WINNING STRATEGIES, BY YEAR, 2019–2022*
FIGURE 52.TOP WINNING STRATEGIES, BY DEVELOPMENT, 2019–2022* (%)
FIGURE 53.TOP WINNING STRATEGIES, BY COMPANY, 2019–2022*
FIGURE 54.PRODUCT MAPPING OF TOP 15 KEY PLAYERS
FIGURE 55.COMPETITIVE DASHBOARD OF TOP 15 KEY PLAYERS
FIGURE 56.COMPETITIVE HEATMAP OF TOP 15 KEY PLAYERS
FIGURE 57.CARGILL, INCORPORATED.: NET SALES, 2019–2021 ($MILLION)
FIGURE 58.CARGILL, INCORPORATED.: REVENUE SHARE, BY SEGMENT, 2021 (%)
FIGURE 59.CORBION N.V.: R&D EXPENDITURES, 2019–2021 ($MILLION)
FIGURE 60.CORBION N.V.: NET SALES, 2019-2021 ($MILLION)
FIGURE 61.CORBION N.V.: REVENUE SHARE, BY SEGMENT, 2021 (%)
FIGURE 62.CORBION N.V.: REVENUE SHARE, BY REGION, 2021 (%)
FIGURE 63.TAOKAENOI FOOD & MARKETING PCL.: NET SALES, 2019-2021 ($MILLION)
FIGURE 64.TAOKAENOI FOOD & MARKETING PCL.: REVENUE SHARE, BY SEGMENT, 2021 (%)
FIGURE 65.TAOKAENOI FOOD & MARKETING PCL.: REVENUE SHARE, BY REGION, 2021 (%)


The perspectives of the leading CXOs in the commercial seaweed industry are presented in this section. Demand for seaweed products has increased as a result of consumer lifestyle changes, increased health awareness, and changes in taste preferences. The demand for seaweed as food has expanded along with the influx of people from Asia-Pacific nations into North America and Europe, fueling the expansion of the commercial seaweed industry.

For instance, Nori, which is frequently used by Japanese people to wrap a sushi roll, can be purchased in American grocery shops like Whole Foods as roasted seaweed snacks. Furthermore, in North America, seaweed growers have embraced a number of innovative practices like vertical or 3D farming, which uses the water column to cultivate seaweeds. As part of the Blue Growth project of the European Union to investigate the use of seaweed in various end-use industries, European policymakers have recently pushed for the development of seaweed farming. As a result, it is projected that unexplored markets in North America and Europe will create new opportunities for seaweed producers. Examples of these applications include animal feed, fertilizer, biofuel, and wastewater treatment. However, the market for commercial seaweed is hampered by price instability and shifting weather patterns.

PURCHASE OPTIONS

Call or Email us

U.S.-Canada Toll-free: +1-800-792-5285
Int'l : +1-503-894-6022
Europe : +44-845-528-1300
Email : help@alliedmarketresearch.com
 
FREQUENTLY ASKED QUESTIONS?

A. The global commercial seaweeds market was valued at $17,908.9 million in 2021, and is projected to reach $45,596.4 million by 2031, registering a CAGR of 9.8% from 2022 to 2031.

A. The forecast period in the commercial seaweeds market report is 2022 to 2031.

A. The base year calculated in the commercial seaweeds market report is 2021.

A. The top companies analyzed for global commercial seaweeds market report are Cargill Incorporated, CJ Cheiljedang Corporation, Corbion NV, Gimme Health Foods Inc., Irish Seaweeds, J.M. Huber Corporation, Mara Seaweed, Ocean Harvest Technology Limited, Qingdao Gather Great Ocean Algae Industry Group Co., Ltd (GGOG), Roland Foods, LLC, SeaSnax, Seasol, Seaweed & Co., Singha Corporation Co. Ltd., and Taokaenoi Food & Marketing PCL.

A. The red segment is the most influential segment in the commercial seaweeds market report.

A. Asia-Pacific holds the maximum market share of the commercial seaweeds market.

A. The company profile has been selected on the basis of key developments such as partnership, product launch, merger and acquisition.

A. The market value of the commercial seaweeds market in 2021 was $17,908.9 million.

Looking for Customization?

 Customization Request

Have a Question?

 Speak with Analyst

Any Confusion?

 Inquire Before Buying

Have a glance of the Report

  Request Sample
RELATED TAGS

Purchase Full Report of
Commercial Seaweeds Market

Start reading instantly.
This Report and over 66,805+ more Reports, Available with Avenue Library. T&C*.

  • Online Only
  • $3,570
  • Online cloud access only
  • Restricted print, copy, paste & download
  • Read only
  • Free industry update
    (Within 180 days)
  • Free report update in next update cycle
    (Oct 2023 - Oct 2024)
  • Data Pack
  • $3,840
  • Restricted to one authorized user
  • One print only
  • Available in
    Excel
  • Free industry update
    (Within 180 days)
  •   Free report update in next update cycle
    (Oct 2023 - Oct 2024)
  • Single User
  • $5,730
  • Restricted to one authorized user
  • One print only
  • Available in
    PDF
  • Free industry update
    (Within 180 days)
  •   Free report update in next update cycle
    (Oct 2023 - Oct 2024)
  • Five Users
  • $6,450
  • Limited to five authorized users
  • Print upto five copies
  • Available in
    PDF
  • Free industry update
    (Within 180 days)
  •   Free report update in next update cycle
    (Oct 2023 - Oct 2024)
  • Enterprise
    License/PDF

  • $9,600
  • Unlimited
    within
    company/enterprise
  • Available in Excel & PDF
  • Free industry update
    (Within 180 days)
  •   Free report update in next update cycle
    (Oct 2023 - Oct 2024)
  • Library
    Membership

  • $999 $ 1,175
    Per User/ Per month/ Billed annually
  • Published Content
    E-access
  • Company Profiles
    E-access
  • Newly Added Content Access
  • 10 PDF
    Downloads
  • 5 Excel Data
    Pack Downloads
  • 250 Company Profiles PDF Downloads
  • Buy Now

*Taxes/Fees, if applicable will be added during checkout. All prices in USD

RELATED REPORTS
 

Why Allied Market Research?


Infallible Methodology

To ensure high-level data integrity, accurate analysis, and impeccable forecasts

Analyst Support

For complete satisfaction

Customization

On-demand customization of scope of the report to exactly meet your needs

TARGETED MARKET VIEW

Targeted market view to provide pertinent information and save time of readers

Get fresh content delivered

Get insights on topics that are crucial for your business. Stay abreast of your interest areas.

Get Industry Data Alerts

Why Allied Market Research?

Infallible Methodology

To ensure high-level data integrity, accurate analysis, and impeccable forecasts

Analyst Support

For complete satisfaction

Customization

On-demand customization of scope of the report to exactly meet your needs

TARGETED MARKET VIEW

Targeted market view to provide pertinent information and save time of readers